Pythagoras and the White Sox
Baseball, it is said, is only a game. True. And the Grand Canyon is only a hole in Arizona. Not all holes, or games, are created equal.
– George Will
I am a failed baseball player. I purloined the above quote from Mr. Will, but it is just as true of me as it is of him, and I suspect, many of you. Although I could never play the game at the level that all red-blooded American boys dream of, I, like you, find it endlessly fascinating and always a welcome distraction in our ever more complex world. And that’s why I’m very excited to be joining the lineup of The Hardball Times, or at least pinch hitting from time to time. My ruminations will hopefully contribute to your distraction and keep you thinking about our shared passion. A big thanks to Dave Studeman and Aaron Gleeman for bringing me on board.
Enough of the preliminaries. You may know that I struggle with baseball questions and occasionally other topics on my blog, Dan Agonistes (Agonistes is a Greek word that means “the struggler” and was used most famously in John Milton’s 1671 tragedy “Samson Agonistes”, which recounts the end of Samson’s life). Well, recently I wrote a short piece called “Luck Ball” where I took Joe Morgan of ESPN’s Sunday Night Baseball to task for singing the praises of the White Sox exotic new brand of baseball manager Ozzie Guillen has christened “Smart Ball”.
To paraphrase my main point (I wasn’t really saying anything that others on this site have not said before, so forgive me for preaching to the choir) the White Sox 49-22 record and 10-game lead in the AL Central simply cannot be attributed to a new aggressive style of offensive play that focuses on moving runners along. Their .690 winning percentage is largely a function of the excellent pitching they’ve received from primarily seven of their pitchers who are pitching the lion’s share of their innings and having great, albeit in some cases non-normative, years. I backed this up by noting the following:
Year    R/G    AL Rank  Opp R/G   AL Rank
2005    4.85        5     3.82         1
2004    5.33        3     5.13        10
The Smart Ball Sox of 2005 are actually scoring fewer runs per game than the Dumb Ball Sox of 2004. It is the run prevention side of the house where the improvement lies. Some might argue that an improved defense is the key, but as Studes has shown, their improvement in Defensive Efficiency Rating (DER) cannot possibly account for a difference of around 1.3 runs per game.
My second point was that even given their excellent pitching, their number of expected wins given their ratio of runs scored to runs allowed using the Pythagorean formula is around 44. This +5 difference can be attributed to their 20-8 record in one-run games. My contention was that a .714 winning percentage in one-run contests is probably not sustainable (at least there is no evidence that one-run wins are a matter of managerial skill or team ability), nor is the Sox pitching likely to perform at the current level all season. What that adds up to is the Sox coming back towards the pack in the AL Central and the Twins opportunity to win a fourth consecutive division title. As an addendum to the discussion href=”http://www.hardballtimes.com/main/article/ten-things-i-didnt-know-last-week11/” target=”_new”>Studes has shown how the Sox have been remarkably consistent in scoring between four and seven runs this season, which is the sweet spot for a winning team, especially one that has good pitching.
What prompted me to write this article, however, was a comment on David Pinto’s excellent Baseball Musings blog which asked how reliable the Pythagorean method is mid-season. Having never thought about that question before, I decided to take a quick look. After all, inquiring minds want to know.
As you’ll remember the Pythagorean method (or formula) is a Bill James creation that predicts a team’s wining percentage given their ratio of runs scored to runs allowed using the formula:
Expected Winning % = (RS^2) / ((RS^2)+(RA^2))
There have been others who have refined this formula through either using an exponent that varies from two (e.g., 1.83) or calculating the exponent based on the run environment as the guys at Baseball Prospectus did in their Pythagenport formula where the exponent is:
X = .45 + 1.5 * log10 ((RS+RA)/G)
In any case, I calculated all three variants of the Pythagorean formula for each team at various points in the 2004 season (thanks to Retrosheet). I labeled the classic James formula as P, the formula using exponent 1.83 as P1, and Pythagenport as P2. For example, on April 10 I calculated the Pythagorean winning percentage for each team given their runs scored and runs allowed at that point in the season. I then calculated the difference between their actual winning percentage on that date and their expected winning percentage. Finally, I took the difference between the actual versus the expected winning percentages and computed the average difference and the standard deviation of the difference. In the case of April 10, when the average team had played five games, that difference was 103 percentage points and the standard deviation was 66 points using James standard formula. The other results were as follows:
        Avg G   P-avg  P-stdevp    P1-avg  P1-stdevp     P2-avg   P2-stdevp
10-Apr      5   0.103     0.066     0.103      0.068      0.106       0.069
15-Apr      9   0.071     0.054     0.071      0.054      0.072       0.051
30-Apr     22   0.049     0.034     0.049      0.034      0.049       0.034
30-May     49   0.034     0.026     0.035      0.023      0.035       0.024
30-Jun     76   0.027     0.021     0.028      0.021      0.027       0.021
30-Jul    102   0.025     0.017     0.026      0.016      0.025       0.016
30-Aug    130   0.021     0.015     0.022      0.015      0.022       0.015
5-Oct     162   0.019     0.018     0.021      0.018      0.020       0.017
What’s interesting is that the three formulas are remarkably close, and that by the end of May or around the 50-game mark, the formulas do a pretty good job of estimating a team’s winning percentage at that point. By May 30, the average error is around 35 percentage points with a standard deviation of 26 percentage points. Those 35 points equates to about five and a half wins over a 162 games. By the 162-game mark the average error is reduced to just 21 percentage points with about a 15-point standard deviation, which is the equivalent of three wins over the course of the season. The following table expresses the average error of the three formulas in wins per 162 games.
         Avg G      P      P1      P2
10-Apr      5    16.7    16.7    17.2
15-Apr      9    11.5    11.5    11.7
30-Apr     22     7.9     7.9     7.9
30-May     49     5.5     5.7     5.7
30-Jun     76     4.4     4.5     4.4
30-Jul    102     4.1     4.2     4.1
30-Aug    130     3.4     3.6     3.6
5-Oct     162     3.1     3.4     3.2
Of course we can also take a look at the average error and standard deviation graphically as shown below.

The steep curve and the leveling off after the end of May confirm that after around the 50-game mark the Pythagorean formulas do a pretty good job of estimating a team’s actual record at that point in the season.
However, the questioner probably wasn’t asking how well the Pythagorean formula performed against the actual record of the team at a point during the season, but rather how well the formula does at predicting a team’s final won-lost record before the season ends. To test this I calculated the correlation coefficient (a value between 1 and -1 that measures the linear relationship between two sets of data) between a team’s winning percentage at the eight points in the 2004 season shown above and the team’s final winning percentage. I did the same for the Pythagorean winning percentage using the standard formula.

        Avg G   Actual     Pyth
10-Apr      5    0.270    0.787
15-Apr      9    0.347    0.801
30-Apr     22    0.649    0.869
30-May     49    0.771    0.869
30-Jun     76    0.797    0.887
30-Jul    102    0.930    0.916
30-Aug    130    0.975    0.947
5-Oct     162    1.000    0.951
Interestingly, through the middle of July, a team’s final ranking in 2004 was more accurately predicted by their Pythagorean winning percentage than their actual winning percentage. In other words, the Pythagorean formula does a better job of predicting the order of the teams by winning percentage at the end of the season than does their actual winning percentage before the middle of July. After that time the two are pretty close up until season end when of course the correlation coefficient becomes one (perfect) for the actual winning percentage. I was somewhat surprised that the correlations were so strong for the Pythagorean method so early in the season.
This implies that you should be able to make predictions as to which teams will be contenders early in the season. This wouldn’t work as well of course for predicting playoff teams though because of the complications of the division structure and the wild card.
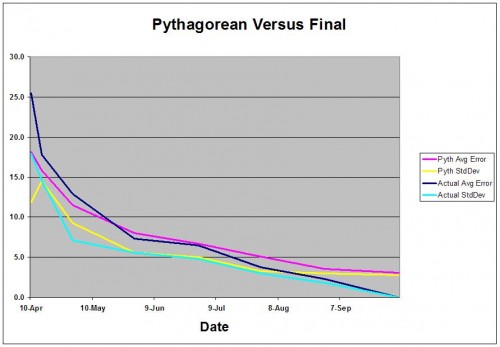
Another way to look at the accuracy of the Pythagorean formula during the season, however, is to compute the average error in predicting a team’s final number of wins at points in the season as opposed to that predicted by their actual won/loss record at those same points. I did so for the basic Pythagorean formula and also computed the standard deviation for the error as shown below.
              PythW%          ActualW%
       AvgG   AvgE   StdDev   AvgE   StdDev
10-Apr    5   18.2    11.9    25.5    18.0
15-Apr    9   15.8    14.5    17.8    14.6
30-Apr   22   11.5     9.3    12.9     7.1
30-May   49    8.0     5.6     7.3     5.6
30-Jun   76    6.7     5.0     6.5     4.8
30-Jul  102    5.1     3.3     3.8     3.0
30-Aug  130    3.6     3.0     2.3     1.8
5-Oct   162    3.1     2.8     0.0     0.0
From this you can see that through the middle of May, the Pythagorean formula more accurately predicts a team’s final number of wins than does the team’s actual record. After that, however, you’d be better off using the team’s actual winning percentage to predict how many game they’ll win. In the graph below note the point where the blue and pink lines cross—that is the point where the actual winning percentage is more accurate than the Pythagorean winning percentage. Note that they also track pretty well through July and then begin to diverge as we enter August.
So in response to our questioner, I would answer that during a season the Pythagorean formula does a good job of predicting which teams will likely stay in the race for the duration, but as we get into June, the number of games a team will win is equally or better predicted by their actual winning percentage at that time.
References & Resources
Some post-publication corrections to this article have been posted in my blog.