Dissecting Plate Discipline (Part 2)
In Part 1 of Dissecting Plate, I took a look at three stats which I felt dug a little deeper into a player’s plate discipline and I showed how they correlated with either walks, strikeouts or home runs. Since the correlations are fairly high, we should be able to come up with an expected number of walks, strikeouts and home runs based on the components of a player’s plate discipline.
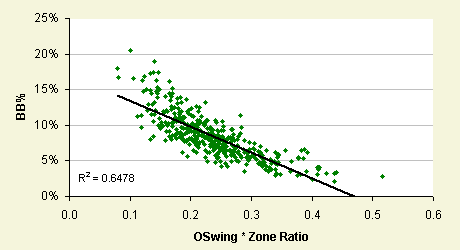
Let’s start with expected walk percentage (xBB%). You’ll remember that there were two stats that have a high correlation with walks. The first is ZRatio, which also has some correlation with home runs, and the second was OSwing which only correlated well with walks. If you multiply a batter’s ZRatio and OSwing, you essentially come up with a proxy for how often a player should be walking.
What I find most interesting about xBB% is when you see large discrepancies with actual BB%. Looking at the players who walk more than their xBB% implies, you’ll see highly skilled players like Jason Giambi, Jim Thome, and Todd Helton. Our good friend Russell Branyan also shows up in the top 10. Perhaps behind his monster swing there lays some potential.
Walked More than xBB%		Walked Less than xBB%
Jason Giambi	7.19%		Todd Linden	-3.35%
Jim Thome	6.92%		Carlos Baerga	-3.37%
Jose Valentin	5.70%		Chris Magruder	-3.45%
Adam Dunn	5.34%		Oscar Robles	-3.46%
Russell Branyan	5.10%		John Olerud	-3.59%
Todd Helton	5.05%		Alex Cora	-3.71%
Angel Berroa	4.58%		N. Garciaparra	-3.81%
John Rodriguez	4.49%		Orlando Hudson	-4.17%
Jim Edmonds	4.44%		Kenny Lofton	-4.18%
Craig Wilson	4.33%		Tike Redman	-4.38%
The players who walk less than their xBB% suggests are mostly contact hitters, but notice how Nomar Garciaparra shows up on the list. Is that a sign that he was just unfortunate in 2005 and we can expect a rebound in walks? Since I only have one season of data, it’d be silly to draw multi-season conclusions, but it certainly makes you wonder.
Moving on, the one stat which correlated extremely well with strikeouts was Contact, so we’ll use that to calculate a player’s expected strikeout percentage (xK%). Since striking out and walking appear to be two entirely different skills, I’m not going to use ZRatio in calculating xK%.
Struckout More than xK%		Struckout Less than xK%
Jayson Werth	9.90%		Brian Schneider	-5.38%
Frank Menechino	9.84%		Rondell White	-5.39%
Todd Linden	9.24%		Garret Anderson	-5.49%
Chip Ambres	9.23%		Sammy Sosa	-5.74%
Nick Punto	9.15%		Jorge Cantu	-5.86%
Mark Bellhorn	7.76%		Sal Fasano	-6.02%
Jason Dubois	6.96%		Mike Sweeney	-6.54%
Jamey Carroll	6.84%		Andruw Jones	-7.07%
Jason Giambi	6.83%		Moises Alou	-7.28%
Chris Woodward	6.38%		V. Guerrero	-7.29%
Once again, the large discrepancies are the most interesting. Vladimir Guerrero’s xK% suggests he should strike out a lot more than he does. Most of the best players in baseball are better than their xK% suggests. Looking at the top 10 players that strike out more than their xK% indicates, there are a bunch of not so high profile players except for Jason Giambi. Perhaps he was swinging a little harder than he usually would to prove he could still hit home runs?
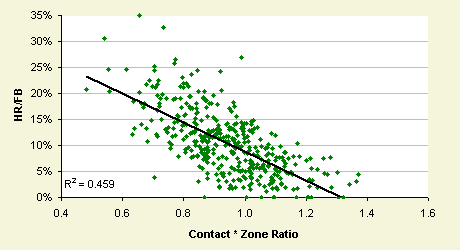
Finally, there’s expected Home Runs (xHR), which we’ll calculate using both Contact and ZRatio, which both correlated with home runs-per-fly ball. Multiply the two, and the correlation becomes much stronger. From that we can calculate a player’s expected home runs per fly ball, and then finally actual expected Home Runs.
Looking at the players who hit more home runs than expected, these are obviously many of the power hitters in baseball. What I find more interesting are those who hit fewer home runs than their xHR suggests. Brad Wilkerson (-13) and Vinny Castilla (-9) were definitely not helped by R.F.K. Stadium’s spacious outfield. It will be interesting to see if these player’s home run totals will rebound this coming season.
More Home Runs than xHR		Less Home Runs than xHR
Alex Rodriguez	20		Brian Giles	-9
Derrek Lee	19		Marcus Giles	-9
Manny Ramirez	19		Vinny Castilla	-9
Andruw Jones	16		Mike Lowell	-9
Albert Pujols	16		Darin Erstad	-9
Tony Clark	15		J.T. Snow	-9
Mark Teixeira	14		Jeremy Reed	-11
Paul Konerko	14		Adam Kennedy	-11
Ken Griffey Jr.	14		Alex Gonzalez	-12
Jermaine Dye	14		Brad Wilkerson	-13
I honestly don’t know whether these differences in expected versus actual walks, strikeouts, and home runs will hold up from season to season, but all of these stats surely have some element of chance in them. The correlations were too close in my opinion to not do this exercise. Hopefully looking at baseball data on a more granular level will help us better weed out the fluke season.