Franmil Reyes and the Rise of the Solo Shot

Franmil Reyes is quite adept at hitting solo home runs. (via Ian D’Andrea)
It is time to talk about San Diego’s most exciting hitter. He’s young and he can hit dingers.
That’s right, I’m talking about Franmil Reyes! If you thought that I was talking about Manny Machado or Fernando Tatis Jr., then maybe take another look at the title of this article. Reyes is a fascinating player in that he can hit home runs, but for some reason almost all of them come without a runner on base. He has hit 24 career home runs, and 18 of them have been solo shots. He has only 42 career RBI; among all players in major league history with at least 24 home runs, those 42 RBI are the fewest. And it is not because he pinch hits. In fact, only one of his home runs came when he did not have multiple plate appearances, and that home run was a two-run shot.
Perhaps this is just a fluke. After all, the Padres had a major league-worst .297 OBP last season, and this season has not been any better (through yesterday, they’ve been good for .287 – 28th in baseball). But Reyes’ ability to hit home runs is no fluke – this season, his average exit velocity is 94.0 mph (12th in baseball) and his barrels/PA% is 12.8% per Statcast (tied for eighth in baseball with Christian Yelich). In addition, his contact rate seems to keep improving.
I have a theory to explain Reyes’ numbers: With his power, who cares if there are any runners on? He has the potential to hit one out every single plate appearance, so he might as well swing for the fences every time. But Reyes is not the only one who appears to be hitting more solo shots – it is a trend that is going up in baseball.
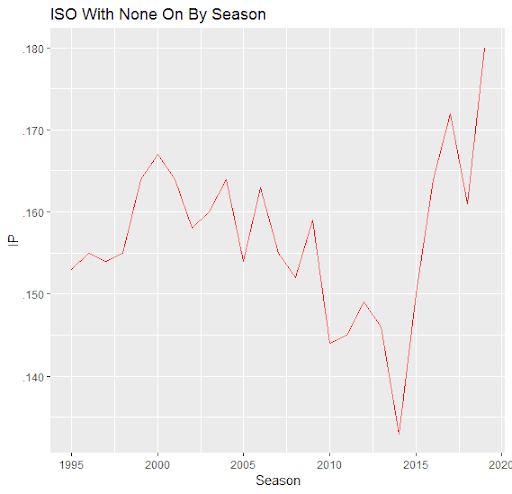
In 2014 the ball was not going out, and isolated power was way down. The major league wide average has fluctuated over the years; isolated power is even higher than it was in the early 2000s, and currently higher than in 2017. (The ball appeared less lively in 2018, but the early season numbers in 2019, and research into the ball, suggest that we’ve returned to a livelier ball yet again.) Although isolated power is higher overall, the numbers without runners on base have increased more than when runners are on base – the league-wide ISO with nobody on has increased from .161 in 2018 to .176 this season compared to .162 and .172 with men on base.
And while home runs have increased overall, it is important to note that the rate of solo shots is increasing at an even higher rate, and decreased at a lower rate last season:
| Season | Solo HR | Solo HR – Prev. Season | Percent Change |
|---|---|---|---|
| 2018 | 3316 | 3603 | -7.96% |
| 2017 | 3603 | 3332 | 8.13% |
| 2016 | 3332 | 2887 | 15.41% |
| 2015 | 2887 | 2390 | 20.79% |
| 2014 | 2390 | 2811 | -14.97% |
| Season | HR | HR – Prev. Season | Percent Change |
|---|---|---|---|
| 2018 | 5585 | 6105 | -8.52% |
| 2017 | 6105 | 5610 | 8.82% |
| 2016 | 5610 | 4909 | 14.27% |
| 2015 | 4909 | 4186 | 17.27% |
| 2014 | 4186 | 4661 | -10.19% |
After a decrease in home runs in 2014, we saw a massive increase, which was a greater change than from 2016 to 2017 when baseball broke the season home run record. But solo shots went up at a greater rate than home runs with runners on – a 20 percent increase from 2014 to 2015. And we saw a larger increase from 2015 to 2016 as well. Although home runs went down overall from 2017 to 2018, the percent decrease in solo home runs was not as sharp as that of home runs in total – roughly 8 percent decrease for solo shots and 8.5 percent for total home runs.
Keep in mind that it is not as if on-base percentage is down compared to what league rates have been historically – in fact, it is up from last year (.318 major league average in 2018 and .334 in 2019). Players get on base at a similar rate compared to 25 years ago. And although the strikeout rate has increased, that is not as much of a problem here. In these situations, a strikeout is almost the same as a fly out or a ground out (assuming that there are no errors, of course).
Thanks to Baseball Reference, we can look at every home run and how many runners (if any) were on. I looked at the percentage of home runs that were solo shots in the live-ball era (since 1920), and solo-shot percentage appears to be a continuing phenomenon. If you are wondering what solo shots were like before 1920, it fluctuated by year. In 1881, 46 of the 76 home runs (60.5 percent) came without runners on, before decreasing to 44.4 percent the following season.
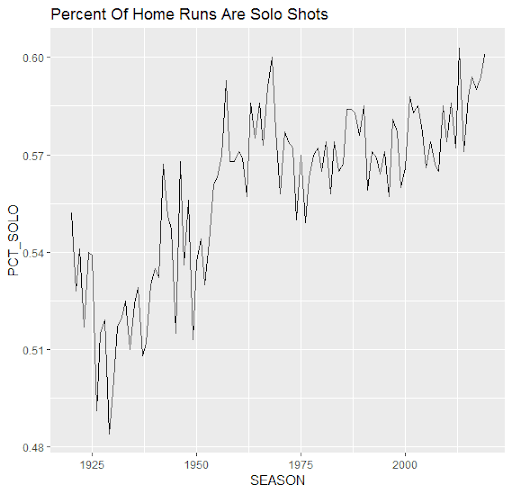
The percentage of solo shots has peaked in today’s era, in the mid-1950s, and the late 1960s. Over 60 percent of home runs have been solo home runs this season:
| Year | Solo | Total | Pct. |
|---|---|---|---|
| 2019 | 765 | 1272 | 60.1 |
| 2013 | 2811 | 4661 | 60.3 |
| 1968 | 1197 | 1995 | 60.0 |
| 2018 | 3316 | 5585 | 59.4 |
| 2016 | 3332 | 5610 | 59.4 |
And if you are wondering where the year of the home run falls: 59 percent of home runs were solo shots in 2017, which is eighth highest since 1920. Among the top five seasons in solo shots, four of them have come in this decade; the other came when hitting was so scarce that baseball lowered the mound the following season.
So how valuable is a solo shot? Mind you that it is still hard to hit a baseball into the stands – roughly three percent of plate appearances end in a home run this season. In addition, it is “only” one run, which could be as attainable as a single, a stolen base, and another single. Should teams attempt to put runners on and drive them in, or should they attempt to have most batters try to hit one out no matter what the situation is?
First, it is important to know that when there are no runners on base, a batter is more likely to see a fastball than if there were runners on:
| Year | No Runners | Runners |
|---|---|---|
| 2019 | 33.9 | 24.4 |
| 2018 | 35.1 | 25.0 |
| 2017 | 35.2 | 25.4 |
| 2016 | 35.4 | 25.8 |
| 2015 | 36.4 | 26.0 |
Yes, fastballs are down in general in the majors, but batters are likely to see a fastball 33.9 percent of the time when there are no runners this season compared to 24.3 percent where there are runners on. If more fastballs are being thrown when there aren’t baserunners on, why not try and attack more often in those situations?
If you are wondering about how Franmil Reyes does against fastballs, it is not bad at all. Last season, he hit .310 and slugged .545 against the fastball compared to .274/.500 against breaking balls and .161/.397 versus offspeed pitches. Although he is hitting .246 on fastballs this season, his expected batting average is .304. Similarly, his slugging is .561, but his expected slugging percentage is .675. Of those 24 career home runs, 15 have come off the fastball.
Is it possible that home runs are easier to hit when there is nobody on base compared to when there are men on base? With more breaking balls thrown with men on, it could be the case, which could result in hitting more solo home runs. We are still left with the same question, however. At the end of the day, what approach is more likely to get runs – is it trying to hit a home run every time, or is it trying to get on base and relying on your teammates to knock you in? Hence, is trying to hit a home run every time valuable? With nobody on base, it depends on how many outs are already in the inning.
I looked at this year’s run expectancy for our scenario for each possible number of outs in an inning. For example, with no men on and no outs, this season’s run expectancy is 0.53 runs. The run expectancy increases when you have more men on base, and decreases when there are more outs in the inning. This is baseball 101, just with numbers to illustrate the predictive outcomes.
With run expectancy, we can calculate the change in run expectancy from the scenario that the batter is in to the new scenario after the batter’s plate appearance. For example, if there is nobody on and one out, the run expectancy is 0.28 runs (notice that the run expectancy decreases by almost half when you get an out). Suppose then the batter hits a single, putting a man on first with one out. The run expectancy for that inning is now 0.53, so the change in run expectancy is 0.53 – 0.28 = 0.25. The formula is as follows:
Change in RE = RE End State – RE Beginning State + Runs Scored
If a batter hits a solo shot, the end state is the same as the beginning state, but now a run has been scored, so you factor that run in. Here is how each change in run expectancy happens based on each scenario and each hit. For simplicity, I looked only at singles and walks instead of adding in errors:
| Hit | 0 Outs | 1 Out | 2 Outs |
|---|---|---|---|
| Single + Walk | .398 | .249 | .132 |
| Double | .600 | .402 | .224 |
| Triple | .829 | .630 | .267 |
| Home Run | 1.000 | 1.000 | 1.000 |
The run expectancy difference when hitting a triple with no outs is similar as hitting a home run, as there is still a high chance of scoring via a ground ball, fly ball, or hit. That, of course, changes significantly when there are two outs, as now a player must get a hit (or reach via an error) in order for the run to score. That is why the change in run expectancy is around the same with a two-out double compared to a two-out triple. Based on this chart, it seems obvious that ANY player should try to hit a home run with none on and two outs.
But it is easier to hit a single or draw a walk than it is to hit a double, triple, or home run, so we have to factor in the probability of each event occurring. I took the probability of each event as the current percentage of each hit over the total number of plate appearances, and multiplied it by the run expectancy difference. The rates are based on when there are no runners on base. Yes, there are other ways to get on base besides these, but let’s limit it to these five:
| Hit | 0 Outs | 1 Out | 2 Outs |
|---|---|---|---|
| Single + Walk | .090 | .056 | .030 |
| Double | .027 | .018 | .010 |
| Triple | .003 | .002 | .001 |
| Home Run | .035 | .035 | .035 |
When there are no outs and nobody on, drawing a walk or hitting a single is still the preferred option. But that changes when there is only one out and when there are two outs. With two outs, the chances of getting a run with a home run are more likely than drawing a two-out walk or hitting a single with two outs. Oh yeah, and it is really hard to hit a triple, by the way.
Since there are more plate appearances when there is nobody on base compared to when there are runners on, and the chances of getting a run with a home run are higher than almost any other scenario, then it is logical for teams to try to hit a home run each time, especially if it is with a hitter that can hit a decent amount of home runs.
Which brings us back to our most exciting player, Franmil Reyes! He is contributing more to the team’s run support a lot more than with runners on, as if he (or the team) knows that the team’s run expectancy is higher when he is batting with nobody on. Based on Statcast data, his expected wOBA is much higher in scenarios with no runners. Among players with at least 100 plate appearances in each split since last season, Reyes has one of the largest differences:
| Player | xwOBA no runners | xwOBA runners on | Difference |
|---|---|---|---|
| Chad Pinder | .394 | .277 | .117 |
| Ji-Man Choi | .413 | .300 | .113 |
| Yandy Diaz | .410 | .310 | .100 |
| Franmil Reyes | .393 | .295 | .098 |
| Daniel Robertson | .361 | .267 | .094 |
| Avisail Garcia | .374 | .288 | .086 |
| Kyle Schwarber | .382 | .304 | .078 |
| Ramon Laureano | .368 | .292 | .076 |
| Rafael Devers | .347 | .271 | .076 |
| Trey Mancini | .367 | .293 | .074 |
Franmil Reyes is just one of many players with the type of pop to hit a home run often, so why not attack with no runners on, especially if pitchers might throw him a fastball more often with nobody on. Based on his 24 home runs and 18 solo shots, and with a team that does not score often, that may be its plan of attack. With power like Reyes’, if you are going to swing, you might as well swing for the fences, even if nobody is on base. Chicks did the long ball, and so do mathematicians.
A few other things to consider:
- Clearly, we are looking at the majors as a whole for these scenarios, and although I used Franmil Reyes as an example, it would be interesting to see what, if any, other hitters are better off trying to hit a home run with nobody on vs. just trying to get on base. Does this affect players who are shifted against most, for instance?
- Players who bat in the leadoff spot are guaranteed to have at least one plate appearance per game with no one on. Some players, like George Springer and Joc Pederson, have had great success hitting leadoff home runs. Does this data suggest that there should be a power hitter batting first? Should Franmil Reyes lead off?
Yes I think Franmil should lead off every game.
An increase in overall HRs will naturally lead to a slightly larger increase in solo HRs, since more bases-empty situations will arise in the middle of high run scoring environment games.
So what we have observed is no different than what should be expected.
I think we want to plot (HR/PA with no men on) – (HR/PA with men on). Or possibly the ratio. Remove the effect of who’s on base changing over time.
I offer Ken Singleton in 1975 as a goal for Franmil Reyes.
In 1975, Singleton, fresh to the Orioles from the Expos, hit 15 home-runs, all solo shots. All were leading-off-an-inning shots; four blasts lead-off the game. He collected 55 RBIs in ’75, batting lead-off in 104 of 155 games. He also led the AL with 714 at-bats; all of his home-runs were from the lead-off slot in the batting-order.
Three of Singleton’s four lead-off-the-first-inning- homers were on the road and all those road round-trippers allowed Mike Cuellar to take the mound in the first with a lead. Another Mike, Mike Torrez, benefited from the lead-off home-run Singleton hit in Baltimore.
Part of this is due to increased HRs generally.
With leaguewide OBP remaining level despite a HR rate surge- the trade off is more frequent empty base game state.
HRs, of course, count as ‘onbase’ despite the resulting game state being empty bases. The homerun increase therefore creates a greater share of solo shots.
Doesn’t your data suggest that it is less optimal for Reyes to hit with no runners on/no outs than in other game-states because of the relative run-expectancies of the different outcomes? With no runners on, single/walk = 0.090 with no outs compared to 0.030 with two outs? Or are you suggesting that Reyes should hit with no runners on/no outs because he’ll see more fastballs?
Those aren’t quite run expectancies, because they’re the percentage chance of the event happening*run expectancy. It’s showing what tends to happen in the MLB currently. It’s still better to hit a homerun than a single(Table 1), but it’s more common to start off with a single.
When Franmil hits with no one on base(Table 3), he increases his wOBA by 100 points. Since leadoff hitters have more at-bats with no-one on, it might be beneficial to have him hit leadoff (likely due to increased fastball usage, as you pointed out).
Chicks dig the long ball.
I dig the Franmil Reyes.
“Should he try this or that” is an attractive hook, but none of this actually gets at the effect of taking two different approaches (which is a hard problem to tackle).
This analysis is “with his existing approach and results, how much value comes from home runs in different situations.”
As a Franmil owner, I thought I was seeing a maddening number of solo shots. Must be a big part of the reason that I’m currently 3rd in HR but 9th in RBI. I didn’t get through the article, but is it possible that his power is so obvious now that they’re not giving him anything to hit when runners are on?
Also a Franmil owner. I think pitchers are just deciding not to give him runners on base when he’s about to hit a home run. Makes sense from the pitcher point of view, but I wish they would think about all of us before they did that.