Groundballs and home run rates
An evaluation system for pitchers that a friend of mine did sparked this thread over at The Book Blog. That’s inspired me to revisit some conclusions that David Gassko came to awhile back and that I arrived at separately in my pursuit of a better pitcher prediction model.
Those conclusions: The higher a pitcher’s groundball rate, the lower his home run per flyball rate. Though the statistical significance is weak, it does fly in the face of some accepted theory that extreme groundballers often have higher home run per flyball rates because, again in theory, what flyballs they do give up will more often be “mistake pitches” that are driven harder.
Gassko’s original work can be found here. Here’s the relevant excerpt:
The main advantage of a ground ball pitcher is supposed to be his ability to prevent balls from leaving the park. The basic idea is simple: A pitcher has little to no control over the rate at which his flyballs leave the park, as was shown in my study with JC Bradbury in The Hardball Times Annual 2006. However, as we also showed, pitchers exhibit very stable groundball rates from year to year. So if the only thing a pitcher can do to prevent home runs is to prevent flyballs, it stands to reason that groundball rate is a key factor in preventing home runs.
However, many have argued that this is not quite correct, because pitchers with high groundball rates generally allow flyballs only when they make a mistake. Since mistake pitches will be hit farther than your average fly, groundball pitchers should allow more home runs per flyball than your average pitcher. Is it true? The numbers say no. The correlation between a pitcher’s groundball rate and the percentage of the balls hit in the air against him (measured as outfield flyballs plus line drives) that land in the seats is -.05, otherwise known as nonexistent.
I arrived at the same conclusion when, while perusing my IPORT data, I plotted the career percentage of pitches resulting in groundballs (GB%) against home runs per flyball. This was not meant to be a perfectly sound statistical measure, but merely to satisfy my curiousity. The results were surprising, nonetheless.
Foraying into The Book Blog thread, I wanted to revise my approach to be more complete. I looked at groundball and home run per flyball rates for all pitcher seasons 1988-2006 sans 1999 (data from Retrosheet), normalized around the league’s numbers for each season and blocked on throwing hand.
That is, each season’s data were separated into left and right-handed pitchers and totals for each were gathered for each side, each season. The individual pitchers’ results were then normalized around the league’s results for that season for all pitchers of the same dexterity. Then, home run per flyball rate was again plotted against groundball rate, resulting in the following graph:
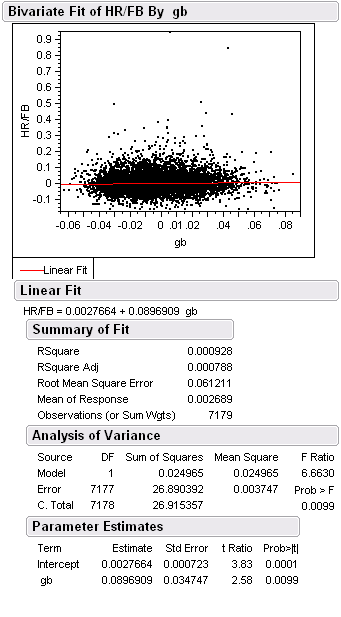
The results here are a little different from what I first saw and from what Gassko stated. Here there was no negative relationship in the linear model. However, it is quite clear that there is no overlying positive trend or spike and that any correlation drawn will be very weak. This would seem to support Gassko’s conclusion. In response, though, Tom Tango asked for a closer look at a particular segment of the data, sayinbg that the theory is pertaining more to the extremes and that measuring the difference in terms of standard deviations away from the league mean would be a more appropriate response.
Can do. So I went back, took the entire careers for pitchers that I have and took the top 20 groundballers, and just for fun, the top 20 flyballers, and separated them from the pack. Then I calculated the average home run per flyball rate for all pitchers 1988-2006 (13.57% as it turns out).
And, using the number of flyballs for each pitcher as the population mean for that pitcher, found the standard deviation for each pitcher as (p*q/n) or (.1357 – (1 – .1357)/No. of flyballs). Then I subtracted the pitcher’s home run per flyball rate from the league’s and finally, dividing that difference by the pitcher’s standard deviation yielded the sd-distance from the league mean for each pitcher, plotted below.
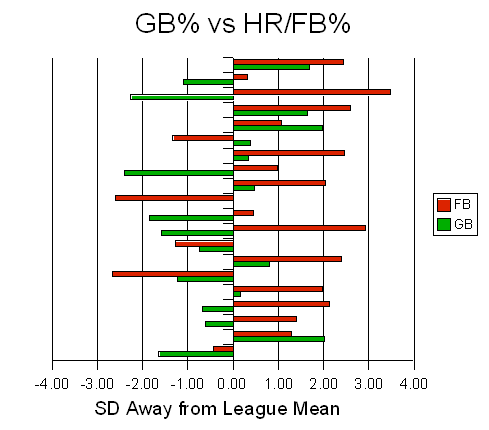
It is not easy to pick out a pattern in that graph—it is ordered at random—so let me offer a summary statistic. Taking each pitcher’s contribution (pitcher’s flyballs/sample flyballs) to the sample (top 20 flyballers or top 20 groundballers) and multiplying it by the sd-distance gives us a weighted magnitude for the group of how many standard deviations away from the mean they are.
The top 20 groundball pitchers had a magnitude of -0.28, while the bottom 20 groundball pitchers had a magnitude of +0.83. This tells us that the more extreme groundball pitchers are indeed seeing lower home run per flyball rates than the overall average, while the worst groundball pitchers are seeing higher home run per flyball rates than the overall average. The full data are presented below.
   Last      First    T   GB    HRFB  League  FB    SD   Diff    #SD
Coppinger  Rocky      R .2316  .2012  .1357  164   .027  .066    2.45
Cabrera    Jose       R .2786  .1422  .1357  267   .021  .006    0.31
Quevedo    Ruben      R .2814  .2007  .1357  339   .019  .065    3.49
Prokopec   Luke       R .2821  .1933  .1357  238   .022  .058    2.59
White      Gabe       L .2843  .1516  .1357  521   .015  .016    1.06
Percival   Troy       R .2874  .1151  .1357  488   .016  -.021  -1.33
Stein      Blake      R .2891  .1811  .1357  348   .018  .045    2.47
Person     Robert     R .2908  .1485  .1357  701   .013  .013    0.99
Wells      Bob        R .2974  .1653  .1357  563   .014  .030    2.05
Fernandez  Sid        L .2979  .1100  .1357  1207  .010  -.026  -2.61
Dotel      Octavio    R .2989  .1434  .1357  426   .017  .008    0.46
Creek      Doug       L .3005  .2002  .1357  240   .022  .065    2.92
Niedenfuer Tom        R .3013  .1027  .1357  175   .026  -.033  -1.27
Rose       Brian      R .3032  .1965  .1357  183   .025  .061    2.40
Reardon    Jeff       R .3047  .0921  .1357  435   .016  -.044  -2.66
Milton     Eric       L .3049  .1531  .1357  1503  .009  .017    1.97
Helling    Rick       R .3108  .1559  .1357  1310  .009  .020    2.13
Almanza    Armando    L .3118  .1711  .1357  187   .025  .035    1.41
Springer   Russ       R .3151  .1536  .1357  599   .014  .018    1.28
Guante     Cecilio    R .3166  .1256  .1357  223   .023  -.010  -0.44

Webb       Brandon    R .7020  .1650  .1357  387   .017  .029    1.68
Wang       Chien-Ming R .6686  .1089  .1357  193   .025  -.027  -1.09
Innis      Jeff       R .6554  .0807  .1357  198   .024  -.055  -2.26
Hernandez  Felix      R .6522  .1811  .1357  155   .028  .045    1.65
Lowe       Derek      R .6426  .1612  .1357  700   .013  .026    1.97
Bradford   Chad       R .6388  .1467  .1357  150   .028  .011    0.39
Swift      Bill       R .6335  .1401  .1357  715   .013  .004    0.34
McDowell   Roger      R .6257  .0905  .1357  333   .019  -.045  -2.41
Swan       Russ       L .6255  .1481  .1357  169   .026  .012    0.47
Westbrook  Jake       R .6216  .1358  .1357  537   .015  .000    0.01
Frohwirth  Todd       R .6090  .0952  .1357  241   .022  -.041  -1.84
Brown      Kevin      R .6064  .1218  .1357  1514  .009  -.014  -1.58
Cook       Aaron      R .6018  .1223  .1357  359   .018  -.013  -0.74
Dopson     John       R .5996  .1487  .1357  457   .016  .013    0.81
Kolb       Danny      R .5983  .1018  .1357  157   .027  -.034  -1.24
Day        Zach       R .5979  .1392  .1357  244   .022  .004    0.16
Young      Matt       L .5974  .1222  .1357  286   .020  -.014  -0.67
Corsi      Jim        R .5923  .1215  .1357  222   .023  -.014  -0.62
Florie     Bryce      R .5908  .1836  .1357  207   .024  .048    2.01
Guetterman Lee        L .5903  .1033  .1357  299   .020  -.032  -1.64
So again, even looking at the most extreme groundball pitchers, it seems that the intuitive logic of mistake pitches impacting the home run per flyball rate does not hold. The most prolific groundball pitchers do not suffer higher home run per flyball rates. In fact, though extremely weakly correlated, it appears to be the opposite.
References & Resources
The information used here was obtained free of charge from and is copyrighted by Retrosheet. Interested parties may contact Retrosheet at http://www.retrosheet.org.

The wardrobe is shaken up through and through, lending itself to the mixing of genres, peculiar layering, expert dissonance and pseudo-paradoxical juxtapositions. A clash of competing allusions.