Infield Defense Changes with Three True Outcomes
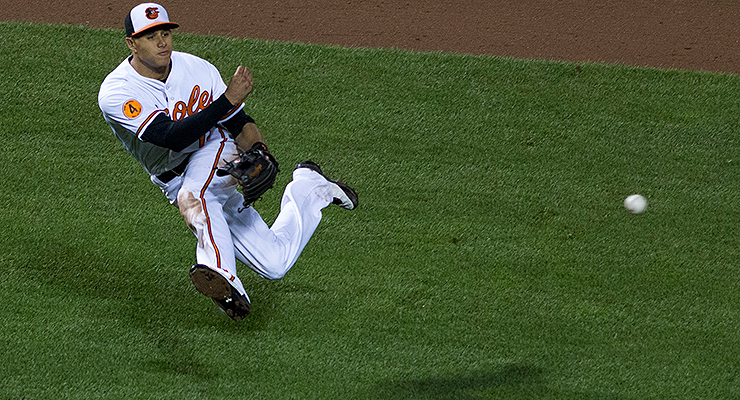
Great defenders like Manny Machado may not be as important as they used to be (via Keith Allison).
The point wasn’t to make Andrelton Simmons’ defensive performance in 2013 seem even more impressive.
It ended up that way, but the idea was actually to show that infield defense has become less important over time. Let’s back up and examine the idea: three true outcomes have increased dramatically throughout baseball history thanks to the proliferation of strikeouts and a steady increase in home runs.
Of course, the inverse would then be true for balls in play—a plate appearance either ends in one of the three true outcomes (walk, strikeout or home run), or it ends with a ball in play. If three true outcomes are on the rise, balls in play must be on the decline.
First, let’s make sure the data bears this out. The graphs below show the home run, walk and strikeout rates throughout baseball history and then the summed three true outcomes and, inversely, the proportion of balls in play.
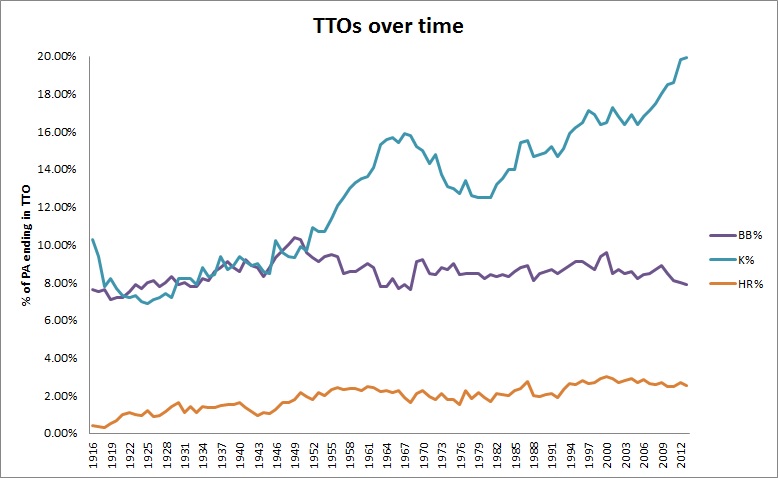

If it’s not entirely clear from the graph, 2013 came just shy of the record for the largest proportion of plate appearances ending in one of the three true outcomes at 30.32 percent, bested only by 2012’s 30.48 percent mark. While walks were down slightly to 7.9 percent (well below their 1949 high of 10.4 percent) and home runs were down to 2.52 percent (from 2000’s high of 2.99 percent), strikeouts reached an all-time high at 19.9 percent.
In all, these changes resulted in the second-smallest rate of balls in play ever, edging below 70 percent for just the second time.
The logic here should be easy to follow—fewer balls in play means fewer chances for fielders, decreasing the relative importance of defense compared to pitching and hitting.
Even if only the “modern” era of statistical tracking is examined, balls in plays are down from 72.3 percent in 2003 to 69.7 percent in 2013, a 3.7 percent decrease. The batted ball mix hasn’t shifted much in that time either, though we did see fewer outfield fly balls the past two seasons.
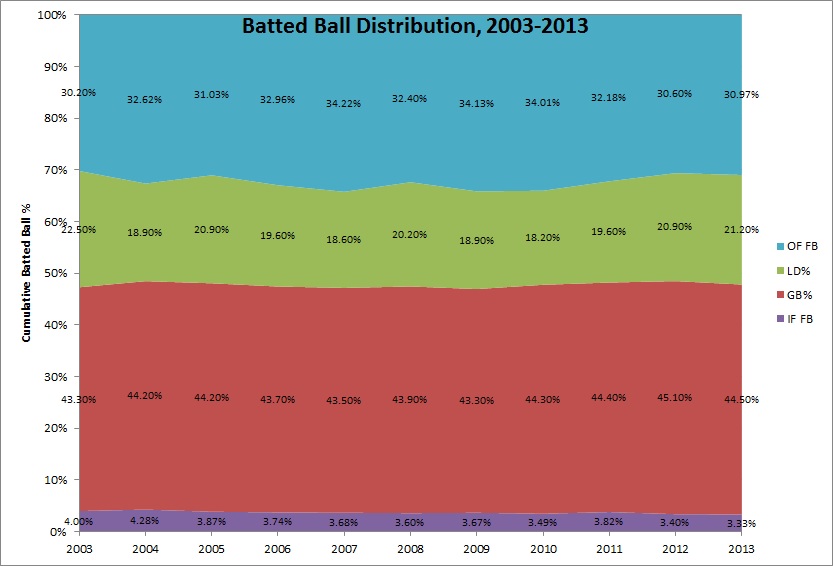
What this shows, essentially, is that since 2003, the drop in balls in play appears to have impacted all fielders equally.
Unfortunately, data before 2003 is unavailable, but the stark drop in balls in play over time should make it clear that defense has become relatively less important—perhaps ground balls and hits on the infield were less prominent and this is just a shift back in the aggregate, but the increased rate of extra-base hits would lead us to believe the contrary, that infield defense was even more important in the last millennium.
In addition to fewer balls in play, though, teams have also moved to shift far more often. As Jeff Zimmerman outlined in The Hardball Times Baseball Annual 2014, shifting is in vogue. It makes sense, after all, since between 57 and 60 percent of pulled balls result in ground balls compared to 40 to 43 percent on balls hit to center and 22 to 27 percent on balls taken the opposite way. With advanced scouting and more data available, teams can better identify hitter tendencies and adjust with less risk. The fact that 24 hitters pulled at least 200 balls in play this year makes it even easier to do for the high-pull hitters (as Zimmerman notes, the top-20 players hitting into a shift accounted for over 2,500 plays in 2013, dropping their collective BABIP by 37 points in those situations).
Here are the number of each different type of infield shift last season, taken from The Annual:
| 2013 MLB Infield Shifts | ||||
|---|---|---|---|---|
| Shift Type | Total Shifts | |||
| Three infielders on one side | 2,620 | |||
| Middle infielder over bag | 3,675 | |||
| Third base to right | 125 | |||
| Other | 110 | |||
| Infield up | 891 | |||
| Total IF shifts | 7,421 | |||
That’s more than 7,000 additional plays that decrease the relative importance of each infield defender. While that statement maybe doesn’t hold for each individual shift, a heavy-shift approach requires less range and decision making from fielders. Because it’s unclear which fielder made a play on each shift, they can’t be subtracted from the whole below, but the increased reliance on shifts furthers the argument that defense has become somewhat less important.
To dig down further, we took a look at infielders using some of the more advanced fielding tracking data we have available. Specifically, we looked at balls in zone by position and total plays made by position to see how the role of each position has changed. The shifts aren’t excluded, but note that “balls in zone with traditional infield” would be 7,421 less and “normal plays” would be significantly lower, too.
| Balls In Zone and Total Plays Made By Infield Postion, 2003-2013 | |||||||||||
|---|---|---|---|---|---|---|---|---|---|---|---|
| First Base | Second Base | Shortstop | Third Base | Infield | |||||||
| Season | BIZ | Plays | BIZ | Plays | BIZ | Plays | BIZ | Plays | BIZ | Plays | Plays/PA |
| 2003 | 6099 | 4484 | 11739 | 10356 | 10434 | 9203 | 10741 | 7413 | 32914 | 31456 | 16.78% |
| 2004 | 5406 | 4070 | 12129 | 9863 | 11995 | 9872 | 9007 | 6215 | 33131 | 30020 | 15.92% |
| 2005 | 5493 | 4343 | 12825 | 10403 | 12821 | 10484 | 9271 | 6813 | 34917 | 32043 | 17.20% |
| 2006 | 6366 | 4799 | 12679 | 10401 | 13218 | 10809 | 10880 | 7686 | 36777 | 33695 | 17.92% |
| 2007 | 6697 | 4965 | 12192 | 10120 | 13019 | 10625 | 10623 | 7221 | 35834 | 32931 | 17.46% |
| 2008 | 6568 | 4860 | 12805 | 10525 | 12753 | 10567 | 10623 | 7403 | 36181 | 33355 | 17.78% |
| 2009 | 6097 | 4766 | 12482 | 10149 | 13075 | 10476 | 9747 | 6943 | 35304 | 32334 | 17.28% |
| 2010 | 6025 | 4602 | 12641 | 10380 | 12959 | 10354 | 10157 | 7220 | 35757 | 32556 | 17.55% |
| 2011 | 6675 | 5299 | 12709 | 10394 | 12286 | 10087 | 10404 | 7366 | 35399 | 33146 | 17.89% |
| 2012 | 6508 | 5166 | 12619 | 10181 | 12274 | 9850 | 10079 | 7238 | 34972 | 32435 | 17.61% |
| 2013 | 6622 | 5312 | 12548 | 10049 | 12256 | 9843 | 9919 | 7197 | 34723 | 32401 | 17.53% |
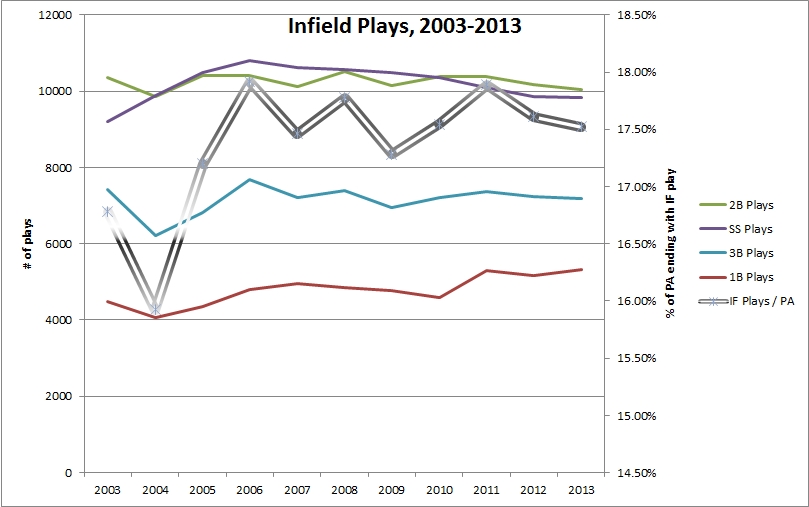
What’s interesting, though, is that while the number of plays infielders have made has varied, it’s been largely consistent over the past decade-plus. The percentage of plate appearances that result in an infielder making a play has actually gone up by three quarters of a percentage point.
Let’s take a closer look position by position.
First Base
| Key Statistics, First Base, 2003-2013 | |||||||||||
|---|---|---|---|---|---|---|---|---|---|---|---|
| Season | Plays | BIZ | RZR | wRC+ | Off | Def | WAR | ||||
| 2003 | 6099 | 4484 | 0.735 | 112 | 338.1 | -488.5 | 76.4 | ||||
| 2004 | 5406 | 4070 | 0.753 | 109 | 250.3 | -454.0 | 67.0 | ||||
| 2005 | 5493 | 4343 | 0.791 | 112 | 338.6 | -463.4 | 75.3 | ||||
| 2006 | 6366 | 4799 | 0.754 | 113 | 345.9 | -424.2 | 76.5 | ||||
| 2007 | 6697 | 4965 | 0.741 | 111 | 248.1 | -430.8 | 65.9 | ||||
| 2008 | 6568 | 4860 | 0.740 | 110 | 222.7 | -465.6 | 66.4 | ||||
| 2009 | 6097 | 4766 | 0.782 | 115 | 388.7 | -435.8 | 81.6 | ||||
| 2010 | 6025 | 4602 | 0.764 | 112 | 280.9 | -420.6 | 70.2 | ||||
| 2011 | 6675 | 5299 | 0.794 | 112 | 268.6 | -456.3 | 70.4 | ||||
| 2012 | 6508 | 5166 | 0.794 | 107 | 118.8 | -517.3 | 51.8 | ||||
| 2013 | 6622 | 5312 | 0.802 | 110 | 195.6 | -507.8 | 53.5 | ||||
First basemen have actually seen their defensive workloads increase over the past decade, largely a result of the fielders simply making more plays on the balls hit their way. Perhaps this is due to teams moving their first basemen around more aggressively to cover greater ground, a greater reliance on pull-hitting pushing more balls to the corners, or simply a move to more athletic fielders. The net result hasn’t actually been better defense in the aggregate. Instead, first base remains a position played with an offensive premium and one that has seen a precipitous drop in overall value the past several seasons.
Second Base
| Key Statistics, Second Base, 2003-2013 | |||||||||||
|---|---|---|---|---|---|---|---|---|---|---|---|
| Season | Plays | BIZ | RZR | wRC+ | Off | Def | WAR | ||||
| 2003 | 11739 | 10356 | 0.882 | 88 | -344.3 | 52.4 | 57.2 | ||||
| 2004 | 12129 | 9863 | 0.813 | 89 | -329.7 | 76.1 | 63.1 | ||||
| 2005 | 12825 | 10403 | 0.811 | 95 | -113.8 | 128.6 | 86.6 | ||||
| 2006 | 12679 | 10401 | 0.820 | 90 | -311.2 | -9.3 | 53.0 | ||||
| 2007 | 12192 | 10120 | 0.830 | 94 | -126.2 | 83.5 | 81.6 | ||||
| 2008 | 12805 | 10525 | 0.822 | 95 | -106.3 | 90.8 | 87.0 | ||||
| 2009 | 12482 | 10149 | 0.813 | 95 | -116.8 | 101.3 | 87.6 | ||||
| 2010 | 12641 | 10380 | 0.821 | 94 | -169.4 | 86.7 | 79.7 | ||||
| 2011 | 12709 | 10394 | 0.818 | 91 | -218.1 | 102.6 | 78.1 | ||||
| 2012 | 12619 | 10181 | 0.807 | 88 | -306.9 | 93.3 | 64.9 | ||||
| 2013 | 12548 | 10049 | 0.801 | 91 | -237.7 | 30.6 | 63.1 | ||||
The second base renaissance appears to be at an end. From 2005 to 2010, the position became nearly a league-average offensive position, essentially becoming a duplicate of third base for a short time. Over the past few years, however, second basemen are making fewer plays on a similar number of balls while the position has reverted to an offensive weak spot. The result, like with first base, is a precipitous drop in the overall value of second basemen on both sides of the equation.
Third Base
| Key Statistics, Third Base, 2003-2013 | |||||||||||
|---|---|---|---|---|---|---|---|---|---|---|---|
| Season | Plays | BIZ | RZR | wRC+ | Off | Def | WAR | ||||
| 2003 | 10741 | 7413 | 0.69 | 90 | -364.7 | 77.8 | 61.2 | ||||
| 2004 | 9007 | 6215 | 0.69 | 99 | -52.5 | 31.4 | 87.3 | ||||
| 2005 | 9271 | 6813 | 0.735 | 98 | -103.2 | 28.4 | 82.4 | ||||
| 2006 | 10880 | 7686 | 0.706 | 102 | 75.5 | 58.9 | 96.5 | ||||
| 2007 | 10623 | 7221 | 0.68 | 99 | -45.8 | 29.9 | 82.9 | ||||
| 2008 | 10623 | 7403 | 0.697 | 100 | -45.8 | 48.5 | 90.4 | ||||
| 2009 | 9747 | 6943 | 0.712 | 98 | -69.5 | 53.2 | 91.6 | ||||
| 2010 | 10157 | 7220 | 0.711 | 97 | -110.6 | 45.1 | 76.7 | ||||
| 2011 | 10404 | 7366 | 0.708 | 92 | -267.9 | -29.2 | 60.8 | ||||
| 2012 | 10079 | 7238 | 0.718 | 100 | -27.5 | 52.6 | 90.6 | ||||
| 2013 | 9919 | 7197 | 0.726 | 97 | -148.3 | 48.3 | 76.1 | ||||
Either the hot corner wreaks havoc on the statistics available or it’s quite a fickle position. The returns have fluctuated wildly at third base over the past decade, with offense at times nearing league average and defense swinging from incredibly valuable to a net-negative. The result, as you might expect, is an up-and-down overall value.
Shortstop
| Key Statistics, Shortstop, 2003-2013 | |||||||||||
|---|---|---|---|---|---|---|---|---|---|---|---|
| Season | Plays | BIZ | RZR | wRC+ | Off | Def | WAR | ||||
| 2003 | 10434 | 9203 | 0.882 | 85 | -386.5 | 214.2 | 61.3 | ||||
| 2004 | 11995 | 9872 | 0.823 | 86 | -335.7 | 233.5 | 66.2 | ||||
| 2005 | 12821 | 10484 | 0.818 | 88 | -284.1 | 216.9 | 75.1 | ||||
| 2006 | 13218 | 10809 | 0.818 | 86 | -375.2 | 224.6 | 63.4 | ||||
| 2007 | 13019 | 10625 | 0.816 | 90 | -247.8 | 224.6 | 76.9 | ||||
| 2008 | 12753 | 10567 | 0.829 | 88 | -321.9 | 240.3 | 72.2 | ||||
| 2009 | 13075 | 10476 | 0.801 | 87 | -357.5 | 220.3 | 69.7 | ||||
| 2010 | 12959 | 10354 | 0.799 | 83 | -418.4 | 253.7 | 64.6 | ||||
| 2011 | 12286 | 10087 | 0.821 | 88 | -297.2 | 213.2 | 73.7 | ||||
| 2012 | 12274 | 9850 | 0.803 | 86 | -322.8 | 252.4 | 72.9 | ||||
| 2013 | 12256 | 9843 | 0.803 | 85 | -324.4 | 209.6 | 64.1 | ||||
As expected, shortstop is the most important defensive position in the infield. We saw earlier how shortstops have been edged by second basemen in terms of overall number of plays but the degree of difficulty is far greater at short. As a result, even with the worst offense of any infield position, shortstop has been the second most valuable position in terms of total wins added. Note, however, that the total defensive impact of shortstops was down in 2013, as it had the lowest mark in the sample.
The lede mentioned that Andrelton Simmons’ 2013 season would now look even more impressive, and it should — not only did he post the fourth-highest defensive runs total since 2003 and the second best at shortstop, he accounted for 31.6 of the position’s total 209.6 defensive runs, more than 15 percent. Manny Machado’s season looks even more incredible at third, too, as his 33.6 defensive runs represent nearly 70 percent of the position’s total. Given that some positions have negative defensive value, there are surely countless examples of players earning infinite portions of a position’s defensive value, but the point is that Simmons and Machado had outstanding defensive seasons at a time when their positions appear to be providing less overall value than in the recent past.
While balls in play are down overall, infielders haven’t noticed an appreciable change in their workload the last decade.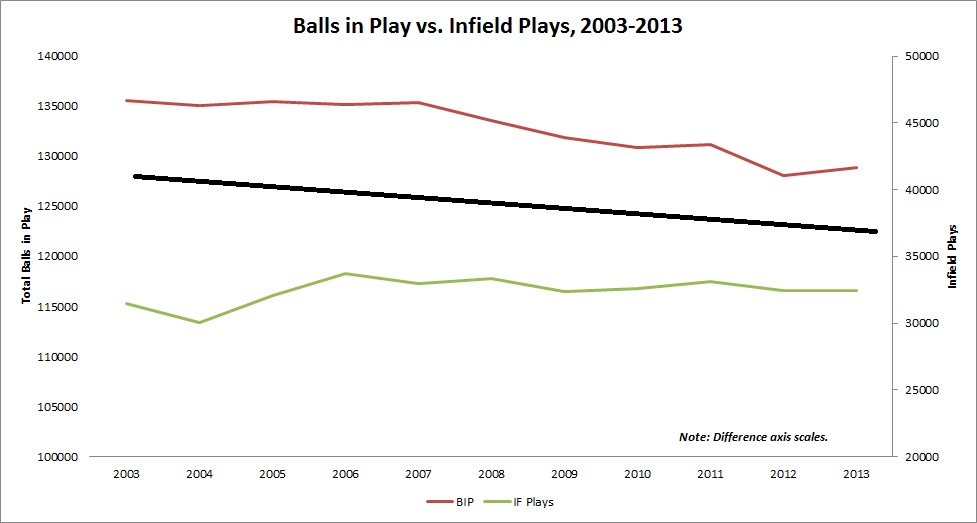
The data doesn’t capture two key points: that prior to 2003, infield defense was likely even more important, and that while the numbers are steady, the increasing use of shifts likely makes some of the plays infielders do make easier. I’ll admit this runs counter to what I was expecting to find when I began researching the impact of three true outcomes on infielder defense. Obviously, then, the amount of plays made by outfielders is decreasing, a topic worthy of study for a future piece.
It’s not just the increasing use of shifts, team are overall smarter with their positioning than ever before.
Aside from walk-off homers and walk-off walks, those two outcomes should not be changing the total number of balls in play at all. Both of those outcomes affect the percentage of balls in play/PA, but that doesn’t change anything about how many plays the defense has to make eventually. 27 outs need to be recorded, only the K’s change how many the defense is involved in at a fundamental level.
I.e., a game that results in nothing but HRs, BB, and GBs – no matter how many HRs and BBs are produced, the GB totals will be roughly the same (give or take a DB here or there).
But with run environment down, there aren’t simply more plate appearances to work with, the contrary actually:
2004-188,539
2007-188,623
2010-185,553
2013-184,872
Between that and IF changes, here’s how OF PLAYS look:
2004-25,924
2007-27,318
2010-24,428
2013-22,047
As you said, the workload of infielders has remained relatively constant despite the decrease overall in batted balls. I imagine that part of this reason is due to GB becoming a greater percentage of the batted ball distribution.
Some teams are focusing on getting lots of ground balls; some are focusing on getting more fly balls. For those teams, infield defense and outfield defense, respectively, are incredibly important for maximizing run prevention from otherwise mediocre pitchers.
I can’t recall if Jeff touched on this in the Annual, but I wonder how fielders perform in general when they are in a shifted (i.e. Non-standard) position? As you say, it seems logical to think this should make it easier for infielders, but I wonder if there is a penalty associated with guys playing “out of position”? At least until shifting becomes common on their team.
Yeah, that’s an interesting question. The required range obviously shrinks a great deal, but you could be moving in a way you’re not used to, first step is different, even the throwing angle.
What, if anything, does this mantra of ‘backspining’ a struck ball have to do with these changes. Logically, that should lead to more flyball outs, and flyballs. Alternatively, has moving to grass from artificial surfaces dictated a trend? Finally, what are the confidence intervals on these trend lines?
Batted ball information is available before 2003.
I know, but the BIZ/Plays data isn’t, so I limited the examination to that range.
So 132K BIP in 2013 If IF’ers made 32 K plays that means OF’ers are pretty busy. But according to B-Ref there were 63K PA to the IF with about 5K going for IF hits and 1.4K errors. I suppose P and C accounted for some plays but seems IF plays should be higher.
What am I missing?
Hmm, either the definition of plays is different between BR/FG. Note that what I’m using here is “plays” not “balls hit at” or “PA,” so there’s a lot of room for additional balls that weren’t hit to a particular fielder.
Sounds like hitting is becoming less and less important also, since it takes fewer runs or less offense to win. Pitching is becoming less important too, since there’s such an abundance of it. The only thing with growing importance these days is the front office saber analysis. Championships are won and seasons are tossed out (Astros) before the regular season even starts.
So, by “defense”, I take it you mean fielding, not defense, right?
That last graph is quite telling. There were about 5,000 fewer balls in play in 2013 vs. 2003, but the infield BIP remained about the same. This would indicate that outfielders recorded 5K fewer plays, or about one play per team per game. That’s a notable reduction in OF plays, de-emphasizing the importance of OF defense.