Jack Cust eats fastballs for lunch
Getting a major league job
Early last year, the Oakland Athletics watched as nearly their entire contingent of major league outfielders went down with one injury after another.
The bad news started in spring training, as center fielder Mark Kotsay underwent back surgery on Mar. 8. He would not return to action until June 1. On April 10, Milton Bradley strained his left hamstring. On April 22, Bradley injured his right wrist. Between the hamstring and wrist injuries, Bradley would spend the majority of April and May on the disabled list, playing in only seven games between April 10 and May 30.
It only got worse on April 23 when the final member of the projected 2007 starting outfield, Nick Swisher, suffered a strained left hamstring. Swisher started the year playing mostly first base with regular first baseman Dan Johnson hurt (a hip injury kept Johnson out until April 25) but began playing center field in mid-April with Kotsay and Bradley out. Between April 23 and May 4, Swisher managed only two at-bats. Reserve outfielder Bobby Kielty joined the ranks of the injured when he strained his left calf on April 25. Kielty was placed on the disabled list on May 1 and would not return to action until July 8.
As the calendar turned to May, a bad situation in Oakland turned ridiculously worse. It was revealed that rookie Travis Buck, who had made the major league roster out of spring training with Kotsay injured, had been dealing with soreness in his right wrist since spring training. Buck missed five of the A’s first nine games in the month of May. Both Buck and and Swisher were pressed back into action in early May despite not being quite 100 percent. To top it all off, on May 2, designated hitter Mike Piazza collided with Mike Lowell in a play at third base and injured the acromioclavicular joint in his right shoulder, putting him on the shelf until July 20. Shannon Stewart was the only one of the regular outfielders to escape the injury bug, at least relatively speaking—he did have some minor problems with an ankle injury in early May but managed to stay in the lineup.
At that point, the A’s were starting a lineup that included Double-A outfield callup Danny Putnam. Searching for help, Oakland GM Billy Beane traded a player to be named later to the Atlanta Braves for outfielder Ryan Langerhans on April 29, then promptly flipped him to the Washington Nationals three days later for outfielder Chris Snelling, who played in six games before … wait for it … going down with a season-ending left knee contusion on May 10.
Beane’s comment regarding the Langerhans trade is telling: “Given our situation with all the injuries, it dictates we need as many healthy bodies as we can get.” In that spirit, the Oakland A’s acquired one Healthy Body, also known as Jack Cust, from the San Diego Padres on May 3 for a player to be named later or cash considerations.
In 1997, Jack Cust was the first-round pick of the expansion Arizona Diamondbacks out of Immaculata High School in Somerville, New Jersey. Cust spent the next 10 years toiling in the minor leagues, getting cups of coffee with the Diamondbacks, the Colorado Rockies, the Baltimore Orioles, and the San Diego Padres. He spent six years at the Triple-A level, gaining a reputation as a Quadruple-A slugger who could dominate inferior minor league pitching but couldn’t field, couldn’t run the bases, and couldn’t make consistent contact.
He even spent 2005 with Oakland’s Triple-A Sacramento club without getting so much as a September callup despite playing for an organization with which he was presumed to have the best chance at a major league opportunity. The Oakland organization valued the two things Cust could do well, walk and hit home runs, and didn’t mind the strikeouts as much as many other clubs. Cust suffered from carpal tunnel syndrome and put up solid but unspectacular numbers at Sacramento. Oakland let him go after 2005, only to grasp Cust’s straw again in May 2007 while looking for a healthy body who could fill the DH slot in Piazza’s absence and possibly play outfield in a pinch.
Three true outcomes
Who knows what Cust was thinking, but it may as well have been, “Carpe diem!” He hit six home runs in his first seven games with the Athletics. He cemented his hold on a major league job with a .256-26-82 line in 124 games, adding an impressive total of 105 walks and 164 strikeouts.
How did Jack Cust manage to hit a home run every 15 at-bats while striking out in 42 percent of his at bats? That’s the third-highest strikeout percentage in baseball history for players with at least 300 at-bats.
Player          Year  SO    AB    Pct
Melvin Nieves   1997  157  359   43.7%
Russell Branyan 2001  132  315   41.9%
Jack Cust       2007  164  395   41.5%
Dave Kingman    1973  122  305   40.0%
Russell Branyan 2002  151  378   39.9%
Bo Jackson      1987  158  396   39.9%
Rob Deer        1987  186  474   39.2%
Rob Deer        1991  175  448   39.1%
Dave Nicholson  1963  175  449   39.0%
Both Cust and the Oakland A’s would likely be quite happy if he had a career like Dave Kingman’s, but the other names are not as encouraging.
Breaking down his performance using Pitch f/x data
What can we learn about Cust’s strengths and weaknesses as a hitter in 2007? By investigating the Pitch f/x data set, which covers 1,689 of the 2,222 pitches Cust saw during the 2007 season, we can learn how he performed against different pitch types and pitches in different parts of the strike zone.
One frequent criticism of so-called Quadruple-A hitters is that they are dead-red fastball hitters who feast on minor-league pitchers who can’t consistently throw their breaking balls for strikes. This theory argues that such hitters will falter in the majors as pitchers with better command of their curveballs won’t offer them nearly as many hittable fastballs. Does this theory apply to Jack Cust?
Let’s look at his performance against different pitch types in 2007. What was the pitch mix he saw from left-handed and right-handed pitchers?
Pitch Type     LHP   Pct    RHP   Pct
Fastball       250   50%    556   47%
Change-up       42    8%    229   19%
Slider         123   25%     89    8%
Curveball       66   13%    156   13%
Cutter          20    4%     97    8%
Splitter              0%     46    4%
Knuckleball           0%     10    1%
Total          501  100%   1183  100%
Left handers threw Cust mostly fastballs, sliders, and curveballs. Right handers threw him mostly fastballs, change-ups, and curveballs.
How did he perform against the different pitch types, both overall and on pitches that he did or did not put into play?

LHP              Run value/pitch    Number of pitches  Net Runs
Pitch Type     All     NIP  InPlay     NIP  InPlay    NIP  InPlay
Fastball       0.017 -0.002  0.163     221    29     -0.5    4.7
Change-up     -0.026 -0.019 -0.304      41     1     -0.8   -0.3
Slider        -0.002 -0.007  0.087     116     7     -0.8    0.6
Curveball     -0.009 -0.005 -0.079      62     4     -0.3   -0.3
Cutter        -0.037  0.006 -0.284      17     3      0.1   -0.9
Total          0.003 -0.005  0.088     457    44     -2.3    3.9

RHP              Run value/pitch    Number of pitches  Net Runs
Pitch Type     All     NIP  InPlay     NIP  InPlay    NIP  InPlay
Fastball       0.030  0.001  0.235     487    69      0.3   16.2
Change-up      0.023  0.002  0.186     203    26      0.4    4.8
Slider        -0.002 -0.010  0.091      82     7     -0.8    0.6
Curveball     -0.017 -0.009 -0.128     145    11     -1.3   -1.4
Cutter         0.004 -0.010  0.096      84    13     -0.9    1.3
Splitter      -0.022 -0.038  0.314      44     2     -1.7    0.6
Knuckleball    0.049 -0.016  0.308       8     2     -0.1    0.6
Total          0.016 -0.004  0.175    1053   130     -4.1   22.7
Cust hit very well against the fastball from both left-handed pitchers and the fastball and change-up from right-handed pitchers. The pitches that gave him the most trouble were the change-up and cut fastball from left-handed pitchers and the curveball and split-finger fastball from right-handed pitchers.
Standing out like a sore thumb is the 16.2 runs above average on balls in play against the fastball from right-handed pitchers. Right handers threw him fewer fastballs than they did to a typical left-handed hitter, 47 percent versus 59 percent to the typical hitter. However, one wonders why they threw him as many as they did when they were so much more successful with off-speed pitches.
Let’s take a more detailed look at Cust’s results for different pitch types.
LHP
Pitch Type  Pitches   Ball   CStrk    Foul   SwStrk  InPlay   Avg    BABIP    SLG    HR
Fastball        250    0.42    0.20    0.15    0.12    0.12   0.414   0.320  0.862  0.138
Change-up        42    0.52    0.05    0.12    0.29    0.02   0.000   0.000  0.000  0.000
Slider          123    0.53    0.20    0.07    0.15    0.06   0.429   0.429  0.571  0.000
Curveball        66    0.62    0.24    0.02    0.06    0.06   0.250   0.250  0.250  0.000
Cutter           20    0.40    0.25    0.15    0.05    0.15   0.000   0.000  0.000  0.000
Total           501    0.48    0.19    0.11    0.13    0.09   0.364   0.364  0.682  0.091

RHP
Pitch Type  Pitches   Ball   CStrk    Foul   SwStrk  InPlay   Avg    BABIP    SLG    HR
Fastball        556    0.46    0.18    0.15    0.08    0.12   0.493   0.426  1.000  0.116
Change-up       229    0.48    0.11    0.11    0.19    0.11   0.500   0.435  0.962  0.115
Slider           89    0.51    0.15    0.16    0.11    0.08   0.286   0.167  0.714  0.143
Curveball       156    0.53    0.26    0.07    0.08    0.07   0.182   0.182  0.182  0.000
Cutter           97    0.44    0.14    0.13    0.14    0.13   0.385   0.333  0.692  0.077
Splitter         46    0.37    0.24    0.22    0.13    0.04   0.500   0.500  1.000  0.000
Knuckleball      10    0.20    0.20    0.30    0.10    0.20   0.500   0.500  1.000  0.000
Total          1183    0.47    0.17    0.13    0.11    0.11   0.445   0.383  0.875  0.102

Lg. Avg.
Pitch Type            Ball   CStrk    Foul   SwStrk  InPlay   Avg    BABIP    SLG    HR
Fastball               0.36    0.19    0.19    0.06    0.19   0.330   0.304  0.521  0.037
Change-up              0.40    0.11    0.14    0.13    0.21   0.319   0.295  0.502  0.035
Slider                 0.36    0.14    0.17    0.13    0.20   0.310   0.286  0.481  0.033
Curveball              0.40    0.19    0.13    0.11    0.21   0.310   0.290  0.471  0.029
The league average information comes from John Walsh. Avg and SLG refer to batting average and slugging percentage on balls in play, including home runs (but not strikeouts). BABIP is batting average on balls in play, not including home runs.
We can see that Jack Cust takes a lot of pitches for balls: 47 percent, compared to league average of 37 percent. Conversely, he puts only 10 percent of the pitches he sees into play, compared to 19 percent for the average major league hitter. These numbers are more illuminating when we examine them in terms of strike zone location charts for each pitch type.
Pitch location charts
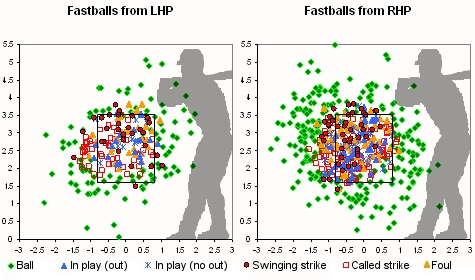
The first thing to notice from the location chart of the fastballs that Cust saw in 2007 is the actual called strike zone that left-handed hitters see, as indicated by the border between called balls and called strikes. Compare this zone to the approximate rulebook strike zone illustrated by the box drawn on the chart. You can see that the zone for Cust drops the inside corners and extends four to six extra inches on the outside edge.
You can also see that many of Cust’s swings and misses are against fastballs up in the zone. We know from the numbers in the table above that when he puts the fastball in play, he hits it hard. His batting average and slugging percentage when making contact with the fastball were .414/.862 (avg/slg) on 39 balls in play against left-handed pitchers and .493/1.000 on 69 balls in play against right-handed pitchers. We’ll take a deeper look into that and the fastball location chart from right-handed pitchers later on.
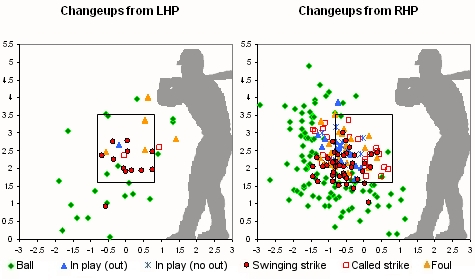
Cust doesn’t see many change-ups from left-handed pitchers (only eight percent of pitches), but it’s the pitch he had the hardest time making contact with, whiffing on two thirds of the change-ups that he swung at from lefties, even though they were thrown across the middle of the plate. It seems like left-handed pitchers ought to use the change-up more often against Cust.
Right-handed pitchers kept the change-up down and away from Cust. They, too, got quite a few swinging strikes, particularly if they could locate it right on the corner. If they missed the corner and got the change-up up and over the outer half of the plate, Cust was able to drive the ball, notching a .500/.962 AVG/SLG line on 26 balls put into play.
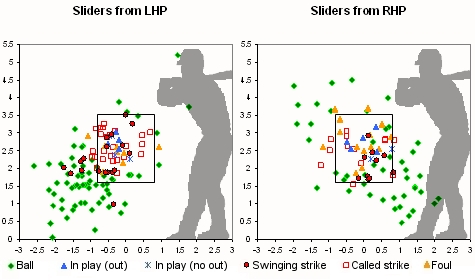
Left-handed pitchers mostly threw the slider down and away to Cust, and even got him to chase a few bad balls. He also took quite a few sliders for called strikes in the zone. When he did make contact, he was fairly effective, getting four singles in seven attempts. Right-handed pitchers tended to throw the slider down and in. Cust fouled off a number of sliders that got up and over the plate, and he managed a home run and a single in seven balls in play. For both right-handed and left-handed pitchers, the slider is a fairly effective, though not dominant, pitch.
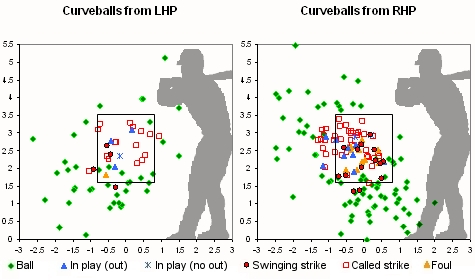
Why pitchers didn’t throw Jack Cust more curveballs, I don’t know. It’s true that a curveball is among the hardest pitches to throw for a strike, and that’s doubly true against a hitter like Cust who doesn’t chase many bad pitches at all, but he seems to have plenty of weaknesses against the curve.
Left-handed pitchers appear to have tried to throw the curveball down and away, missing the strike zone for a ball 62 percent of the time. However, when they got the curve in the zone, Cust almost always took it for a called strike. He watched fully six out of every seven curveballs from lefties spin to the catcher’s mitt with the bat on his shoulder.
Right-handed pitchers threw the curveball both up and away and down and in and had more success throwing it for strikes, 47 percent of the time. Most of the curveballs up and away were taken for called strikes. When the curve was down in the zone, Cust was more willing to offer at the pitch, but when he made contact, he hit a lot of ground balls to the right side of the infield and managed only two singles in 11 balls in play.
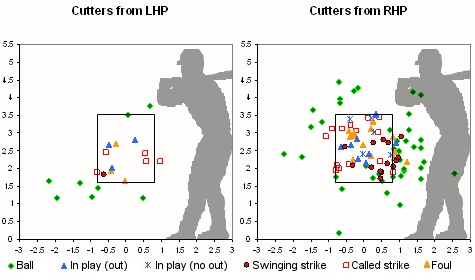
Jack Cust didn’t see many cut fastballs from left-handed pitchers—only 20 in the Pitch f/x data set. Right-handed pitchers worked in from the middle of the plate using the cutter. If they hit the inside edge, they had a good chance of a swing and miss, but out over the plate Cust made better contact, and he accumulated five hits in 13 balls in play, including one home run. Also with this pitch, we can see his tendency to take called strikes on pitches at the top of the strike zone.
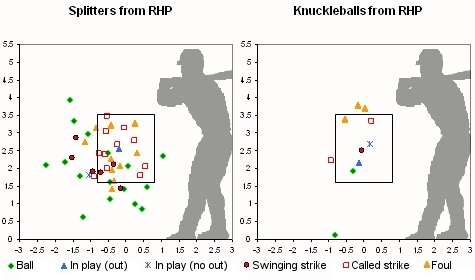
As far as I could tell, Jack Cust faced no split-finger fastballs from left-handed pitchers. He did, however, see a few from right-handed pitchers, who mostly threw the pitch in the outer half of the strike zone. The pitchers achieved good results with the splitter, throwing it for strikes 63 percent of the time and generating a lot of called strikes and foul balls. Only two of 29 splitters in the strike zone were put into play, for a double and a ground out.
Cust saw 10 knuckleballs in three at-bats against Tim Wakefield, ultimately resulting in a double, a ground out, and a line drive to first baseman Kevin Youkilis. There’s not much more to say about Jack Cust and the knuckleball.
Running hot and cold
I already mentioned that Cust started his stint in the bigs last year with a bang. In that vein, he had several hot and cold streaks during the year and is generally perceived as a streaky hitter.
Date     Games   HR    AVG     OBP     SLG   Streak
May 6      13     8   0.310   0.500   0.929    Hot
May 20     21     0   0.153   0.275   0.203   Cold
June 15    18     7   0.377   0.450   0.754    Hot
July 6     19     2   0.151   0.299   0.264   Cold
July 31    28     6   0.326   0.479   0.607    Hot
Sept. 1    28     3   0.193   0.404   0.337   Cold
I’m somewhere between agnostic and doubtful that those hot and cold streaks are indicative of anything much more than random chance, but it’s still worth a look to see if we can find something different about the streaks.
Did pitchers pitch Cust differently during his slumps than they did during his hot streaks? It turns out that Cust saw slightly more regular fastballs and fewer cut fastballs and off-speed pitches during his slumps.
Pitch Type      Hot   Cold
Fastball         45%    51%
Changeup         18%    15%
Slider           12%    13%
Curveball        14%    13%
Cutter            9%     5%
Splitter          2%     3%
Knuckleball       0%     1%
Total Pitches    827    857
Given what we know about how he performed against those pitch types on the season as a whole, that seems counterintuitive. He feasted on fastballs, yet when he was in a slump, he saw more of them. I’m cautious about inferring causality from that correlation.
It is instructive to look at the results of pitches to Cust during his streaks in the same manner we did before when we looked at results for different pitch types.
Streak    Pitches   Ball   CStrk    Foul   SwStrk  InPlay   Avg    BABIP    SLG    HR
Hot         1092    0.46    0.18    0.12    0.12    0.12   0.507   0.416  1.082  0.157
Cold        1123    0.46    0.18    0.15    0.12    0.09   0.320   0.286  0.524  0.049
It doesn’t look like Cust swung at bad balls during his slumps. He did foul off three percent more pitches instead of putting them in play, and when he did put balls in play, his results were much worse. So either he was making poorer contact during his slumps, or he was simply hitting into bad luck.
Streak   InPlay   Fly   Ground   Line    Pop
Hot       134     35%     41%     22%     1%
Cold      103     21%     50%     23%     6%
When Jack Cust hit more fly balls, he was hot, and when he hit the ball on the ground or popped it up on the infield, he was cold. That’s no surprise.

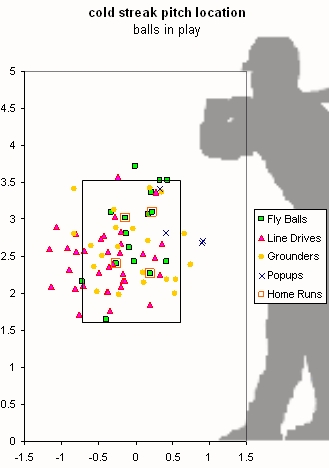
There’s not much difference in the location of the pitches Cust put into play during his hot streaks versus his slumps. He may have been swinging differently, but if so, it’s hard to tell why based on this data.
Picking on weak pitchers?
Earlier I looked at one of the “Quadruple-A hitter” criticisms and found that indeed Cust had trouble hitting the curveball, although that didn’t stop him from hitting major league pitching on the whole. Now let’s look at a similar question. Did Cust compile his gaudy stats against weaker pitchers and struggle against stronger pitchers to a greater extent than the typical hitter does?
I separated the pitchers that Cust faced in 2007 into thirds, using their projected 2008 ERA as the measure of quality.
             Cust               league
Third      runs/pitch projERA  runs/pitch difference
Best        0.010       3.85    -0.004      0.014
Middle      0.008       4.49     0.001      0.007
Worst       0.018       5.01     0.004      0.014
Cust did hit better against the worst pitchers, but only slightly more than the league as a whole did. Interestingly, he outperformed the league just as well against the best pitchers as he did against the worst pitchers. He does not seem to suffer from the Quadruple-A stigma in this regard, at least not in 2007.
Since Cust hit the fastball so well, let’s see if a pitcher’s fastball speed had any bearing on how well Cust hit it.
Third    runs/pitch  Speed   HR   Pitchers allowed HR
Fast       0.025      95.2    3   A.Burnett, F.Carmona, M.Cain
Medium     0.027      92.2    1   F.Cabrera
Slow       0.037      88.7    4   J.Garland, M.Belisle, V.Vazquez, S.Trachsel
He did hit better against the pitchers with slower fastballs, but he hit all speeds of fastballs very well; he didn’t just pick on the offerings from the fastball weaklings.
Balls in play
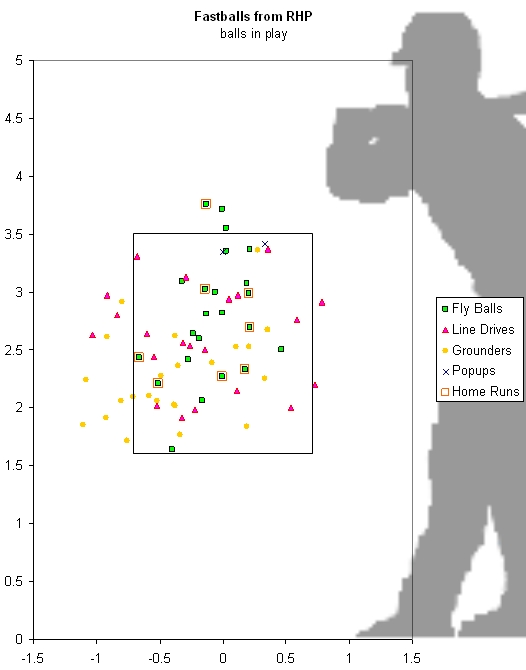
We saw earlier that Cust did most of his damage in 2007 on balls he put into play off fastballs thrown by right-handed pitchers. Let’s take a look at where he hit those pitches in the field of play, as well as the balls in play for a few other pitch types for comparison. Field dimensions on these charts are approximate.
First, here are all the balls he put into play during 2007, coded by type of batted ball and separated by the handedness of the opposing pitcher.
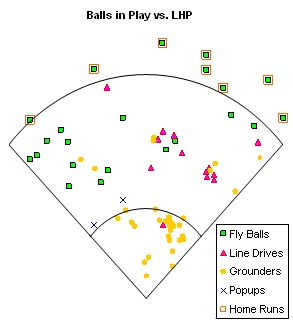
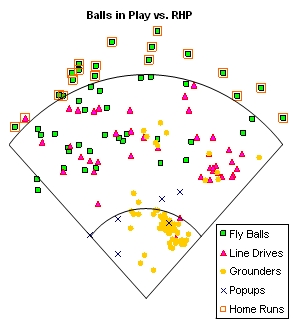
Jack Cust hit a lot of ground balls to the right side of the infield and lot of deep fly balls to all fields. A strong infield shift against Cust seems appropriate, particularly with a right-handed pitcher on the mound. Now let’s take a look at some of the specific pitch types.
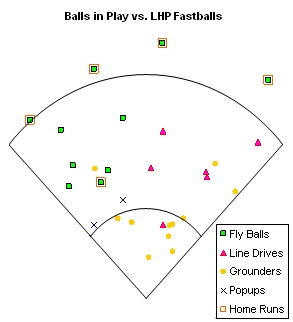
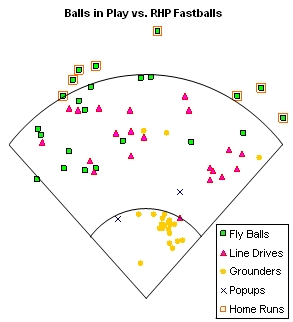
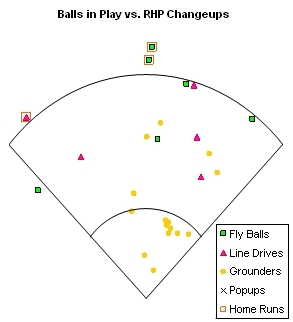

Cust hit a lot of deep fly balls and quite a few line drives to the outfield off the fastball. Against right-handed pitchers, he also grounded a lot of fastballs to the right side of the infield. Change-ups from right handers produced quite a few ground balls and a few deep fly balls and line drives which carried beyond the fence. The sample size for balls in play off of curveballs is small, but Cust doesn’t seem to have been able to do much with them.
Why was Jack Cust able to hit so many deep fly balls off of fastballs from right handers? Did he hit the fly balls off pitches up in the zone? Let’s look at the strike zone location of fastballs that he put in play off right-handed pitchers.
The only thing that stands out is that the ground balls primarily came from pitches below the waist, and low and away looks like a good location to throw a fastball to get a ground ball from Cust. The fly balls, line drives, and home runs seem fairly evenly distributed, however.
Let’s take a look at all the fastballs that were thrown for strikes to Cust by right handers.
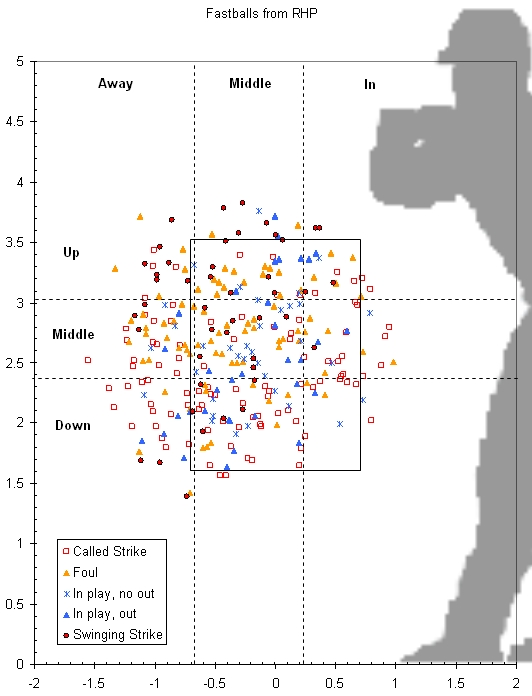
Throwing the fastball up is the best way to get Cust to swing and miss it, while throwing the fastball down is the best way to get a called strike.
Location    Pitches CStrk    Foul   SwStrk  InPlay   Avg    BABIP    SLG    HR
Up             75    0.17    0.35    0.31    0.11   0.385   0.333  0.692  0.077
Mid-Height    121    0.30    0.35    0.11    0.09   0.633   0.577  1.333  0.133
Low           102    0.51    0.15    0.09    0.16   0.385   0.304  0.769  0.115

Location    Pitches CStrk    Foul   SwStrk  InPlay   Avg    BABIP    SLG    HR
Outside        83    0.41    0.29    0.17    0.08   0.364   0.364  0.364  0.000
Mid-Plate     162    0.26    0.28    0.16    0.14   0.542   0.450  1.271  0.167
Inside         53    0.47    0.25    0.09    0.11   0.400   0.400  0.400  0.000
Finally, let’s see how Cust does on all fastballs from right handers based on the location of the pitch, using runs/pitch as our measuring stick.
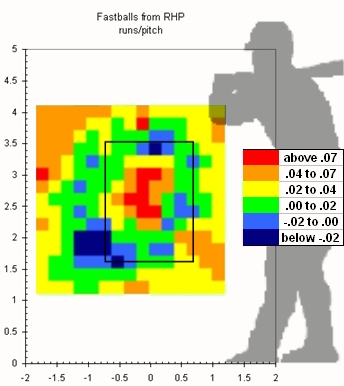
This is my first stab at a heat zone map for a batter, so the presentation is a bit clunky and I’m not completely satisfied with the method behind it, but hopefully it makes the point. If you’re a right-handed pitcher, and you really must throw a fastball to Jack Cust, keep it low and away where you have some margin for error and good prospects for a strike. You might do okay if you work the other edges of the zone with pinpoint control, but if you miss there, he will often make you pay either by taking the pitch for a ball or hitting it well. Avoid the center of the strike zone at almost all costs. Throwing the fastball there is worse than throwing it for a ball, on average.
The Oakland A’s have to be happy with their May 2007 acquisition of Jack Cust from the minor league scrap heap. He proved himself a capable major league hitter, to the surprise of some, but he’s not without his weaknesses, both as a hitter and in other parts of his game. It will be interesting to see the adjustments that both the pitchers and Cust make in 2008.
References & Resources
Pitch f/x is a system developed by Sportvision and introduced in Major League Baseball during the 2006 playoffs and throughout most ballparks in the majors as the 2007 season progressed. It uses two cameras to record the position of the pitched baseball during its flight from the pitcher’s hand to home plate, and various parameters are measured and calculated to describe the trajectory and speed of each pitch. My primer for understanding Pitch f/x can be found here.
The run values per pitch used in this article were calculated using Base Runs (linear weights). An average run value was determined for each ball-strike count based on the results of all plate appearances going through that count in the 2007 American League. Each pitch in the data set was assigned a run value based on the result of the pitch compared to the average run value for that ball-strike count. No adjustments were made for differing run environments based on the particular hitter, pitcher, or park involved. My method is similar to those outlined by John Walsh and Joe Sheehan.