Smoothing the ‘80s and ‘90s (Part 4)
In our previous installments, we’ve explored the manner in which the stat lines of prominent players were affected by the changes in the offensive environment. Now it’s time for the best of the best.
Bear in mind that the stat lines that appear in black font are actuals, and the lines that appear in blue are adjusted. For our methodology, see the References and Resources section below.
The Trinity
Among the more intriguing careers, in a couple of ways. First, of course, is the “what might have been” aspect: what if he hadn’t been so brittle? And second is the larger point of just what a remarkable, singular talent Nomahh was at his best: there have been very, very few shortstops in history with a closely comparable offensive profile of free-swinging, high-contact, extreme-high-average, extra-base power … there’s Robin Yount, and, you know, Honus Wagner. That’s pretty much it. A very special player, at least for a few years.
Year   Age   AB    R    H   2B   3B   HR  RBI   BB   SO   BA  OBP  SLG   OPS
 1996   22   86   10   20    2    3    4   15    4   13 .236 .267 .457  .724
 1997   23  678  113  203   41   12   27   90   32   85 .299 .331 .515  .846
 1998   24  598  102  189   35    8   32  113   30   58 .316 .349 .562  .911
 1999   25  526   95  184   40    4   24   96   47   36 .350 .403 .581  .985
 2000   26  523   96  191   48    3   19   89   56   46 .365 .427 .579 1.006
 2001   27   83   13   24    3    0    4    8    7    9 .289 .344 .470  .814
 2002   28  635  101  197   56    5   24  120   41   63 .310 .352 .528  .880
 2003   29  658  120  198   37   13   28  105   39   61 .301 .340 .524  .864
 2004   30  321   52   99   21    3    9   41   24   30 .308 .357 .477  .833
 2005   31  230   28   65   12    0    9   30   12   24 .283 .318 .452  .770
 2006   32  469   82  142   31    2   20   93   42   30 .303 .360 .505  .865
Career     4808  812 1513  326   54  200  799  334  456 .315 .359 .530  .889
Yeah, he isn’t the immortal the Big Apple media and fawning Yankeedom apparently believe him to be. And he almost certainly doesn’t deserve those Gold Gloves, and the Yankees should have moved him to third base (or second base, or center field) to accomodate A-Rod.
All true. But year in, year out, Jeter continues to demonstrate that he is one tremendous player, and will deserve his waltz into the Hall of Fame five years after his final game, like clockwork.
Year   Age   AB    R    H   2B   3B   HR  RBI   BB   SO   BA  OBP  SLG  OPS
 1995   21   48    5   12    4    1    0    6    3   10 .244 .286 .368 .654
 1996   22  577   96  178   24    6    9   72   44   95 .308 .357 .418 .775
 1997   23  648  107  184   29    7    9   65   68  116 .284 .352 .394 .747
 1998   24  620  117  197   24    8   17   78   52  110 .318 .371 .466 .837
 1999   25  621  124  213   35    9   22   94   84  108 .343 .421 .534 .955
 2000   26  587  110  195   29    4   14   67   63   92 .332 .397 .466 .863
 2001   27  614  110  191   35    3   21   74   56   99 .311 .369 .480 .849
 2002   28  644  124  191   26    0   18   75   73  114 .297 .368 .421 .789
 2003   29  482   87  156   25    3   10   52   43   88 .324 .379 .450 .829
 2004   30  643  111  188   44    1   23   78   46   99 .292 .340 .471 .811
 2005   31  654  122  202   25    5   19   70   77  117 .309 .382 .450 .831
 2006   32  623  118  214   39    3   14   97   69  102 .343 .409 .483 .892
Career     6760 1230 2120  338   52  176  828  677 1150 .314 .376 .457 .833
Top Ten List of Really, Really Idiotic Things:
10. The Umpires’ Union’s mass-resignation plan
9. The design of Candlestick Park
8. The typical guest on Dr. Phil
7. France’s plan to defeat the Nazis
6. New Coke
5. Trading Joe Nathan, Francisco Liriano, and Boof Bonser for A.J. Pierzynski
4. Believing the guy when he says that your friendship is what matters most to him
3. The Bush-Cheney-Rumsfeld Iraq strategy
2. Giving your bank account number to the representative of the Finance Minister of Nigeria
1. Booing A-Rod
Year   Age   AB    R    H   2B   3B   HR  RBI   BB   SO   BA  OBP  SLG   OPS
 1994   18   54    4   11    0    0    0    2    3   19 .199 .238 .199  .437
 1995   19  141   14   32    6    2    5   18    6   39 .227 .256 .394  .650
 1996   20  595  130  209   51    1   33  113   54   97 .351 .405 .605 1.010
 1997   21  582   92  171   38    3   21   78   38   92 .294 .337 .477  .813
 1998   22  680  113  207   33    5   38  114   41  112 .304 .344 .536  .880
 1999   23  498  101  139   24    0   38  102   51  101 .279 .346 .556  .902
 2000   24  549  124  170   32    2   37  122   92  112 .310 .409 .579  .987
 2001   25  632  133  201   34    1   52  135   75  131 .318 .390 .622 1.012
 2002   26  624  125  187   27    2   57  142   87  122 .300 .385 .623 1.009
 2003   27  607  124  181   30    6   47  118   87  126 .298 .386 .600  .986
 2004   28  601  112  172   24    2   36  106   80  131 .286 .370 .512  .883
 2005   29  605  124  194   29    1   48  130   91  139 .321 .409 .610 1.019
 2006   30  572  113  166   26    1   35  121   90  139 .290 .387 .523  .909
Career     6739 1310 2039  353   27  446 1301  795 1360 .303 .376 .562  .938
Junior
He’s persevered through the long run of significant injuries to forge a career that falls short of all-time great, but just short. Griffey is certainly better, but in watching his story unfold it’s always struck me that we’re witnessing pretty much the second coming of Duke Snider: a glamorous star yet never seeming quite comfortable in the spotlight, big yet silkily graceful, handling center field with sparkling panache, delivering bombs with the gorgeous lefty swing, but doomed to an early decline by unshakeable leg trouble.
Year   Age   AB    R    H   2B   3B   HR  RBI   BB   SO   BA  OBP  SLG   OPS
 1989   19  459   66  124   25    0   20   66   44   88 .271 .335 .459  .794
 1990   20  603   99  185   31    7   28   87   64   86 .307 .373 .522  .895
 1991   21  554   83  185   46    1   28  109   72   87 .334 .411 .573  .984
 1992   22  571   90  180   43    4   35  112   44   71 .315 .365 .586  .951
 1993   23  580  112  178   39    3   49  108   94   94 .307 .404 .640 1.044
 1994   24  429   87  136   23    4   36   83   51   68 .317 .390 .643 1.033
 1995   25  258   48   65    7    0   15   39   48   49 .252 .369 .457  .826
 1996   26  540  115  160   25    2   44  129   72   97 .297 .379 .596  .975
 1997   27  603  115  180   32    3   51  136   70  112 .298 .371 .614  .985
 1998   28  628  111  175   31    3   51  135   70  112 .278 .351 .581  .931
 1999   29  601  113  168   25    3   44  124   84  100 .279 .368 .548  .915
 2000   30  516   92  137   21    3   36  109   86  109 .265 .371 .529  .899
 2001   31  364   57  104   20    2   22   65   44   72 .286 .363 .533  .896
 2002   32  197   17   52    8    0    8   23   28   39 .264 .356 .426  .782
 2003   33  166   34   41   12    1   13   26   27   44 .247 .352 .566  .919
 2004   34  300   49   76   18    0   20   60   44   67 .253 .349 .513  .862
 2005   35  491   85  148   30    0   35   92   54   93 .301 .371 .576  .947
 2006   36  428   62  108   19    0   27   72   39   78 .252 .315 .486  .801
Career     8289 1436 2403  453   37  563 1574 1035 1464 .290 .369 .557  .926
*98
Slammin’ Sammy’s overnight transformation at age 29 from a good slugger into a great one was quite unusual, no doubt, but it wasn’t entirely unprecedented. Through the years, a handful of other big-power hitters rather suddenly ratcheted themselves into the elite tier in mid-to-late-career: Roy Sievers comes to mind, as well as Frank Howard, and a pair of Baker Bowl-influenced old-timers, Gavvy Cravath and Cy Williams. And especially when considering the rather extended early-career struggles, Sosa’s career arc bears quite a bit of similarity to that of George Foster.

So reasonably comparable things had happened before, and steroid suspicion notwithstanding, it seems clear that particularly in Sosa’s case the element that generated his breakthrough wasn’t increased strength nearly so much as it was improved discipline: he somehow learned to generally lay off the breaking ball in the dirt. The late acquisition of that skill changed everything for Sosa, and to their dismay, the pitchers facing him. All of a sudden a reliable method of retiring Sosa no longer delivered the goods, and a highly dangerous hitter with a clearly exploitable weakness was now a highly dangerous hitter, period. One suspects that similar old-dog-new-trick stories are behind the improvements of guys like Sievers and Howard as well.
Certainly, by the late 1990s Sosa was massively strong, whether steroid-enhanced or not, and his great strength in concert with his improving strike zone judgment rendered Slammin’ Sammy a pitcher’s nightmare. “Improving” is the operative term, as after his breakthrough season of 1998 Sosa continued to improve, not peaking until 2001 at age 32. His subsequent decline was rapid, and it adds up to a career of dizzying extremes, in shape and in skill profile. Toss in the PED suspicion, and the corked-bat embarrassment for good measure, and we have a conglomeration that promises for a highly entertaining Hall of Fame debate.
Year   Age   AB    R    H   2B   3B   HR  RBI   BB   SO   BA  OBP  SLG   OPS
 1989   20  185   29   49    9    0    5   14   11   50 .264 .305 .394  .700
 1990   21  536   78  128   28   10   19   76   33  158 .239 .284 .438  .722
 1991   22  318   42   66   11    1   13   36   14  104 .208 .242 .370  .612
 1992   23  264   45   70    8    2   10   27   19   67 .266 .316 .427  .743
 1993   24  597   91  155   26    5   36   92   37  139 .259 .303 .501  .804
 1994   25  422   54  124   16    6   23   65   23   85 .294 .331 .523  .854
 1995   26  560   82  147   16    3   33  110   53  124 .262 .326 .477  .803
 1996   27  494   78  132   20    2   36   92   31  124 .267 .311 .536  .847
 1997   28  637   83  156   29    4   33  110   41  162 .245 .291 .458  .749
 1998   29  637  124  192   19    0   60  146   67  159 .302 .368 .613  .981
 1999   30  620  105  175   23    2   57  130   72  159 .282 .356 .602  .958
 2000   31  598   98  187   36    1   45  127   84  156 .313 .397 .604 1.001
 2001   32  577  146  189   34    5   64  160  116  153 .328 .440 .737 1.177
 2002   33  556  122  160   19    2   49  108  103  144 .288 .399 .594  .993
 2003   34  517   99  144   22    0   40  103   62  143 .279 .356 .553  .909
 2004   35  478   69  121   21    0   35   80   56  133 .253 .331 .517  .848
 2005   36  380   39   84   15    1   14   45   39   84 .221 .294 .376  .670
Career     8377 1385 2280  351   45  572 1521  863 2143 .272 .340 .530  .870
Like Sosa, McGwire peaked late, but Big Mac’s late-career improvement wasn’t nearly as pronounced. Indeed, this exercise clearly illustrates that the impression of McGwire’s performance as having dipped into a trough following his great rookie year was, outside of his genuinely poor season of 1991, something of an illusion of the ’88-to-’92 scoring drought, and his revival beginning in 1995 was significantly amplified by the late-’90s offensive boom. McGwire was a better hitter in this thirties than he had been in his twenties, but not to such a strong degree as a superficial look at his stats might suggest.
Indeed what distinguishes the McGwire of his late-’90s heyday from his earlier career isn’t so much improved power as it is improved health (especially in comparison with the injury-decimated 1993-95) and improved plate discipline. Little mention ever seems to be made of it, but Big Mac drew significantly more walks (even controlling for intentional walks) in the second half of his career. Many hitters demonstrate improved strike zone judgment as they age, but McGwire’s improvement was especially large, and unquestionably explains a lot of his improved home run heroics: while Sosa transformed his plate discipline from terrible to decent, McGwire transformed his from good to great, and the better ability of both hitters to force pitchers to throw them strikes gave them better opportunities to go yard.
McGwire was a devastating offensive force in the late 1990s, but we see here that relative to the league around him, Cecil Fielder in 1990 had a slightly better year in terms of total home run output than McGwire in 1998. And this exercise indicates that Big Mac lost more home runs to the difficult conditions of 1988-1992 than he gained from the forgiving conditions of 1994-2000. As the McGwire Hall of Fame debate swirls around us, it’s interesting to contemplate if the scenario we see here had actually unfolded—Big Mac falls just short of tying Fielder’s single-season home run record, but hangs on to reach the 600-career-homer mark at the end—whether the degree of steroid controversy that’s focused upon Big Mac would have played out as it has, and whether his Hall of Fame election would be any more or less likely.
Year   Age   AB    R    H   2B   3B   HR  RBI   BB   SO   BA  OBP  SLG   OPS
 1986   22   53   10   10    1    0    3    9    4   18 .189 .246 .377  .623
 1987   23  557   97  161   28    4   49  118   71  131 .289 .369 .618  .987
 1988   24  555   95  148   24    1   41  108   77  124 .267 .356 .535  .891
 1989   25  494   81  117   19    0   42  103   84   99 .237 .348 .531  .879
 1990   26  527   95  127   18    0   50  118  111  123 .241 .374 .559  .932
 1991   27  486   67  100   24    0   28   82   94  123 .206 .335 .430  .765
 1992   28  471   95  129   24    0   54  113   91  111 .275 .392 .668 1.060
 1993   29   84   16   28    6    0   10   24   21   20 .331 .463 .758 1.222
 1994   30  134   24   33    3    0    8   23   34   37 .246 .399 .450  .849
 1995   31  314   69   84   12    0   35   83   81   71 .269 .418 .645 1.063
 1996   32  419   96  128   20    0   47  104  107  104 .306 .447 .690 1.137
 1997   33  536   79  144   25    0   53  113   93  148 .268 .376 .610  .986
 1998   34  505  120  148   20    0   63  136  149  144 .292 .454 .709 1.163
 1999   35  517  109  141   20    1   59  136  122  131 .272 .412 .657 1.068
 2000   36  234   55   70    8    0   29   67   70   72 .299 .460 .703 1.163
 2001   37  299   48   56    4    0   29   64   56  118 .187 .315 .492  .807
Career     6185 1156 1624  255    6  601 1401 1264 1573 .263 .388 .597  .985
The Unbeatable Four-Ace Hand
In one of the Abstracts of yore, Bill James outlined the terms of a debate that he titled “Pesky-Stuart.” The genesis of it was good-natured (or perhaps not so good-natured, I don’t know) arguments that were said to have been a frequent occurrence in the clubhouse of the Boston Red Sox of 1963-64, pitting their talkative manager, Johnny Pesky, against their even more talktative first baseman, Dick Stuart. Pesky had been a fine player in his day, and Stuart was a good one too, but their offensive profiles could hardly have been more different: Pesky was a high-average OBP specialist, devoid of power, while Stuart was a free swinger, not good at getting on base, but delivering outstanding power. The gist of the debate was Pesky’s insistence that it was getting on base, avoiding outs, that ensured offensive success, with Stuart retorting that it takes a mighty damn long sequence of scratch singles and walks to yield as many runs as just a few mighty extra-base clouts.
Of course, Pesky and Stuart were both right and both wrong, as James would point out; the best offenses feature neither strictly Peskys nor Stuarts, but instead a few of each, properly deployed in sequence: the surest way to score runs has always been to get some guys on and then drive them home. (And the very best hitters are neither Peskys nor Stuarts, but are instead those rare animals who excel both at getting on base and in driving others home.) The symbiotic relationship between OBP and SLG is essentially what James used to develop his foundational Runs Created statistic, and that interplay is at the heart of all sophisticated analysis and understanding of how teams score runs. Thus the Pesky-Stewart debate, while fun, is fundamentally irresolvable; at its essence it’s equivalent to debating whether a plant requires sunlight or water in order to grow.
In recent years I’ve sometimes encountered a different but somewhat related debate, which we might call “Pedro-Koufax.” The dynamic of this one goes something like this: Fan A, expressing awe at the staggeringly great rate stats (ERA, or ERA+, or WHIP or whatever) achieved by Pedro Martinez in his best years, asserts that Pedro might well have been the greatest pitcher of all time. Wait a minute, interjects Fan B; you can’t just look at rate stats, you have to also factor in workload, and when you do, you realize that, say, a Sandy Koufax, putting up amazingly good rate stats of his own, but in an innings-pitched workload about 50% greater than Pedro’s, was greater than Pedro.
Oh no, counters Fan A, not if you take league-and-park context into account. All well and good, responds Fan B, but a game still consumes nine innings and a season still consumes 162 games, and those innings and games left unpitched by Pedro have to be handled, once you complete the cascade, by the worst pitcher on the staff.
And so it goes. A relief pitcher variant of it is “Rivera–Gossage.” The point here isn’t whether the particular guy with better rate stats in fewer innings is better than his counterpart with not-as-great rate stats but more innings, but that the question is always relevant, even critical, to ask. Workload matters for pitchers, a lot. Unlike batters, who (assuming they’re regulars) are all going to accumulate their 600-or-so plate appearances over the course of a full season, the deployment of pitchers is far more varied and discretionary. And while it’s an unqualified good to get your best hitters up to the plate as frequently as possible, the far more physically demanding nature of the pitching task presents a very real risk-reward tradeoff for teams, between having their best pitchers on the mound as often as possible, against the exhaustion and injury risk of a heavy pitching workload.
Thus while it may well be possible to make a conclusive case of a particular pitcher having delivered more value than another, despite widely differing workloads, at its heart this debate is every bit as irresolvable as Pesky-Stuart. A pitcher’s effectiveness is crucial in assessing his value, of course, but so is his workload he delivers; the two issues are utterly inseparable. The trickiness of weighting one against the other, especially when comparing pitchers across eras, is something that makes the fan’s (or analyst’s, or Hall of Fame voter’s) assessment of the value of specific pitchers more challenging than that of specific batters, but it simply must be done. And for actual teams handling actual pitchers, the eternal dilemma of how-much-work-is-too-much is something that makes the management of pitching staffs an eternal headache.
Pedro serves as the ideal catalyst for the debate because he’s such an extreme case: no starter in the Hall of Fame has enjoyed nearly as restful a workload, but on the other hand, this guy has produced the all-time best career ERA+, by a mile. It may very well be the case that Pedro has been the most effective pitcher to ever fling a baseball, but the question of exactly where he stands up against others in terms of single-season and career value delivered is far more difficult to resolve.
In any case, his ERA+ of 285 achieved in 2000 has been surpassed in major league history only by Tim Keefe in, get this, 1880 (and Keefe did that in a season just about exactly half as long as a modern season, and worked just 105 innings). Pedro’s adjusted 2000 ERA of 1.62 that we see here would be the best ERA by any qualifier in the American League since Luis Tiant’s 1.60 in the extreme low-scoring year of 1968, and before that you’d have to go all the way back to Walter Johnson in 1919. And as we saw here, Pedro’s walk/strikeout ratio in league context rivals that of the very best ever, too.
But as we know, he’s long been rather fragile, and his struggles of 2006 may suggest that the end is near. We should take serious care to comprehend just what a monumentally special pitcher this guy has been.
 Year  Age    G   IP    W    L    H   HR   BB   SO  ERA
 1992   20    2    8    0    1    6    0    1    8 2.38
 1993   21   65  107   10    5   75    5   56  122 2.68
 1994   22   24  145   11    5  112   10   41  132 3.17
 1995   23   30  195   14   10  153   19   61  162 3.26
 1996   24   33  217   13   10  183   17   64  206 3.43
 1997   25   31  241   17    8  153   15   62  283 1.76
 1998   26   33  234   19    7  182   24   62  233 2.68
 1999   27   31  213   23    4  155    8   34  291 1.92
 2000   28   29  217   18    6  124   15   29  264 1.62
 2001   29   18  117    7    3   84    5   25  163 2.39
 2002   30   30  199   20    4  144   13   40  239 2.26
 2003   31   29  187   14    4  147    7   47  206 2.22
 2004   32   33  217   16    9  193   26   61  227 3.90
 2005   33   31  217   15    8  159   19   47  208 2.82
 2006   34   23  133    9    8  108   19   39  137 4.48
Career      442 2646  206   92 1980  202  669 2880 2.70
The Big Unit didn’t achieve his first full big league season until the age of 25, and struggled that year to a 7-13, 82 ERA+ result, not exactly portents of a long and successful run.
But then, The Big Unit established himself as a bona fide major leaguer. However, the level he achieved over his age-26-thru-age-28 seasons was as a little-better-than-league-average innings-eater, who racked up a ton of strikeouts but also yielded vastly too many walks. The daunting pitch-count accumulation didn’t bode well.
But then, The Big Unit suddenly demonstrated the ability to coordinate the far-flung moving parts in his 6-foot-10-inch delivery and control his exceptionally-high-velocity offerings. However, he was 29, and with more mileage on his tires than most 29-year-olds. It didn’t appear as though he’d enjoy an extended run of stardom.
But then, The Big Unit improved his control, and improved it some more, developing the capacity to paint with his slider as well as his fastball. He became, in his thirties, not just a star, but one of the elite aces in the game. Indeed he persevered through some significant injuries and just got better and better, putting together a run through his mid-to-late thirties that ranks with the best ever.
Now, well into his forties, The Big Unit appears to finally be nearing the end of the line. But then, with this guy, I wouldn’t be too sure.
 Year  Age    G   IP    W    L    H   HR   BB   SO  ERA
 1988   24    4   26    3    0   24    4    7   26 2.56
 1989   25   29  161    7   13  152   17   97  137 5.09
 1990   26   33  220   14   11  180   33  121  205 3.86
 1991   27   33  201   13   10  156   19  154  241 4.20
 1992   28   31  210   12   14  159   17  146  255 3.98
 1993   29   35  255   19    8  183   24   97  317 3.33
 1994   30   23  172   13    6  128   13   66  189 2.96
 1995   31   30  214   18    2  154   11   60  273 2.30
 1996   32   14   61    5    0   47    7   23   79 3.41
 1997   33   30  213   20    4  143   18   71  270 2.12
 1998   34   34  244   19   11  197   21   79  305 3.04
 1999   35   35  272   17    9  201   27   64  338 2.30
 2000   36   35  249   19    7  196   21   70  322 2.45
 2001   37   35  250   21    6  181   19   71  372 2.49
 2002   38   35  260   24    5  197   26   71  334 2.32
 2003   39   18  114    6    8  125   16   27  125 4.26
 2004   40   35  246   16   14  177   18   44  290 2.60
 2005   41   34  226   17    8  207   32   47  211 3.79
 2006   42   33  205   17   11  194   28   60  172 5.00
Career      556 3799  280  147 3002  371 1375 4461 3.19
With Pedro or the Big Unit, exactly why they were blowing opposing lineups away was blatantly obvious: their stuff was just overpowering, unhittable. But Maddux never overpowered anyone in his life. That his combination of magnificent control, smarts, and competitive intensity would make him an excellent pitcher is one thing, but at his peak Maddux wasn’t merely excellent, he was bordering on perfect. It was just weird that major league hitters could be made that helpless by those pitches.
 Year  Age    G   IP    W    L    H   HR   BB   SO  ERA
 1986   20    6   31    2    4   44    3   11   20 5.52
 1987   21   30  156    6   14  181   17   74  101 5.61
 1988   22   34  249   18    8  238   17   82  148 3.36
 1989   23   35  238   19   12  230   17   83  143 3.12
 1990   24   35  237   15   15  251   14   72  152 3.65
 1991   25   37  263   15   11  240   23   67  209 3.54
 1992   26   35  268   20   11  208    9   71  210 2.30
 1993   27   36  267   20   10  226   15   51  203 2.43
 1994   28   25  202   16    6  146    4   28  145 1.45
 1995   29   28  210   19    2  143    7   21  168 1.51
 1996   30   35  245   15   11  218   10   26  160 2.52
 1997   31   33  233   19    4  194    8   18  164 2.04
 1998   32   34  251   18    9  195   12   41  189 2.06
 1999   33   33  219   19    9  250   15   34  126 3.31
 2000   34   35  249   19    9  218   17   39  176 2.78
 2001   35   34  233   17   11  220   20   27  173 3.05
 2002   36   34  199   16    6  194   14   45  118 2.62
 2003   37   36  218   16   11  225   24   33  124 3.96
 2004   38   33  213   16   11  218   35   33  151 4.02
 2005   39   35  225   13   15  239   29   36  136 4.24
 2006   40   34  210   15   14  219   20   37  117 4.20
Career      677 4616  333  203 4298  329  929 3133 3.06
The Rocket might not be the best pitcher in the history of the game, but if he isn’t, he’s very close. No serious consideration of the question can fail to prominently include him.
Given that, the strange thing about Clemens’ career is its complete lack of an arc. It’s as though all the individual season stat lines were tossed into a barrel and then selected one by one in random order. For instance, check out this zig-zagging line:
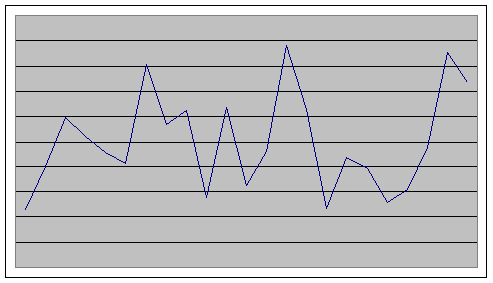
Know what that is? It’s The Rocket’s ERA+, by season. There’s essentially no pattern at all; Clemens has never really had a peak, or perhaps it makes more sense to say he’s had numerous interchangeable peaks, as well as a few valleys. It’s an odd sort of inconsistency, that wouldn’t seem to be associated with such a phenomenally great player, but it is.
 Year  Age    G   IP    W    L    H   HR   BB   SO  ERA
 1984   21   21  133    9    4  146   13   29  126 4.32
 1985   22   15   98    7    5   83    5   37   74 3.29
 1986   23   33  254   24    4  179   21   67  238 2.48
 1987   24   36  282   20    9  248   19   83  256 2.97
 1988   25   35  264   18   12  225   22   63  307 3.09
 1989   26   35  253   17   11  223   26   94  243 3.31
 1990   27   31  228   21    6  200    9   55  221 2.04
 1991   28   35  271   18   10  227   19   66  255 2.77
 1992   29   32  247   18   11  210   14   63  220 2.55
 1993   30   29  192   11   14  174   19   66  165 4.59
 1994   31   24  171    9    7  120   14   65  156 2.65
 1995   32   23  140   10    5  137   14   55  123 3.88
 1996   33   34  243   10   13  210   17   97  239 3.37
 1997   34   34  264   21    7  198    8   63  271 1.90
 1998   35   33  235   20    6  164   10   81  252 2.46
 1999   36   30  188   14   10  180   18   83  151 4.27
 2000   37   32  204   13    8  179   24   77  175 3.43
 2001   38   33  220   20    3  205   19   72  213 3.51
 2002   39   29  180   13    6  172   18   63  192 4.35
 2003   40   33  212   17    9  199   24   58  190 3.91
 2004   41   33  214   18    4  169   15   79  218 2.98
 2005   42   32  211   13    8  151   11   62  185 1.87
 2006   43   19  113    7    6   89    7   29  102 2.30
Career      691 4818  348  178 4086  365 1506 4569 3.08
Mr. Bonds
That OPS figure there in 1992 would be the highest anyone had posted since Ted Williams in 1957, and the highest in the National League since Hack Wilson in 1930. And then, of course, Bonds would surpass it in ’93. This exercise shaves 25 homers from Bonds’s total in the 1994-2000 period, but gives back an additional 42 for 1988-93; overall it’s clear that Bonds was hurt more by the low-offense conditions of the early part of his career than helped by those of the high-offense middle part.
But of course, what seems to have transfixed everyone’s attention is Bonds’s performance within the middle-range conditions of the last part of his career. The magnitude of the late-career power-and-average peak is distinctly clarified by this exercise. However, before immediately leaping to the frequently-heard conclusion along the lines of “this clearly demonstrates how dramatically steroid usage enhances baseball performance,” it’s prudent to contemplate a few points:
– The general assumption is that Bonds began using PEDs following the 1998 season—a full two years before his spike in peformance began in 2001.
– MLB began its first random steroid-testing program in 2004, a season in which the 39-year-old Bonds never flunked a drug test—and he hit just about exactly as well as he had in 2001-2002.
– Based on the profile of players who have failed drug tests in 2004 and since, it seems likely that more than a few of the pitchers Bonds was facing post-1998 were PED users, and probably at a higher proportion in that period (at least through 2003) than that of earlier in his career.
– Also based on the profile of players who’ve failed drug tests, significant or even noticeable performance spikes aren’t typical career features at all.
None of these points mean that Bonds hasn’t used steroids; personally I’ve never doubted that he has. But they do suggest:
– Bonds has been hardly alone and perhaps not even unusual within MLB as a steroid user.
– His spike in performance has been anything but typical of steroid users, and thus almost certainly not solely a function of steroid use.
– His continuing maximal performance even under the drug testing protocol of 2004 further undercuts the certainty of the spike being entirely steroid-caused, and/or it should cause one to seriously question the efficacy of testing at curbing PED usage.
At any rate, this much is certain: all things considered, this guy is, if not the very best, then at least among the tiny handful of very best baseball players the world has yet seen.
Year   Age   AB    R    H   2B   3B   HR  RBI   BB   SO   BA  OBP  SLG   OPS
 1986   21  413   72   92   26    3   16   48   65  102 .223 .328 .416  .745
 1987   22  551   99  144   34    9   25   59   54   88 .261 .327 .492  .819
 1988   23  543  106  157   33    5   31   63   73   87 .290 .374 .538  .912
 1989   24  585  104  149   37    6   24   63   94   98 .255 .358 .464  .822
 1990   25  525  113  162   35    3   42  124   94   88 .308 .413 .628 1.041
 1991   26  515  103  154   31    5   32  126  108   77 .299 .421 .565  .986
 1992   27  478  119  152   39    5   44  112  128   73 .318 .463 .695 1.158
 1993   28  537  128  179   39    4   50  122  124   81 .334 .459 .703 1.161
 1994   29  387   82  118   17    1   34   75   68   40 .306 .409 .615 1.024
 1995   30  502  101  145   28    7   30   96  110   77 .288 .417 .553  .970
 1996   31  512  113  154   25    3   38  119  139   71 .301 .450 .586 1.036
 1997   32  527  113  150   25    5   36   93  133   81 .285 .429 .558  .987
 1998   33  547  111  162   41    7   34  113  120   85 .296 .422 .583 1.005
 1999   34  352   84   90   19    2   31   77   67   58 .256 .375 .584  .959
 2000   35  476  119  143   26    4   44   98  108   71 .300 .429 .653 1.082
 2001   36  476  129  156   32    2   73  137  177   93 .328 .510 .863 1.373
 2002   37  403  117  149   31    2   46  110  198   47 .370 .577 .799 1.376
 2003   38  390  111  133   22    1   45   90  148   58 .341 .522 .749 1.271
 2004   39  373  129  135   27    3   45  101  232   41 .362 .607 .812 1.419
 2005   40   42    8   12    1    0    5   10    9    6 .286 .412 .667 1.078
 2006   41  367   74   99   23    0   26   77  115   51 .270 .444 .545  .989
Career     9503 2134 2837  592   79  751 1912 2364 1472 .299 .438 .614 1.053
References & Resources
In order to modify the actual stats into a shape fitting this smoothed line:
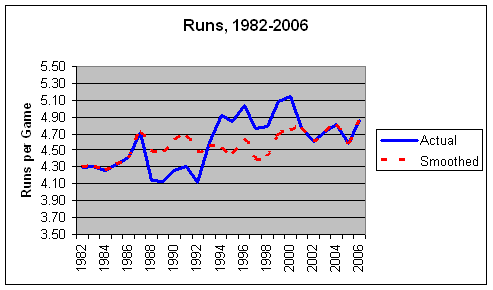
We used an approach similar to the approach we used in several past such exercises, beginning with the overall aggregate rate of the primary offensive events for the entire 1982-2006 period: runs, hits, doubles, triples, home runs, walks, and strikeouts. We then adjusted the rates for each season from 1988-1992 to bring the aggregate total for that period to equal that of 1982-2006, also for 1993, and also for 1994-2000. The specific multipliers employed are:
1988-92:
Runs: 1.087
Hits: 1.035
Doubles: 1.095
Triples: 1.012
Home Runs: 1.281
Walks: 1.011
Strikeouts: 1.056
1993:
Runs: 0.992
Hits: 0.992
Doubles: 1.023
Triples: 1.002
Home Runs: 1.097
Walks: 0.982
Strikeouts: 1.028
1994-2000:
Runs: 0.923
Hits: 0.971
Doubles: 0.943
Triples: 1.053
Home Runs: 0.906
Walks: 0.919
Strikeouts: 0.928
An impact of a change in the rate of hits is a change in at-bats, of course. I use a simple method to change at-bats: every batter’s at-bats are increased or decreased by his number of increased or decreased hits. Outs are constant, of course, and I assume as well a constant rate of double plays and baserunning outs—probably not exactly proper assumptions, but close enough for our purposes.