Smoothing the ‘80s and ‘90s (Part 1)
In 2006, major league teams scored runs at the rate of 4.86 per game. A quarter-century earlier, in 1982, they had scored 4.30. Thus there has been an increase over the 25 years of just over a half a run per game, per team (a change which is, in historical terms, quite significant; the average over the period 1901-2006 is 4.38, and there have been just 15 seasons in that span with higher scoring rates than that of 2006).
So we’ve seen a distinct recent trend toward more runs, and we know the long list of factors likely contributing to the change in the nature of play:
– the configuration of ballparks
– the de facto strike zone
– the effective abolishment of the brushback pitch
– the resilience of the ball
– the hardness of bats
– the strength of batters (whether PED-aided or not)
– the ascendancy of power swinging over contact hitting
– the willingness of teams to make roster, lineup, and in-game tactical decisions that favor offense
We may like the more high-scoring game we see today (the attendance boom over the past couple of decades suggests that most fans do—an all-time per-game attendance record was set in 2006), or we may not (I’m not crazy about it myself), but it clearly is in our midst.
What we’ll focus on in this series isn’t the change in scoring rates from the 1980s to the 2000s per se, but rather the path the change took. That path has been interestingly circuitous.
Indeed, the line from the 1982 scoring rate to the 2006 scoring rate was anything but direct, leaping here and diving there:

We see the spike of 1987 and the plunge of 1988. We see the resurgent boom in scoring of 1993-94, scaling ever-higher peaks until 2000, before descending once again.
There are a number of particular reasons that help to explain each particular divergence from the straight line, in every instance the strike zone prominently among them. But for our purposes today, we won’t dwell on why the line meandered exactly as it did. Instead, we’ll consider how the fact that it did meander as it did influenced our perception of the performances of the game’s most prominent players, and how a less swervy path, arriving at the same destination, would have caused us to see our favorite stars quite differently.
Every individual player’s stats are, of course, a product not only of the player’s ability, but also of his environment. Changing game conditions impact everything; there is no such thing as a player’s performance record, no matter how famous or obscure, remarkable or humdrum, that isn’t a function of those conditions.
So let’s conduct a thought experiment around that scoring line from 1982 through 2006. Let’s imagine that the line didn’t meander as dramatically as it did: let’s remove both the big dip of 1988-92, as well as the big balloon of 1994-2000. What we’ll do is take the actual total volume of runs that was scored from 1988 through 2000, but spread them out more evenly, so that the aggregate scoring of both the 1988-92 period and the 1994-2000 period are equal (our methodology is explained below in the References and Resources section). When we do this, we see a relatively “smoothed” line:
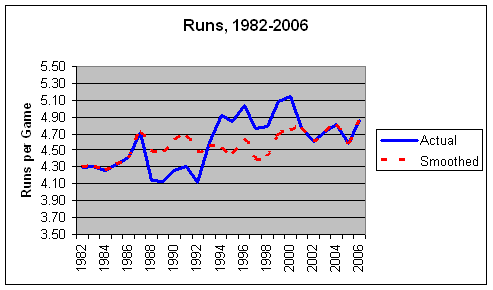
In this alternative universe, the eccentric year-to-year fluctuations remain, but the general trend from 1987 to 2001, instead of diving, soaring, and easing back, navigates a somewhat steady upward progression.
How would the most extraordinary individual statistical marks have been different in such a circumstance? Over the next two weeks, we’ll do our best to find out. We’ll be re-casting the year-by-year performances of all the game’s biggest stars, both batters and pitchers, and considering the ways in which our perceptions of them might have been altered.
Here’s a hint at the kind of things we’ll be discovering in the Smoothed MLB: a new National League single season home run record was achieved—in the 1980s. And a new major league record was established in the 1990s, but not by Mark McGwire, who fell short. Stay tuned, it promises to be fun.
In closing for now, we’ll catch a glimpse at a few guys who weren’t necessarily among the game’s elite stars, but who are nonetheless interesting to consider in this regard. Bear in mind that the stat lines that appear in black font are actuals, and the lines that appear in blue are adjusted.
A Pair of Suddenly-Powerful Center Fielders
When Finley was in his twenties, I recall Bill James aptly describing him as “a poor man’s Brett Butler“: Finley was a gap hitter, a pretty typical leadoff or second-slot guy. Then suddenly at the age of 31 he began hitting for power, a talent he never really lost until the last season or two.

A lot of Finley’s transformation was clearly attributable to weight training; whether steroid-aided or not, Finley is as well conditioned a ballplayer as one will ever see. His extraordinary durability and career longevity attest to that. But it also appears that Finley made a deliberate change in batting approach beginning in ’96, turning on the pitch and being a bit less focused on putting the ball in play. At any rate, the coincidental timing of Finley’s new-found power with the high-octane environment of the mid-to-late 1990s made his career shape look more unusual than it might have. In this view it doesn’t appear quite as extreme.
 Year  Age   AB    R    H   2B   3B   HR  RBI   BB   SO   BA  OBP  SLG  OPS
 1989   24  219   38   56    5    2    3   27   15   32 .255 .304 .334 .638
 1990   25  468   50  123   18    4    4   40   32   56 .263 .311 .342 .653
 1991   26  602   91  176   31   10   10   59   42   69 .292 .339 .428 .767
 1992   27  613   91  183   32   13    6   60   59   67 .299 .360 .425 .785
 1993   28  544   68  144   15   13    9   44   27   67 .264 .300 .389 .689
 1994   29  370   59  100   15    5   10   30   26   48 .270 .318 .420 .738
 1995   30  557   96  162   22    8    9   41   54   58 .291 .354 .409 .763
 1996   31  649  116  189   42    9   27   88   51   81 .292 .344 .512 .855
 1997   32  556   93  142   25    5   25   85   40   85 .255 .305 .455 .760
 1998   33  614   85  149   38    6   13   62   41   96 .243 .291 .387 .678
 1999   34  585   92  151   30   11   31   95   58   87 .259 .325 .504 .829
 2000   35  535   92  147   25    5   32   89   60   81 .274 .347 .520 .867
 2001   36  495   66  136   27    4   14   73   47   67 .275 .338 .430 .768
 2002   37  505   82  145   24    4   25   89   65   73 .287 .368 .499 .867
 2003   38  516   82  148   24   10   22   70   57   94 .287 .358 .500 .858
 2004   39  628   92  170   28    1   36   94   61   82 .271 .333 .490 .823
 2005   40  406   41   90   20    3   12   54   26   71 .222 .271 .374 .645
 2006   41  426   66  105   21   12    6   40   46   55 .246 .320 .394 .714
Anderson’s 1996 was surely one of the great fluke years of all time, but like Finley, his particular actual numbers are amplified by the dramatic shift in conditions between the early and mid-to-late ’90s. Here the ’96 still sticks out, but the overall pattern doesn’t look all that strange.
 Year  Age   AB    R    H   2B   3B   HR  RBI   BB   SO   BA  OBP  SLG  OPS
 1988   24  327   34   71   14    4    1   23   23   79 .218 .270 .298 .568
 1989   25  268   48   57   13    2    5   17   43   48 .213 .322 .334 .656
 1990   26  236   26   56    5    2    4   26   31   49 .237 .326 .326 .653
 1991   27  258   43   61   13    3    3   29   38   46 .237 .336 .341 .677
 1992   28  629  109  175   31   10   27   87   99  104 .278 .376 .487 .864
 1993   29  559   86  146   37    8   14   65   80  102 .261 .354 .432 .786
 1994   30  450   72  116   24    5   11   44   52   70 .257 .335 .405 .740
 1995   31  550  100  141   31   11   15   59   80  103 .256 .351 .430 .781
 1996   32  574  108  167   35    5   45  101   70   98 .291 .368 .607 .975
 1997   33  585   90  165   37    7   16   67   77   97 .282 .366 .454 .820
 1998   34  476   78  110   26    3   16   47   69   72 .231 .328 .402 .730
 1999   35  559  101  154   26    5   22   75   88   97 .276 .375 .459 .833
 2000   36  502   82  126   25    0   17   46   85   96 .251 .359 .403 .762
 2001   37  430   50   87   12    3    8   45   60   77 .202 .300 .300 .600
 2002   38   80    4   13    4    0    1    5   18   23 .163 .316 .250 .566
A Pair of Gopher Ball Specialists
Okay, it isn’t fair to characterize Browning that way; he was a good pitcher. But yowza, he was, shall we say, unafraid to challenge the hitters. That’s a National League-record-tying home runs allowed figure there in ’88.
 Year  Age    G   IP    W    L    H   HR   BB   SO  ERA
 1984   24    3   23    1    0   27    0    5   14 1.54
 1985   25   38  261   20    9  242   29   73  155 3.55
 1986   26   39  243   14   13  225   26   70  147 3.81
 1987   27   32  183   10   13  201   27   61  117 5.02
 1988   28   36  251   18    5  212   46   65  131 3.60
 1989   29   37  250   15   12  250   40   65  125 3.58
 1990   30   35  228   15    9  243   31   53  105 4.01
 1991   31   36  230   14   14  250   41   57  121 4.42
 1992   32   16   87    6    5  112    8   28   35 5.36
 1993   33   21  114    7    7  158   16   20   55 4.87
 1994   34    7   41    3    1   33    7   12   20 3.90
 1995   35    2   10    0    2   13    2    5    3 7.52
And this guy, who actually set the new NL record in 2000, falls just a bit shy of tying it here.
Has anybody ever gotten more career mileage out of a couple of good years?
 Year  Age    G   IP    W    L    H   HR   BB   SO   ERA
 1994   21    3    7    0    1   11    2    3    6 12.53
 1995   22   15   74    3    9   83    9   17   34  5.67
 1996   23   39   73    5    6   84   12   20   55  5.29
 1997   24   52   75    1    6   77    8   15   58  4.90
 1998   25   33  233   16    8  222   31   29  157  3.43
 1999   26   35  246   21   10  249   27   40  174  3.32
 2000   27   33  196    7   16  244   44   63  115  6.17
 2001   28   32  166    6   12  197   35   38   84  5.54
 2002   29   20   68    4    6   86   12   21   33  7.77
 2003   30   14   73    8    3   80    7   26   32  4.91
 2004   31   36  170   13    5  178   33   34   93  4.07
 2005   32   32  169    5   16  219   31   61   80  6.99
 2006   33    4   17    0    4   25    3   10   12  9.87
The Tornado
Viewed in this context, the lean times before Nomo encountered after his big early splash and before his late-career revival don’t look quite so rough. He had wicked nasty stuff.
 Year  Age    G   IP    W    L    H   HR   BB   SO   ERA
 1995   26   28  191   13    6  120   13   72  219  2.36
 1996   27   33  228   16   11  175   21   78  217  2.96
 1997   28   33  207   14   12  187   21   85  216  3.94
 1998   29   29  157    6   12  126   17   86  155  4.57
 1999   30   28  176   12    8  168   24   72  149  4.21
 2000   31   32  190    8   12  185   28   82  168  4.40
 2001   32   33  198   13   10  171   26   96  220  4.50
 2002   33   34  220   16    6  189   26  101  193  3.39
 2003   34   33  218   16   13  175   24   98  177  3.09
 2004   35   18   84    4   11  105   19   42   54  8.25
 2005   36   19  101    5    8  127   16   51   59  7.24
Ape
Maybe it’s just me, but this guy rarely seemed to register on my radar screen as prominently as he should have. A consistently productive pitcher for quite a long time.
 Year  Age    G   IP    W    L    H   HR   BB   SO   ERA
 1989   21    6   22    1    4   35    4   12   11  9.65
 1990   22   32  186   12    8  185   17   55  134  2.92
 1991   23   34  208   13   10  212   17   62  167  3.61
 1992   24   30  208   15    8  173   13   69  158  2.60
 1993   25   34  239   18    8  181    9   80  191  2.63
 1994   26   23  155    7    6  133   10   58  135  3.56
 1995   27   31  201   15   10  158   13   74  172  3.61
 1996   28   32  211   14   11  186   15   69  192  3.36
 1997   29   34  236    9   13  209   22   68  182  3.16
 1998   30    3   15    1    2   20    3    5    8  7.24
 1999   31   34  209   16   14  223   24   77  122  4.80
 2000   32   31  195   15   11  194   21   94  120  4.20
 2001   33   33  207   11   10  181   22   64  172  3.57
 2002   34   32  188   14   12  191   23   64  132  3.92
 2003   35   23  112    8    9  120   21   43   55  5.40
 2004   36    2    4    0    1    7    0    3    2 13.50
The Blake Street Bombers
But of course, the extreme mile-high park effect greatly padded the stats of this crew. But this exercise reminds us that those particular figures were as mind-boggling as they were not only because of the thin air, but also because these particular guys were all enjoying their peak productive years in pre-humidor Denver and in the highest-scoring era since the 1930s. It was, indeed, the perfect storm for crooked numbers.
An easy target for “overrated” derision, but the truth is that in his prime years Castilla was a pretty good hitter. Combine that with his excellent glove and terrific durability, and you’ve got yourself a fine player. It isn’t his fault that teams kept insisting on lavishing him with regular playing time for years afterward.
 Year  Age   AB    R    H   2B   3B   HR  RBI   BB   SO   BA  OBP  SLG  OPS
 1991   23    5    1    1    0    0    0    0    0    2 .200 .200 .200 .400
 1992   24   16    1    4    1    0    0    1    1    4 .250 .278 .313 .591
 1993   25  336   36   85    9    7   10   30   13   46 .254 .281 .411 .692
 1994   26  129   15   42   10    1    3   17    6   21 .324 .356 .485 .841
 1995   27  522   76  158   32    2   29   83   28   81 .303 .338 .539 .877
 1996   28  623   90  185   32    0   36  104   32   82 .297 .332 .523 .855
 1997   29  607   87  181   24    2   36  104   40  100 .298 .342 .523 .864
 1998   30  639  100  200   26    4   42  133   37   83 .313 .350 .563 .914
 1999   31  610   77  164   23    1   30   94   49   70 .269 .323 .457 .780
 2000   32  329   20   71    8    1    5   39   13   38 .215 .245 .297 .542
 2001   33  538   69  140   34    1   25   91   35  108 .260 .305 .467 .772
 2002   34  543   56  126   23    2   12   61   22   69 .232 .262 .348 .610
 2003   35  542   65  150   28    3   22   76   26   86 .277 .310 .461 .771
 2004   36  583   93  158   43    3   35  131   51  113 .271 .330 .535 .865
 2005   37  494   53  125   36    1   12   66   43   82 .253 .313 .403 .716
 2006   38  275   26   63   10    0    5   27    9   49 .229 .254 .320 .574
Not exactly the demigod the Coors Field public address announcer would have us believe, but not a bad player either. Under different circumstances, he’d have likely been perceived as the useful corner outfielder he was: a decent bat, pretty mobile, the kind of guy who can make a contribution as a role player on a good team.
 Year  Age   AB    R    H   2B   3B   HR  RBI   BB   SO   BA  OBP  SLG  OPS
 1988   24   46    1   12    2    0    0    9    0    7 .261 .261 .315 .576
 1989   25  139   14   30    8    0    4   16    6   25 .216 .249 .354 .603
 1990   26  352   43   92   16    1   19   58   16   83 .262 .294 .478 .772
 1991   27  449   58  110   20    3   19   64   22  113 .245 .280 .430 .711
 1992   28  391   40  115   30    2    6   45   16   78 .294 .322 .429 .751
 1993   29  537   92  166   44    5   23   88   27  102 .309 .342 .538 .880
 1994   30  480   68  143   31    2   24   88   17   65 .297 .322 .524 .846
 1995   31  573   94  191   36    2   36  118   20   89 .334 .356 .593 .950
 1996   32  627  105  192   37    3   28  130   41   97 .306 .349 .510 .859
 1997   33  556   75  168   29    2   24  109   28   84 .302 .335 .489 .824
 1998   34  656   90  213   45    2   20  113   26   71 .324 .350 .491 .841
 1999   35  588   96  172   36    2   31  123   50   78 .292 .347 .518 .865
 2000   36  570   74  164   30    2   21   83   45   84 .288 .340 .458 .798
 2001   37  391   45  112   30    1   12   49   20   76 .286 .321 .460 .782
A very fine player indeed. If not for his significant injury issues, Burks would have been a superstar.
 Year  Age   AB    R    H   2B   3B   HR  RBI   BB   SO   BA  OBP  SLG   OPS
 1987   22  558   94  152   30    2   20   59   41   98 .272 .322 .441  .763
 1988   23  546  101  165   41    5   23  100   63   94 .302 .374 .521  .895
 1989   24  403   79  125   21    6   15   66   36   55 .311 .368 .507  .874
 1990   25  594   97  180   36    8   27   97   49   87 .303 .356 .527  .883
 1991   26  478   61  123   36    3   18   61   39   86 .258 .314 .458  .773
 1992   27  237   38   62    9    3   10   33   25   51 .262 .333 .454  .787
 1993   28  498   74  136   25    4   19   73   59  100 .273 .350 .451  .800
 1994   29  148   30   47    8    3   12   22   15   36 .316 .378 .649 1.027
 1995   30  276   38   72    9    6   13   45   36   67 .260 .345 .478  .824
 1996   31  607  131  205   42    8   36  118   56  106 .338 .394 .614 1.008
 1997   32  420   84  119   18    2   29   76   43   70 .284 .351 .544  .894
 1998   33  500   70  143   26    6   19   70   53  103 .286 .354 .478  .832
 1999   34  387   67  107   18    0   28   89   63   80 .276 .378 .540  .918
 2000   35  389   68  131   20    5   22   89   51   45 .337 .414 .583  .997
 2001   36  439   83  123   29    1   28   74   62   85 .280 .369 .542  .911
 2002   37  518   92  156   28    0   32   91   44  108 .301 .356 .541  .896
 2003   38  198   27   52   11    1    6   28   27   46 .263 .351 .419  .770
 2004   39   33    6    6    0    0    1    1    3    8 .182 .250 .273  .523
Among the weirder careers, for sure. Not only did it include two amazing comebacks, but it also presented just about as unlikely a combination of ghastly walk-strikeout rates and genuine offensive value as we’ve ever seen.
This exercise demonstrates that his early-’90s struggles weren’t quite as bad as they might appear. But they were bad.
 Year  Age   AB    R    H   2B   3B   HR  RBI   BB   SO   BA  OBP  SLG   OPS
 1985   24   75    9   14    1    0    2    4    3   18 .187 .218 .280  .498
 1986   25  321   39   87   13    0   10   42   30   79 .271 .333 .405  .738
 1987   26  551   72  168   40    3   13   90   41  127 .305 .353 .459  .812
 1988   27  616  108  191   46    8   37  100   39  162 .310 .351 .592  .943
 1989   28  577   83  152   33    1   29   92   49  167 .264 .321 .477  .798
 1990   29  584   71  153   32    0   26   95   40  179 .262 .310 .448  .758
 1991   30  378   37   85   14    2   12   36   23   91 .225 .270 .365  .634
 1992   31  328   41   82   15    2   13   42   11   73 .250 .274 .426  .700
 1993   32  469   70  173   36    4   24   97   24   75 .368 .398 .616 1.015
 1994   33  413   71  129   20    0   28   78   17   86 .313 .340 .564  .905
 1995   34  549   82  150   27    3   28   98   29  136 .274 .311 .489  .799
 1996   35  620  110  184   37    3   43  138   37  146 .297 .337 .573  .909
 1997   36  594  111  185   29    3   37  129   50  131 .312 .365 .559  .924
 1998   37  550   95  164   25    1   40  112   58  136 .298 .365 .566  .931
 1999   38
 2000   39  490   62  145   24    1   25   92   33  117 .295 .340 .503  .843
 2001   40  399   50  102   28    1   17   69   31  117 .256 .309 .459  .768
 2002   41  292   30   76   12    0    9   40   30   81 .260 .329 .394  .723
 2003   42  272   36   82   15    0   12   42   19   61 .301 .347 .489  .836
 2004   43   10    1    3    0    0    1    2    0    3 .300 .364 .600  .964
Not as brittle as Burks, but another guy whose chronic inability to stay fully healthy is really the only knock against him. As it is, he’ll deserve some amount of Hall of Fame consideration, and had he been able to play 150+ games on a consistent basis, they might be casting the plaque already.
 Year  Age   AB    R    H   2B   3B   HR  RBI   BB   SO   BA  OBP  SLG   OPS
 1989   22   47    4    8    0    0    0    4    5   14 .175 .255 .175  .430
 1990   23  423   64  105   20    3   24   55   50  118 .247 .326 .481  .808
 1991   24  492   64  146   33    2   20   70   42  108 .297 .353 .497  .849
 1992   25  534   92  165   34    4   29  101   41  102 .309 .358 .553  .911
 1993   26  489   84  129   25    5   24   85   79   78 .264 .366 .482  .848
 1994   27  391   70  123   41    2   17   79   43   69 .315 .383 .564  .947
 1995   28  490   89  147   29    5   33   93   45   67 .299 .358 .581  .939
 1996   29  270   54   73   17    4   16   54   18   54 .270 .316 .545  .862
 1997   30  562  132  202   43    4   44  120   72   84 .359 .432 .689 1.120
 1998   31  449  104  160   43    3   21   62   59   57 .357 .431 .606 1.038
 1999   32  433  100  161   25    4   34  106   52   48 .372 .440 .680 1.120
 2000   33  311   59   94   20    7    8   47   42   37 .303 .386 .492  .878
 2001   34  497  107  174   35    3   38  123   82  103 .350 .442 .662 1.104
 2002   35  477   95  161   40    4   26  104   65   73 .338 .417 .602 1.019
 2003   36  454   86  129   25    7   16   79   98   87 .284 .411 .476  .887
 2004   37  258   51   77   16    4   17   47   49   57 .298 .424 .589 1.013
 2005   38  315   66   91   20    1   15   52   41   64 .289 .384 .502  .886
Next Time
We’ll examine many of the best careers of the ’80s and ’90s.
References & Resources
Similar to the approach we used in several past such exercises, we took the overall aggregate rate of the primary offensive events for the entire 1982-2006 period: runs, hits, doubles, triples, home runs, walks, and strikeouts. We then adjusted the rates for each season from 1988-1992 to bring the aggregate total for that period to equal that of 1982-2006, also for 1993, and also for 1994-2000. The specific multipliers employed are:
1988-92:
Runs: 1.087
Hits: 1.035
Doubles: 1.095
Triples: 1.012
Home Runs: 1.281
Walks: 1.011
Strikeouts: 1.056
1993:
Runs: 0.992
Hits: 0.992
Doubles: 1.023
Triples: 1.002
Home Runs: 1.097
Walks: 0.982
Strikeouts: 1.028
1994-2000:
Runs: 0.923
Hits: 0.971
Doubles: 0.943
Triples: 1.053
Home Runs: 0.906
Walks: 0.919
Strikeouts: 0.928
An impact of a change in the rate of hits is a change in at-bats, of course. I use a simple method to change at-bats: every batter’s at-bats are increased or decreased by his number of increased or decreased hits. Outs are constant, of course, and I assume as well a constant rate of double plays and baserunning outs—probably not exactly proper assumptions, but close enough for our purposes.
Big props to my ever-patient THT editor Greg Tamer, who accomplished the feat of teaching me to create and post graphs, and to insert alternate-color fonts. When they make the movie of this epic adventure, it will likely be called The Miracle Worker II.