Stranded on a Desert Island: Justin Verlander Shoots for Another Record

Justin Verlander is doing historic things when it comes to stranding runners. (via D. Benjamin Miller)
.jpg)
Stop me if you’ve heard this one before, but we should be paying attention to Justin Verlander.
In light of his September 1 no-hitter, much fuss has been made about Verlander as of late, and for good reason. Even by a no-hitter’s rarified standards, Verlander’s effort was noteworthy. He joined ranks with Nolan Ryan, Sandy Koufax, Bob Feller, and Cy Young as the only modern-era pitchers with three successful no-hit bids, perhaps adding the final flourish necessary for a Cooperstown-worthy resume.
Craig Edwards expertly used batted-ball data to show how little defensive help Verlander needed to keep Toronto in check. Over 303 recorded no-hitters, his 14 strikeouts have been matched in only 11. It was just the 15th time ever a pitcher has recorded a Game Score of 100. No-hitters aren’t always pretty—they don’t always even guarantee a victory—but Verlander’s was pretty much as good as they come.
It’s difficult for such a special performance to feel closer to the norm than an aberration, but Verlander is in the midst of a special season. At age 36, he leads the American League in wins (18), ERA (2.52), WHIP (0.77), hits per nine innings pitched (5.3), and walks per nine (1.5). His 264 strikeouts trail only his teammate Gerrit Cole, and his 3.6 second-half WAR is a full win better than second-place Jack Flaherty.
That being said, it’s not cake and ice cream across the board: his 3.35 FIP is slightly less rosy; his full-season 5.5 WAR is good for “just” sixth in the league. This is largely due to an inflated home run rate (a topic on which Verlander himself has some pointed thoughts), but it does little to diminish his accomplishments on the whole.
He also leads major league pitchers by a significant margin in another statistic, one that against all intuition perhaps best exemplifies Verlander’s recent dominance. With weeks remaining in the season, Verlander has stranded an astounding 89.6% of his baserunners. Per FanGraphs’ own definition, pitchers with a LOB% significantly above or below the league average of 70-72% are highly prone to regression. It makes sense that underlying metrics thinks he’s been a little lucky.
For us, the keyword in that definition is most. In theory, a higher than average LOB% can be sustainable for pitchers particularly adept at striking batters out and inducing weak contact. Accordingly, this year’s leaderboard shows a smattering of the league’s premier strikeout and groundball artists:
| Rank | Player | Team | LOB% | Career | ERA | FIP |
|---|---|---|---|---|---|---|
| 1 | Justin Verlander | Astros | 89.6% | 75.0% | 2.52 | 3.35 |
| 2 | Clayton Kershaw | Dodgers | 82.7% | 79.3% | 3.06 | 3.74 |
| 3 | Jack Flaherty | Cardinals | 82.5% | 79.7% | 2.99 | 3.66 |
| 4 | Mike Minor | Rangers | 81.9% | 74.8% | 3.08 | 3.9 |
| 5 | Gerrit Cole | Astros | 81.8% | 75.3% | 2.73 | 2.80 |
| 6 | Hyun-Jin Ryu | Dodgers | 81.2% | 78.3% | 2.45 | 3.18 |
| 7 | Sonny Gray | Reds | 80.8% | 73.1% | 2.75 | 3.37 |
| 8 | Max Scherzer | Nationals | 80.0% | 76.8% | 2.56 | 2.32 |
| 9 | Jacob deGrom | Mets | 80.1% | 79.0% | 2.76 | 2.86 |
| 10 | Mike Soroka | Braves | 80.1% | 77.4% | 2.67 | 3.5 |
Not only are the leaders in LOB% some of the league’s better overall pitchers, their career numbers trend above average across the board. They are also almost uniformly outperforming their fielding independent numbers—Max Scherzer exists on a plane of his own—indicating there is still plenty of luck involved. Kershaw’s career 79.3% strand rate is the highest of all time; deGrom is second among those with as many innings. You certainly would not be alone in thinking Verlander’s 90% is strangely high, even by his own excellent standards.
And you would be right! This is where the absurdity begins. Let’s look at the highest single-season strand rates ever posted by a qualified starting pitcher since 1901:
| Rank | Year | Player | Team | LOB% |
|---|---|---|---|---|
| 1 | 2019 | Justin Verlander | Astros | 89.6% |
| 2 | 1977 | John Candelaria | Pirates | 88.8% |
| 3 | 2018 | Blake Snell | Rays | 88.0% |
| 4 | 2017 | Clayton Kershaw | Dodgers | 87.4% |
| 5 | 1985 | Dwight Gooden | Mets | 86.9% |
| 6 | 1968 | Bob Gibson | Cardinals | 86.7% |
| 7 | 1955 | Billy Pierce | White Sox | 86.6% |
| 8 | 2000 | Pedro Martinez | Red Sox | 86.6% |
| 9 | 2015 | Zack Greinke | Dodgers | 86.5% |
| 10 | 1971 | Tom Seaver | Mets | 85.7% |
Among Gooden, Gibson, Pedro, and Seaver, we see some of the most memorably dominant single-season pitching performances of all time. Equally notable: Another three of the top 10 have come since 2015. Lurking just beyond, Mike Fiers (!) and Verlander’s own 2018 seasons rank 11th and 13th, respectively, on the same list. My gut tells me this is reflective of the dramatic recent shift in the pitcher-hitter battle dynamic, as contact and base hits are more frequently sacrificed to the altar of home runs and strikeouts.
That alone is not an adequate explanation of how Verlander is set to surpass John Candelaria’s 42-year-old record (set with just 5.2 K/9, incidentally) by nearly a full percentage point. On first glance, it would be easy to dismiss this as a fluke; an excellent pitcher is getting a little more lucky than usual. Verlander’s career BABIP of .282 is well below league average, but this year’s .204 mark would best the career low set during his 2011 MVP campaign by more than 30 points.
Cluster luck is undoubtedly a factor. We know hit distribution is essentially random. If Verlander is allowing an unusually low number of hits with runners on base, he eventually will give up a few more, and his LOB% will regress. There’s only so much a pitcher can do to control when hitters put the bat on the ball well enough to reach base.
Or is there? A closer look shows something even more remarkable than Verlander ludicrous bottom-line results. In a game in which so many outcomes are in the hands of others, is it possible Verlander has found the secret to bending the limits of non-home run scoring? Decide for yourselves.
Logic dictates the best way to prevent runners from scoring is to avoid any contact at all. With a man on third, a weak grounder can always find a hole, and a runner can always beat an outfielder to the plate (well, maybe not always). Not so with a strikeout. Verlander’s proclivity for punching hitters out is already crème de la crème, so he can reasonably be expected to run an above-average strand rate. He’s also a pitcher well known for wowing us by reaching back at will for a little extra oomph in high-pressure situations.
Let’s take a peek at Verlander’s strikeout and whiff percentages, controlling for baserunning scenario with separate buckets for bases empty, runners on base, and runners in scoring position:
| Situation | Batters | wOBA | Whiff% | K% |
|---|---|---|---|---|
| Bases Empty | 516 | 0.253 | 33.3% | 36.3% |
| Runners On | 194 | 0.209 | 34.3% | 31.3% |
| RISP | 99 | 0.216 | 37.6% | 32.0% |
Surprisingly, Verlander’s strikeout percentages actually decrease when runners get on base despite an increase in whiff rate and greater overall effectiveness. This would seem to sink the obvious hypothesis that Verlander’s strand rate is being suppressed by more strikeouts with men on base. He does miss more bats, but it’s not leading to more hitters seeing that third strike.
This was a perplexing development. Verlander being what he is, I remained unconvinced pure luck was at the root. After parsing batted-ball data until my eyes begged for mercy, a less exciting but equally logical solution dawned. There is a type of batted ball that’s only possible with runners on base, one that’s sometimes even more effective than a strikeout: a ground ball leading to a double play, or at the very least an easy force out. Strikeouts might be the lord of the pitching realm in 2019, but they don’t necessarily tell the whole story. Could it be that with runners on, Verlander sacrifices a slice of his supreme-pizza strikeout rate to angle for quick and efficient outs?
It seems unlikely. Verlander’s 35.2% groundball rate is the lowest of any qualified starter in baseball, and he’s thrown only four double plays all season. But a deep Statcast search shows Verlander ranks in the 56th percentile of inducing groundball force outs, double plays, and fielder’s choices with a runner on first and fewer than two outs. For most pitchers, this wouldn’t mean much. But baseball’s most extreme flyball pitcher suddenly becoming average with runners on base raises an eyebrow or three. Looking at pitch results again, this time considering when runners are only on first base, a pattern emerges:
| Situation | Zone% | Swing% | Whiff% | GB% |
|---|---|---|---|---|
| Bases Empty | 53.1% | 51.8% | 33.3% | 33.3% |
| Runner @ 1st | 52.0% | 50.5% | 30.9% | 43.3% |
| RISP | 45.0% | 53.0% | 37.6% | 35.5% |
Bingo! With a runner on first, Verlander goes from baseball’s most grounder-averse starter to one who entertains the idea often enough, costing just a couple points of whiff rate. Then, when runners advance into scoring position, he avoids the strike zone enough to hold swing rates steady while allowing much less contact.
To answer the original question, it seems Verlander’s astronomical strand rate is largely driven by combining an elite strikeout rate with a healthy number of easy outs with runners on base. However, that’s far easier said than done. It hints that there’s something more than pure luck operating behind the scenes.
Fluctuations in strand rate historically are fluky, but 120-year benchmarks are rarely set without at least some degree of intent. Pitchers naturally change their approaches when runners are on base, and it’s plausible a pitcher as deliriously dominant as Verlander can change his to a more effective end than others. A pitcher doesn’t raise his groundball rate by a full 10% in a given situation—or lower his zone rate by nearly as much—through pure coincidence. To see what he might be doing differently, I broke down Verlander’s pitch usage by situation:
| Situation | 4-Seam | Slider | Curve | Change |
|---|---|---|---|---|
| Bases Empty | 53.1% | 26.6% | 15.8% | 4.6% |
| Runner @ 1st | 45.7% | 28.6% | 21.9% | 3.8% |
| RISP | 44.5% | 35.9% | 17.8% | 1.8% |
As runners get on base and move closer to home, Verlander throws his fastball less than ever. The numbers dictate this is a smart move. Though his fastball is his calling card, the .343 wOBA posted against it in 2019 has made it easily his least effective pitch. It makes sense that when runners get on base, he ditches it in favor of his elite breaking balls, against which hitters have managed a sub-.200 wOBA. Call it the Lance McCullers effect.
Pitch-specific swing data demonstrates how Verlander has worked to the strengths of each offering to achieve the results best suited to where he has baserunners. Let’s look at that swing result chart again, broken down pitch by pitch, excluding the changeup due to sample size:
| Situation | Fastball | Slider | Curveball |
|---|---|---|---|
| Bases Empty | 51.1% | 63.8% | 34.3% |
| Runner @ 1st | 50.8% | 59.8% | 38.4% |
| RISP | 53.7% | 62.2% | 36.6% |
| Situation | Fastball | Slider | Curveball |
|---|---|---|---|
| Bases Empty | 59.0% | 44.9% | 49.7% |
| Runner @ 1st | 60.7% | 47.8% | 45.3% |
| RISP | 53.5% | 36.1% | 49.2% |
| Situation | Fastball | Slider | Curveball |
|---|---|---|---|
| Bases Empty | 15.1% | 42.7% | 53.7% |
| Runner @ 1st | 23.1% | 50.0% | 64.7% |
| RISP | 29.2% | 34.8% | 50.0% |
| Situation | Fastball | Slider | Curveball |
|---|---|---|---|
| Bases Empty | 30.7% | 40.4% | 28.3% |
| Runner @ 1st | 26.4% | 34.3% | 27.3% |
| RISP | 38.9% | 39.3% | 23.1% |
That’s a lot of information, but broken down correctly, the pieces fit together like a puzzle. Verlander’s swing rates are the master key that allows everything to fall into place. Even when broken down by individual pitches, hitters attack his pitches at roughly the same rate, no matter the situation. In theory, constant swing rates would allow Verlander to tinker with usage and location to achieve the results best suited to the given scenario.
Beginning with groundball rate, we start to get a picture of Verlander’s stratagem. We see that his curveball, in particular, generates a healthy number of ground balls on contact, with the slider doing its fair share as well. This explains the 8% increase in breaking balls with a runner on first and appears to be the catalyst for his overall groundball spike with runners on. Tellingly, with a runner on first and fewer than two outs—when a double play is most useful—that GB% spikes all the way up to a few hairs above league average at 45.5%, perfectly mirroring his ability to turn runners into force outs relative to the rest of baseball. A ball that doesn’t go straight is a marvelous thing.
The grounders tell part of the story, but it’s his zone and whiff rates that best illustrate how Verlander consciously changes his approach. We now know the 7% decrease in zone rate with RISP is coming entirely from his fastball and slider. We saw his slider rate with RISP increases to more than a third of his total pitches, at the expense of the fastball and curveball. Why might that be? His curveball is a good pitch but not an elite one. By linear weights, Verlander’s slider is second only to Scherzer on a per-100-pitch basis. Meanwhile, the curve sits just outside the top 20 among qualified pitchers. When he needs a swing and miss or weak contact at all costs, the numbers overwhelmingly indicate the slider is the pitch to turn to.
Knowing this, his changing zone and usage rates become quite logical: When it’s time to get down to business with RISP, he throws his best pitch a lot more and out of the strike zone, where hitters are far less likely to make contact with it. This also applies to his fastball. It’s been his worst pitch on the whole, but it still has got plenty of life. Even at age 36, Verlander very much still has that reserve of oomph in key moments: His average fastball velocity spikes from 94.4 mph with the bases empty to 95.5 mph with runners in scoring position. Put it in the zone slightly less, and it’s even harder to hit than usual. The hitter needs to make a decision between attacking the fastball or risk looking like a fool on a wipeout slider.
It hasn’t quite worked to perfection. As we saw at the beginning, Verlander still is striking out fewer hitters with runners on than with bases empty. But there’s a solution for that, too. Strikeouts aren’t the only way to get a near-guaranteed out. Looking at zone rates with RISP, it can’t be forgotten that contact on balls out of the zone is naturally weaker than those within it. Accordingly, his popup rate jumps from an even 10% with the bases empty to 15.9% with RISP, more than offsetting the decrease in strikeouts. Combined with more whiffs, the final product is a minuscule number of opportunities for the hitter to even give the runner a chance to score.
Against all popular wisdom, it seems Verlander has worked out a formula for stopping baserunners from moving any farther than they already have. A final look at heat maps from the catcher’s perspective for Verlander’s three primary pitches, courtesy of Baseball Savant, shows us just how incredibly precise his command is over these pitches, to the point that he can use those same pitches to induce drastically different results depending on the context. First, check out his fastball locations.
Bases Empty
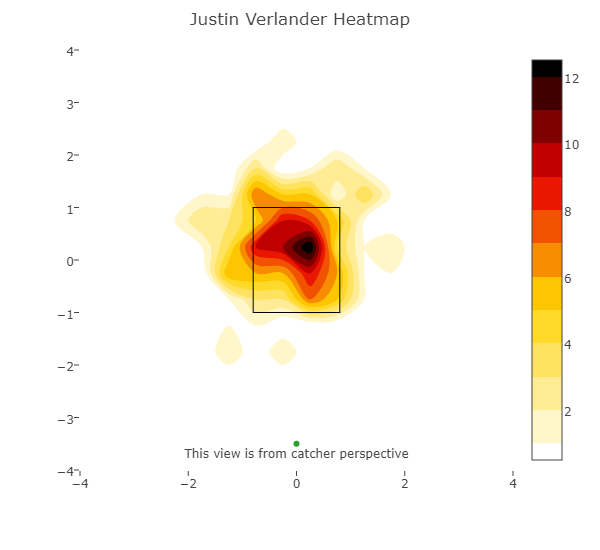
Runner on First
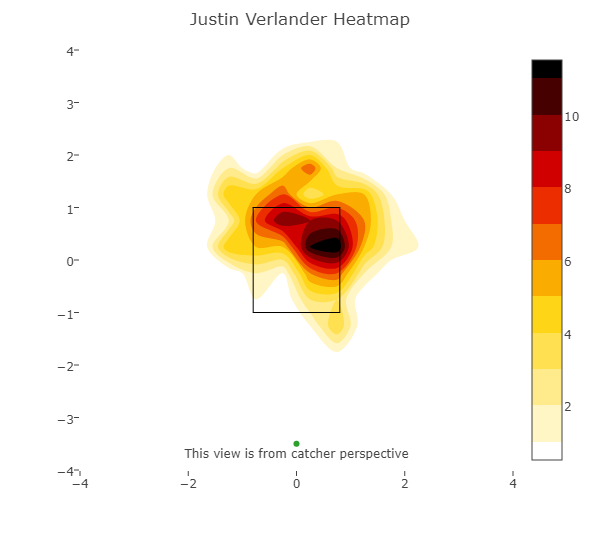
RISP
The story of how Houston re-launched Verlander’s rocket arm by revamping his fastball usage—give it to ‘em high and hard—is basically the book of Genesis in the bible of data-driven baseball. Now, he’s tweaked that formula with RISP to induce even more whiffs than usual. Throw it higher, throw it harder, and avoid the middle of the plate. But it’s his curveball location that shows us just how much Verlander has mastered his own repertoire.
Bases Empty
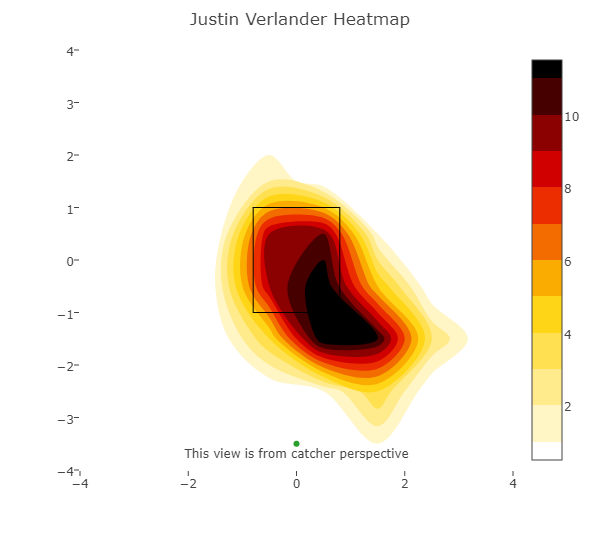
Runner on First
RISP
It’s considerably harder to command a breaking ball than a fastball, particularly a curve that moves as much as Verlander’s. But he does it as well as anybody else. While he generally hangs around the zone with the bases empty, the darkest parts of the middle heat map show that when a runner gets on first, he strongly favors two spots. He’ll throw it high in the zone, where a hitter isn’t likely to swing at a pitch dropping from the sky (returning to his Swing % chart, note that hitters offer at the curve less than any other pitch). Even more frequently, Verlander places it below the bottom of the zone, where most hitters will see a strike all the way up until they swing right over the top of the ball, driving it into the ground for an easy force out or double play. With RISP, when this is less to his advantage, he returns to the strike zone but handily avoids the middle of the plate, where hitters are apt to do the most damage upon contact.
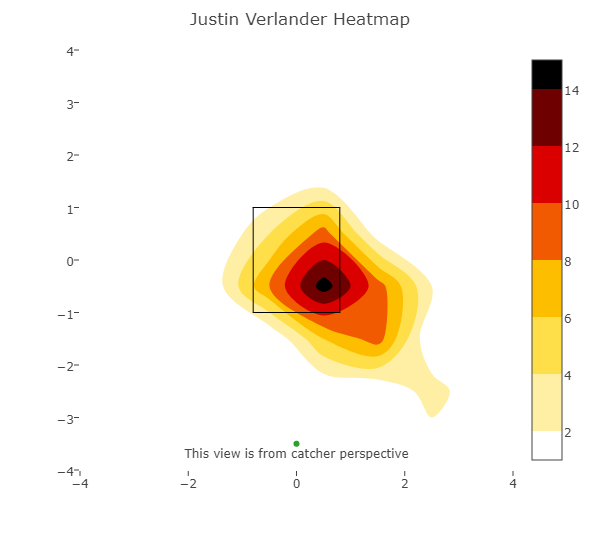
Finally, we have his inimitable slider.
Bases Empty
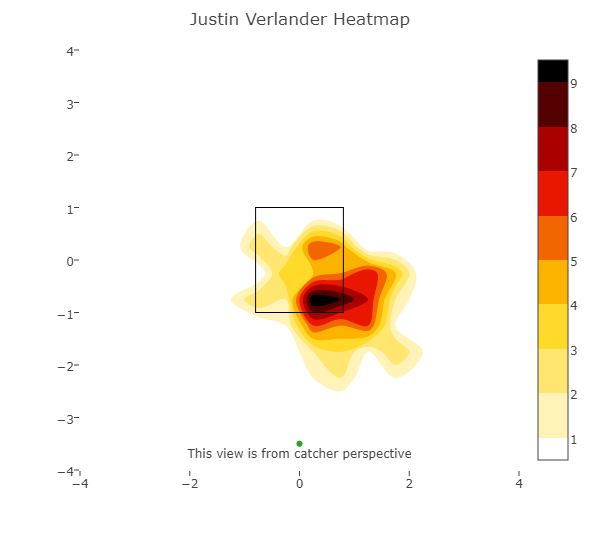
Runner on First
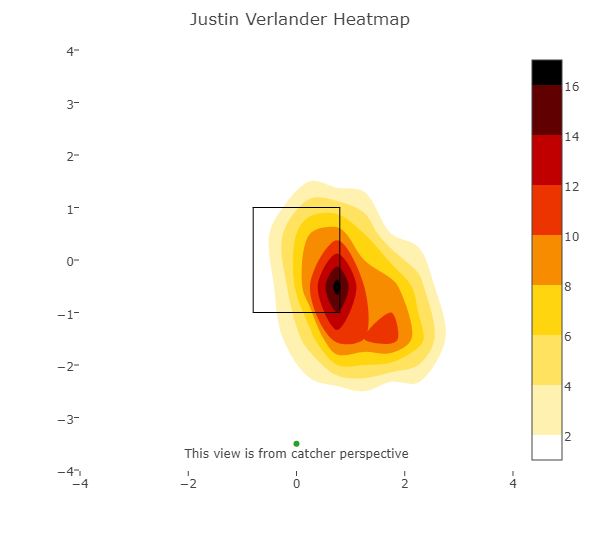
RISP
Though he consistently works the outer edge of the plate, Verlander throws his slider in the zone barely one-third of the time in situations where runners are liable to score on any kind of hit. In particular, he favors that sweet-spot location in which hitters see a low and juicy fastball for 55 feet before it darts away to a place where it’s almost impossible to adjust and square the ball up. In fact, the only time he consistently throws it near the zone is with a runner on first, where contact is still as likely as anything else to produce a ground ball. In terms of movement, it’s not actually much of an above-average pitch. But when you can paint corners like Picasso, it doesn’t have to be.
This is extraordinary needlework, and it helps us visualize just exactly how remarkable Verlander is. There are few pitchers in the world who have pure stuff as good as he does and even fewer who have good enough command of it to so dramatically change their batted-ball profile on a whim within the course of a single inning. Data have shown us an outlier in strand rate is rarely anything other than luck—John Candelaria had a long and fine career but was never even an All-Star after his record-setting 1977 season. But Justin Verlander is showing us definitively how a great pitcher can put himself squarely in control of something that we may once have thought to be simply out of our hands.
I am SO glad you wrote this. I had noticed Verlander’s odd splits this year, especially his GB% with a runner on first, and was wondering how much of this was by design vs luck. Those heat map splits are very telling.
I’m curious what the situational pitch results are for MLB overall, split by bases empty vs first base only vs RISP. I would think that most pitchers don’t have the upper hand in thwarting situational hitting, but it would be good to know as a reference points for what Verlander has accomplished this year.
That’s a great question to ask! Per Baseball Savant, the MLB average GB% with the bases empty/runner on first/RISP is 43.6%/44.4%/44.1%. A cursory look at other pitchers with generally low grounder rates and elite strikeout rates–Giolito, Boyd, Flaherty, Cole, Bauer, among others–also shows a fairly consistent distribution.
The Astros rightfully get a lot of credit as an organization for their data implementation strategies, but it’s a two way street, and I hope this does justice to how incredible Verlander is, too! Anybody who’s ever pitched can tell you how much of a difference there is between knowing these things and actually being able to execute them consistently.
Outstanding.
This is a fabulous breakdown. Lots of information, but easy to parse. Thank you!
This is the best analysis that I have seen to date that provides basis for the notion that Verlander is breaking the FIP / xFIP (and consequently, WAR) formulas this year.
Have you actually asked JV if he intentionally changes his strategy with men on base?
I’m sure that all pitchers (and hitters) vary their approach by situation. In fact, teams have been charting pitches for decades in order to inform these strategies. The only things that have changed are the improvements to analytic tools and the extent to which those are now publicly available.