
The Royals and “Anti-Three True Outcomes”
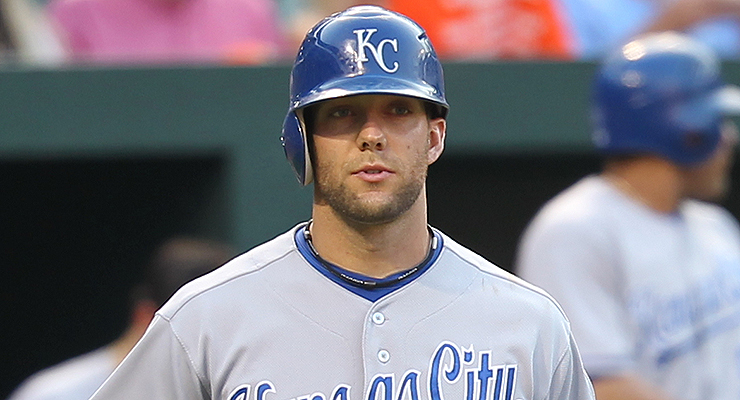
Alex Gordon aside, the Royals aren’t big fans of the three true outcomes (via Keith Allison).
Prior to the 2013 season, Dayton Moore pushed his powder blue chips in for a playoff run. The Royals had played to a .408 winning percentage since their last winning team (an 83-79 squad in 2003). They hadn’t won more than 75 games in any season from 2004 through 2012. Their No. 1-ranked farm system of the prior few years had begun funneling a ton of offensive talent to Kauffman Stadium, but injuries and subpar performances left them with few internal options for their pitching staff.
Thus, in December of 2012, Kansas City swapped top prospect Wil Myers along with Jake Odorizzi for (ostensibly) two years of nominal ace James Shields and “crossing fingers he can solidify the rotation” Wade Davis. With their competent and potent lineup including homegrown Salvador Perez, Eric Hosmer and Mike Moustakas, it seemed the Royals could contend for at least a Wild Card spot in 2013 and 2014.
The 2013 season didn’t quite pan out as they had hoped, but at 86-76 KC did achieve only its second winning season since 1993. Yordano Ventura debuted, and Royals fans could pin their hopes on the possible first successful home-grown ace pitcher since Zack Greinke.
Alas, the 2014 season has been more of the same. A recent ten-game winning streak (their longest since 1994) moved them into first place by 1 ½ games, but that only placed them at 39-32, and that burst was followed immediately by a four-game losing streak. Coming into Saturday’s contest, Kansas City’s 41-38 record (.519) was quite similar to last year’s .530 final tally.
Fans and media are noticing that, at least when it comes to offense, this year’s squad does a lot of things like last year’s group … or should I say they don’t do things. They don’t walk (their 193 free passes is last, not just in the league, but in the majors). They don’t hit homers (also last in the AL and all of MLB with 46, one behind the Cardinals). They finished 26th in walks and 28th in homers in 2013.
But I suggest this is only coming under increasing scrutiny because of the lofty expectations placed upon the club. For you see, the Royals never have really walked, or homered like their brethren. They also haven’t struck out as frequently as the competition. They are the “anti-Three True Outcomes.”
Back in February of 2012, I wrote on my blog about the concept of Three True Outcomes (TTO) for teams. I examined the walk, strikeout and homer rates for all teams from 1973 to 2011 and found the teams with the best and worst TTO rates in the DH era. I also charted the steady increase in TTO rate in the majors and tried to see if there was a correlation between team TTO rate and winning percentage (there wasn’t).
Before I share my updated research, with an emphasis on the Royals, a little KC history regarding the TTO categories:
Home Runs
Legendarily, Kansas City has never had a player with a 40-homer season and is the only current team that can make that claim. Steve Balboni’s 36 long balls in 1985 has stood up as the franchise’s leading total for 28 subsequent seasons. In fact, there have been only ten 30-homer seasons in Royals team history:
| Royals 30-homer Seasons |
|---|
| Player | HR | Year |
| Steve Balboni | 36 | 1985 |
| Gary Gaetti | 35 | 1995 |
| Dean Palmer | 34 | 1998 |
| Danny Tartabull | 34 | 1987 |
| John Mayberry | 34 | 1975 |
| Jermaine Dye | 33 | 2000 |
| Bo Jackson | 32 | 1989 |
| Danny Tartabull | 31 | 1991 |
| Chili Davis | 30 | 1997 |
| George Brett | 30 | 1985 |
They haven’t had a 30-homer hitter since Jermaine Dye launched 33 in 2000. If that seems like a long time, that’s because it is. With only one 30-homer season, Kansas City is five behind the next worst since 2000:
| Player-Seasons with 30+ Homers, 2000 to 2013 |
|---|
| Team | Player Seasons | Team | Player Seasons | Team | Player Seasons |
| Yankees | 26 | Braves | 14 | Orioles | 9 |
| White Sox | 25 | Rockies | 14 | Indians | 9 |
| Rangers | 22 | Angels | 14 | Tigers | 9 |
| Phillies | 20 | Reds | 13 | Dodgers | 8 |
| Cardinals | 20 | Astros | 13 | Padres | 8 |
| Brewers | 19 | Diamondbacks | 12 | Giants | 8 |
| Blue Jays | 19 | Mets | 12 | Mariners | 8 |
| Red Sox | 16 | Athletics | 12 | Rays | 7 |
| Marlins | 16 | Expos / Nationals | 11 | Twins | 6 |
| Cubs | 15 | Pirates | 10 | Royals | 1 |
Historically, the Royals have never been a homer-hitting team. Even in their World Series-winning year of 1985, they finished eighth out of 14 teams in the AL in homers. In fact, they’ve finished in the top half of the league in long balls only twice in their existence, and have finished in the bottom third every season since 2004:
| Royals Yearly AL Ranks in Homers |
|---|
| Year | HR Rank | Year | HR Rank | Year | HR Rank |
| 2014 | 15 | 1999 | 12 | 1984 | 12 |
| 2013 | 15 | 1998 | 12 | 1983 | 12 |
| 2012 | 13 | 1997 | 10 | 1982 | 10 |
| 2011 | 11 | 1996 | 13 | 1981 | 10 |
| 2010 | 12 | 1995 | 14 | 1980 | 9 |
| 2009 | 13 | 1994 | 13 | 1979 | 11 |
| 2008 | 13 | 1993 | 10 | 1978 | 11 |
| 2007 | 14 | 1992 | 14 | 1977 | 6 |
| 2006 | 14 | 1991 | 11 | 1976 | 11 |
| 2005 | 14 | 1990 | 13 | 1975 | 9 |
| 2004 | 11 | 1989 | 13 | 1974 | 12 |
| 2003 | 7 | 1988 | 12 | 1973 | 9 |
| 2002 | 12 | 1987 | 12 | 1972 | 10 |
| 2001 | 11 | 1986 | 12 | 1971 | 12 |
| 2000 | 13 | 1985 | 8 | 1970 | 12 |
| 1969 | 10 |
Bold: Finished in top half of league.
Walks
Unlike homers, the Royals have had players lead the league in walks in a season:
- Darrell Porter with 121 in 1979
- John Mayberry with 122 in 1973 and 119 in 1975
But still, this is more the exception than the rule. This year’s Royals even like to swing on 3-0:
A lot of it depends on the pitcher, but it could be the best pitch you’re going to get for the rest of the at-bat. It could be,” Royals manager Ned Yost said. “So we green-light our power hitters with one out, never with no outs, and only if it’s at a point in the game where it can give us the lead or add on.”
Through June 27, they’ve had 49 plate appearances decided on a 3-0 count. That’s the fifth-fewest in the big leagues. The A’s, by comparison, have 80 such plate appearances. And yet, the Royals lead the majors in most at-bats in those situations (10), meaning they’ve eschewed ten probable walks sometime before the end of the appearance in favor of putting a ball in play on the fourth pitch.
The result: one single, one double and eight outs. That’s a .200 average in those situations, which also pales compared to the majors’ overall .330-plus average in such situations. So most other teams are better at working the count, and when they do decide on those rare occasions to swing on 3-0, they’re being more productive.
From a long-term perspective, the Royals haven’t been “walkers” since 1981. They had finished in the top half of the American League six times in nine years ending in 1980. However, they’ve been 13th or worse (out of 14 or 15 teams) nine times since 2000.
| Royals Yearly AL Ranks in Walks |
|---|
| Year | BB Rank | Year | BB Rank | Year | BB Rank |
| 2014 | 15 | 1999 | 10 | 1984 | 14 |
| 2013 | 13 | 1998 | 12 | 1983 | 14 |
| 2012 | 14 | 1997 | 9 | 1982 | 13 |
| 2011 | 11 | 1996 | 12 | 1981 | 10 |
| 2010 | 9 | 1995 | 13 | 1980 | 6 |
| 2009 | 13 | 1994 | 12 | 1979 | 6 |
| 2008 | 14 | 1993 | 14 | 1978 | 10 |
| 2007 | 13 | 1992 | 13 | 1977 | 9 |
| 2006 | 10 | 1991 | 10 | 1976 | 8 |
| 2005 | 12 | 1990 | 10 | 1975 | 5 |
| 2004 | 13 | 1989 | 5 | 1974 | 3 |
| 2003 | 9 | 1988 | 9 | 1973 | 2 |
| 2002 | 8 | 1987 | 10 | 1972 | 1 |
| 2001 | 14 | 1986 | 13 | 1971 | 10 |
| 2000 | 14 | 1985 | 12 | 1970 | 8 |
| 1969 | 11 |
Bold: Finished in top half of league.
Strikeouts
As with walks, the Royals have had a couple of players lead the league in strikeouts in a season:
- Steve Balboni with 166 in 1985
- Bo Jackson with 172 in 1989
This is the one category of the three “true outcomes” where the Royals have actually been somewhat proficient from time to time. They finished in the top half of the league seven times in 11 years ending in 1997 and four times in six seasons ending in 2009. But take a look at their ranks from 2010 onward. The current Royals don’t work the count (as witnessed by the lack of walks), and they don’t walk back to the bench very often as victims of a punchout:
| Royals Yearly AL Ranks in Strikeouts |
|---|
| Year | K Rank | Year | K Rank | Year | K Rank |
| 2014 | 15 | 1999 | 11 | 1984 | 8 |
| 2013 | 15 | 1998 | 11 | 1983 | 11 |
| 2012 | 14 | 1997 | 7 | 1982 | 8 |
| 2011 | 12 | 1996 | 10 | 1981 | 12 |
| 2010 | 14 | 1995 | 10 | 1980 | 10 |
| 2009 | 7 | 1994 | 5 | 1979 | 10 |
| 2008 | 9 | 1993 | 4 | 1978 | 13 |
| 2007 | 6 | 1992 | 14 | 1977 | 12 |
| 2006 | 8 | 1991 | 6 | 1976 | 10 |
| 2005 | 5 | 1990 | 9 | 1975 | 11 |
| 2004 | 7 | 1989 | 7 | 1974 | 9 |
| 2003 | 10 | 1988 | 2 | 1973 | 11 |
| 2002 | 13 | 1987 | 4 | 1972 | 11 |
| 2001 | 14 | 1986 | 8 | 1971 | 11 |
| 2000 | 14 | 1985 | 7 | 1970 | 4 |
| 1969 | 8 |
Now that we’re teased the original research on team TTO and given you the Royals history in these categories, let’s put them together.
Here is MLB’s TTO rate in the DH era:
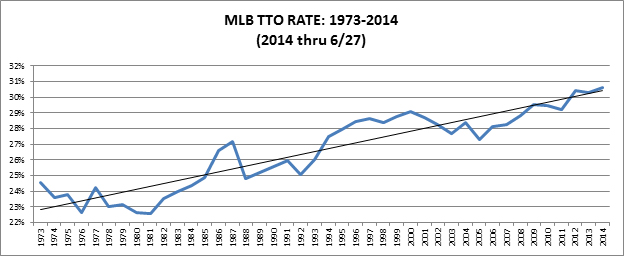
From approximately 1980 onward, there has been a pretty steady increase. The spike in 1987 was the result of the home run explosion that year. (Many people speculated the ball was juiced that season.) The “steroid years” provided another, longer spike in the TTO rate, and once that era ended, a more “normal”–but still observable–trend line continued. Through June 27th, this year’s rate is an all-time high of 30.6 percent.
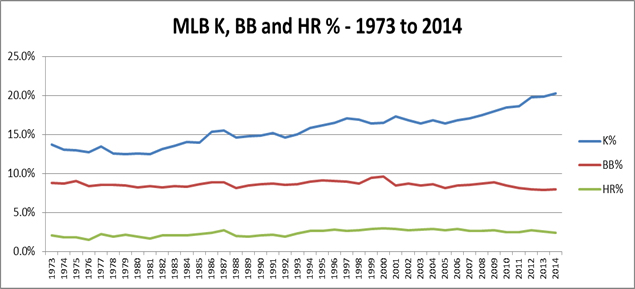
In case you were wondering, its strikeouts, not homers or walks, that are driving the consistent increase in TTO percentage. In fact, within the past decade or so, the rate of walks and homers both have declined slightly. Conversely, this season is the first to have a K% above 20 percent. Here is the breakout of homers, walks and strikeouts as a percentage of all plate appearances by season in the DH era:
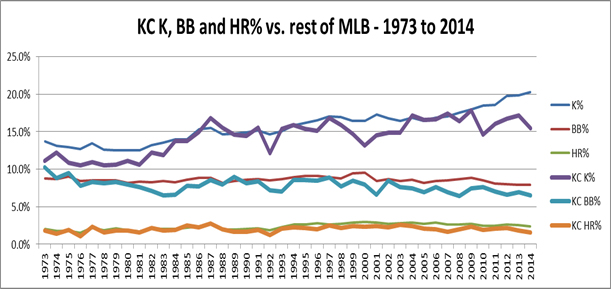
As I alluded to earlier, the Royals almost always have lagged behind the rest of the league in these three categories. The chart below shows the increased lag within the past 15 years, and especially since 2010:
Putting the categories together, we see that the Royals have been the “anti-TTO” for most of their existence:
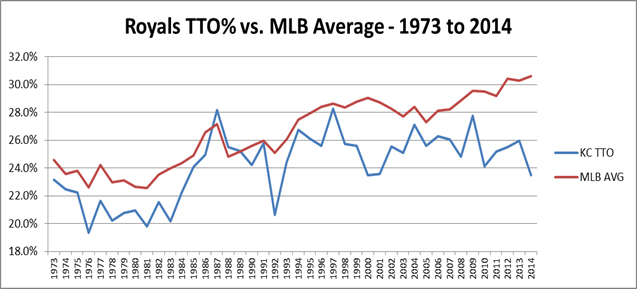
Their current 23.5 percent TTO would be the lowest single-season mark since the 2008 Mariners (23.2 percent). But since overall TTO rate has increased since then, the current Royals are lagging behind league average at a more severe rate. If the season ended now, their -23.3 percent variance from league TTO rate would set a record in the DH era, by nearly three percent. This would give them seven of the 17 biggest negative variances overall:
| Biggest Differences Between Team And MLB TTO Rates, 1973-2014 |
|---|
| Year | Team | Team TTO | MLB TTO | Diff |
| 2014 | KCR | 23.5% | 30.6% | -23.3% |
| 2002 | ANA | 22.4% | 28.2% | -20.6% |
| 1975 | STL | 18.9% | 23.8% | -20.6% |
| 2007 | SEA | 22.6% | 28.2% | -19.9% |
| 2008 | SEA | 23.2% | 28.8% | -19.6% |
| 2000 | KCR | 23.5% | 29.1% | -19.2% |
| 1984 | MIL | 19.8% | 24.3% | -18.5% |
| 1999 | CHW | 23.5% | 28.8% | -18.3% |
| 2010 | KCR | 24.1% | 29.5% | -18.2% |
| 2001 | KCR | 23.6% | 28.7% | -17.9% |
| 1992 | KCR | 20.6% | 25.1% | -17.7% |
| 1981 | TEX | 18.6% | 22.6% | -17.4% |
| 1990 | MIN | 21.3% | 25.6% | -16.9% |
| 1978 | CHW | 19.1% | 23.0% | -16.7% |
| 1980 | TEX | 18.9% | 22.6% | -16.6% |
| 2012 | KCR | 25.5% | 30.4% | -16.3% |
| 1983 | KCR | 20.2% | 24.0% | -15.9% |
Admittedly, the Royals TTO percentage has very little to do with their postseason chances. But while there may not be a correlation between TTO rate and winning percentage, examining only the homer and walk components leads to some interesting thoughts.
There is a definite trend line/correlation between a team’s homer and walk percentages and its overall winning percentage:
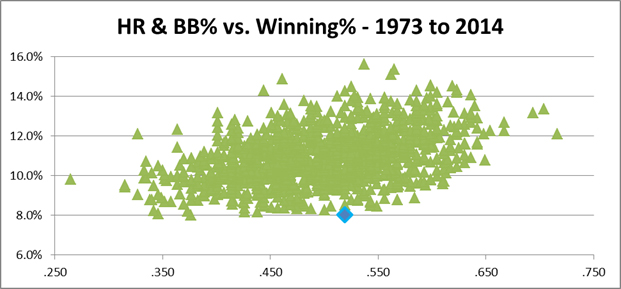
That blue diamond on the 8.0% line is the 2014 Royals. You’ll notice that it’s right there with the lowest total of any team over the past 40-plus years. You’ll also notice that few, if any, teams have been able to win even at a .550 clip without having a nine-percent homer-plus-walk rate. These Royals need only look at similarly walk and homer-challenged teams to realize their chances of a winning season are poor:
| Lowest HR+BB%, 1973-2014 |
|---|
| Year | Team | HR% | BB% | HR+BB% | Win% |
| 1981 | MIN | 1.2% | 6.8% | 8.0% | .376 |
| 2014 | KCR | 1.5% | 6.5% | 8.0% | .519 |
| 2011 | HOU | 1.5% | 6.5% | 8.1% | .346 |
| 1980 | CHW | 1.5% | 6.7% | 8.2% | .438 |
| 1998 | PIT | 1.8% | 6.4% | 8.2% | .426 |
| 1981 | SDP | 0.8% | 7.4% | 8.2% | .373 |
| 2002 | DET | 2.1% | 6.1% | 8.2% | .342 |
| 1982 | SDP | 1.3% | 7.0% | 8.3% | .500 |
| 1983 | KCR | 1.8% | 6.5% | 8.3% | .488 |
| 1988 | CHC | 1.8% | 6.5% | 8.3% | .475 |
| 1978 | HOU | 1.2% | 7.2% | 8.4% | .457 |
| 1978 | STL | 1.3% | 7.0% | 8.4% | .426 |
| 2008 | KCR | 2.0% | 6.4% | 8.4% | .463 |
| 1981 | PIT | 1.4% | 7.0% | 8.4% | .451 |
However, if anyone squawks that these Royals don’t hit homers or walk, you can point out this is just their modus operandi. The park dimensions don’t matter. The personnel doesn’t matter. Even changing hitting coaches makes little difference. The Royals always have, and it seems they always will, avoid TTOs.
When compared to the league average, the Royals’ strikeout rate this year is one of the lowest since 1969, the year the Royals began play. The Royals emphasize contact at the expense of everything else. Not a good strategy.
A very good point! While K’ing 30% or more isn’t advisable, neither is the other extreme.
Great Article! I hate the Royals (as a Twins fan), but I’m glad I stuck with the article as the tables on the bottom are absolute gems! Love it that the 1981 Twins were the all time examples in the DH era of suckitude in TTO. We all knew they were – now its just confirmed. Odd that some of those Twins teams in the mid-late ’90’s aren’t also there…
Thanks Chris!
I enjoyed this article. As a fan of the Orioles, I would be delighted to see where they compare historically on TTO.
Also, I am curious whether you have seen any correlation between increased payroll and increased TTO – I would bet this us true in general, but imagine that the true TTO sluggers (Adam Dunn, Mark Reynolds types) historically aren’t signed by the teams with the highest payrolls. Teams with highest payrolls choose more balanced sluggers. OTH, many sluggers become more TTO as they age – and until recently, most salaries are allocated to players 30+. Food for thought.
Interesting thought! I may have to tackle that one on a more individualized basis.
Is there an easy way to create a list of players with the most 30+ HR seasons 2000-2013?
Pujols has 12. He only missed in 2000 (rookie in 2001) and 2013 (injury), and he is on pace to hit 30+ this year.
This would be a job for the baseball-reference (subscription required)
(That should have said Play Index)
http://www.baseball-reference.com/play-index/
I wonder if it’s ever dawned on the Royals that the only year in which they won a championship, they had two players who hit 30 or more home runs, plus Frank White, who hit a career-high 22 in what was a Ruthian effort by Royals standards, and 154 homers as a team? Taking a walk was still a problem for them, but you can still score enough runs to win without walking much if you can reach the fences. Just ask the ’61 Yankees.
There’s really no reason for this. Kauffman Stadium is a tough home run park, but there are tougher ones, and real power hitters like Balboni, Tartabull and Bo Jackson still got the ball into the fences there.
Great review, Diane! Be interesting to see where the Royals rank in GiDP. Making contact into 2 outs is never a good thing!
Mike …. thanks for the kind words.
As for GIDPs, Baseball Reference to the rescue
http://bbref.com/pi/shareit/BFtOK