THT Daily: Ooh and Ouch
Player News
Yesterday’s Results
Today’s Games
Standings
Yesterday’s Home Runs
Top Minor League Performances
You can always find the most recent THT Daily at http://www.hardballtimes.com/main/content/thtdaily/ and an archive at http://www.hardballtimes.com/main/thtdaily_index/
Player News
Player Headlines are courtesy of Rotoworld
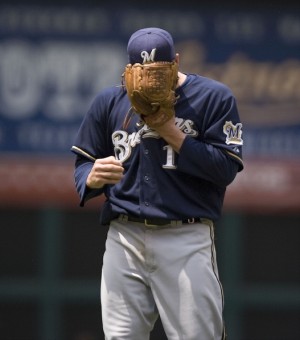 |
| Ben Sheets yells in his mitt earlier in the year, after allowing a home run. Yesterday’s performance was a little more upbeat. (Icon/SMI) |
Felix Hernandez said after Monday’s game that he expects to make his next start despite a sprained ankle. X-rays on the ankle came back negative. King Felix allowed one run in 4 2/3 innings and hit a grand slam before coming out of Monday’s game against the Mets. That was the first grand slam by an American League pitcher in 37 years.
Ben Sheets limited the Braves to one run en route to a dominant complete game victory over the Braves on Monday night. Sheets allowed just four hits, striking out seven without issuing a walk. The Brewers didn’t even have to warm up a reliever as Sheets improved to 9-1. He needed just 106 pitches to finish his third complete game of the season, and his ERA now sits at 2.59.
Nick Johnson, who has been slow to heal since getting hurt last month, will undergo a diagnostic arthroscopy to evaluate ligaments in his wrist. He could still make it back this season, but it’s not something anyone should be counting on. Johnson was originally diagnosed with a torn tendon sheath last month, but it seems his injury may be more complicated than that. Dmitri Young could be the Nationals’ primary first baseman the rest of the way.
Yesterday’s Results
Game recaps are provided by Craig Calcaterra.
If elected, I promise to pass legislation mandating a full slate of 15 games each and every weeknight between April and October. If that creates a hardship, we will re-institute the WPA, focusing on the development of innings-eating pitchers. The business of this country is baseball, and I promise that once I’m in charge, there will be no slow, sad, pathetic nights in which only a third of the teams play.
Brewers 4, Braves 1: Ben Sheets (CG, 4 H, 1 ER, 7K, 0 BB) put the Braves down quickly, quietly, and humanely. They didn’t suffer. We’ll tell the kids that they went to go live on a farm upstate. They’ll be happier there, we’ll tell them. Really, it was for the best.
Mariners 5, Mets 2: King Felix hits a grand slam off of Johan Santana. It was the first salami by an AL pitcher since before I was born, and it wouldn’t have happened if David Wright hadn’t made an error with two out in the second. Hernandez later had to leave the game with a sprained ankle suffered while covering home. The lesson here: sometimes it really is better to half-ass your job.
Diamondbacks 2, Red Sox 1: Danny Haren (7 IP, 2 H, 0 ER, ugly neckbeard) outpaces Josh Beckett (8 IP, 5 H, 2 ER, ugly necklace). Overheard during broadcast: Steve Phillips, describing baseball’s state of parity by explaining that there are two or three really good teams but the rest aren’t very good at all. That, actually, would be the opposite of parity.
Angels 3, Nationals 2: Sure, the save is a somewhat overrated and often misinterpreted statistic, but K-Rod does have 31 of them through 77 games, and that’s unprecedented. He plays by the same rules as every other closer, so no matter what you think of the save, you gotta give the fellow a hand.
Royals 8, Rockies 4: Brian Bannister started. He threw 113 pitches, but only 66 of them were strikes and he walked six guys. In other words, it was very un-Bannylike. The immediate implication: probably about 46 Posterisks in today’s Banny Log as Joe P. vamps, trying desperately to figure out how to get out of writing 17 or 18 more of them this year.
You can download a compact version of yesterday’s boxscores from Heater Magazine.
| First Inning’s Major and Minor League Daily Reports: |
| {embed=”pageblocks/FirstInning_Team_Lookup”} |
Today’s Games
National League
 ---------------
 Milwaukee Brewers at Atlanta Braves, 7:10 PM
  (R) Dave Bush (3-7) vs. (R) Charlie Morton (1-0)

 Inter-League
 ------------
 New York Yankees at Pittsburgh Pirates, 7:05 PM
  (R) Darrell Rasner (4-4) vs. (L) Tom Gorzelanny (5-6)
 St. Louis Cardinals at Detroit Tigers, 7:05 PM
  (R) Braden Looper (8-5) vs. (L) Kenny Rogers (5-4)
 Arizona Diamondbacks at Boston Red Sox, 7:05 PM
  (L) Doug Davis (2-3) vs. (R) Justin Masterson (4-1)
 San Francisco Giants at Cleveland Indians, 7:05 PM
  (L) Jonathan Sanchez (6-4) vs. (L) Aaron Laffey (4-4)
 Cincinnati Reds at Toronto Blue Jays, 7:07 PM
  (R) Bronson Arroyo (4-6) vs. (R) A.J. Burnett (6-7)
 LA Angels of Anaheim at Washington Nationals, 7:10 PM
  (R) Jon Garland (6-4) vs. (R) Shawn Hill (1-4)
 Tampa Bay Rays at Florida Marlins, 7:10 PM
  (R) Andy Sonnanstine (8-3) vs. (L) Scott Olsen (4-4)
 Seattle Mariners at New York Mets, 7:10 PM
  (R) R.A. Dickey (1-3) vs. (L) Oliver Perez (5-4)
 Baltimore Orioles at Chicago Cubs, 8:05 PM
  (R) Jeremy Guthrie (3-7) vs. (L) Sean Marshall (0-0)
 Texas Rangers at Houston Astros, 8:05 PM
  (R) Eric Hurley (0-0) vs. (R) Brian Moehler (3-3)
 Colorado Rockies at Kansas City Royals, 8:10 PM
  (L) Jorge De La Rosa (2-3) vs. (R) Zack Greinke (6-4)
 Philadelphia Phillies at Oakland Athletics, 10:05 PM
  (L) Jamie Moyer (7-4) vs. (R) Joe Blanton (3-10)
 Minnesota Twins at San Diego Padres, 10:05 PM
  (R) Kevin Slowey (4-6) vs. (R) Jake Peavy (5-4)
 Chicago White Sox at Los Angeles Dodgers, 10:10 PM
  (L) Mark Buehrle (4-6) vs. (R) Derek Lowe (5-6)
Standings
The graphics next to each team are called “sparklines.” They depict each team’s performance over the last month. Each “up” bar is a victory and a “down” bar is a loss. There are horizontal lines for home games and red bars represent games decided by two runs or less. “PWins” is short for Projected Wins, based on each team’s Run Differential, and is often a better measure of a team’s true strength. Other team graphs and stats can be found on our Team Page.
American League East Pwins Diff BOS 47 32 .595 0.0 46 1TB 44 31 .587 1.0 41 3
NYA 41 35 .539 4.5 40 1
BAL 38 36 .514 6.5 36 2
TOR 36 41 .468 10.0 40 -4
American League Central CHA 41 34 .547 0.0 45 -4
MIN 40 36 .526 1.5 38 2
DET 36 39 .480 5.0 37 -1
CLE 35 41 .461 6.5 40 -5
KC 34 43 .442 8.0 33 1
American League West LAA 47 30 .610 0.0 40 7
OAK 41 34 .547 5.0 44 -3
TEX 39 38 .506 8.0 38 1
SEA 27 49 .355 19.5 30 -3
National League East Pwins Diff PHI 42 35 .545 0.0 46 -4
FLA 40 35 .533 1.0 38 2
NYN 37 38 .493 4.0 38 -1
ATL 38 40 .487 4.5 43 -5
WAS 30 48 .385 12.5 28 2
National League Central CHN 48 28 .632 0.0 49 -1
STL 44 33 .571 4.5 41 3
MIL 42 34 .553 6.0 38 4
PIT 36 40 .474 12.0 34 2
HOU 35 41 .461 13.0 34 1
CIN 35 42 .455 13.5 34 1
National League West ARI 40 37 .519 0.0 40 0
LAN 35 40 .467 4.0 37 -2
SF 32 44 .421 7.5 33 -1
COL 32 45 .416 8.0 32 0
SD 32 45 .416 8.0 31 1

Yesterday’s Home Runs
The following stats are provided by Hit Tracker, which logs the projected “true” distance of each home run (if it were to land uninterrupted at field level) and its “standard” distance, which is corrected for weather conditions. Each homer is also categorized into one of three types: Just Enough (JE) for homers that cleared the fence by ten feet or less, Plenty (PL) for those that were sure home runs but not “blasts,” and No Doubt (ND) for true “blasts”—homers that cleared the fence by at least 20 feet and landed at least 50 feet beyond the fence.
Hitter                Team    Pitcher              Team   True  Stnd.   # Type
Mike Cameron          MIL     Jo-Jo Reyes          ATL     380    381  12  JE
Ross Gload            KC      Luis Vizcaino        COL     379    373   1  PL
Jose Guillen          KC      Jeff Francis         COL     402    398  14  PL
Willie Harris         WAS     John Lackey          LAA     379    383   4  JE
Felix Hernandez       SEA     Johan Santana        NYM     391    393   1  PL
Matt Holliday         COL     Brian Bannister      KC      431    429   9  PL
Mark Teahen           KC      Jeff Francis         COL     408    401   7  JE
Top Minor League Games
The following list, provided by First Inning, includes the top minor league batting (based on Runs Created) and pitching (based on Game Score) performances from yesterday, with a focus on each team’s top prospects.
ORG LVL PLAYER            AB  H 2B 3B HR BB SO  Notes
STL AAA Colby Rasmus...... 3  2  1  0  1  1  1
OAK AAA Richie Robnett.... 4  4  1  0  1  0  0  3 R
WAN AA  Luke Montz........ 3  2  1  0  1  2  0
ATL AAA Scott Thorman..... 4  2  0  0  2  0  0
CLE AAA Asdrubal Cabrera.. 4  3  0  0  1  1  0
KC  AA  Kila Kaaihue...... 3  3  0  0  1  1  0
LAA AAA Brandon Wood...... 5  3  0  1  1  0  1  3 R
MIN A   Joe Benson........ 5  3  2  0  0  0  0
FLA A   Michael Stanton... 4  2  1  0  1  1  0
ARI AAA Emilio Bonifacio.. 3  2  2  0  0  1  0
OAK AA  Aaron Cunningham.. 4  2  1  0  1  0  1
CHC A   Josh Donaldson.... 3  2  1  0  1  0  1

ORG LVL PLAYER            IP  H  R ER SO BB HR  Notes
SD  AA  William Inman..... 7  3  2  2 11  1  1
KC  A   Daniel Duffy...... 7  4  0  0  8  0  0
PHI AAA J.A. Happ......... 6  1  0  0  9  2  0
PHI A+  Edgar Garcia...... 7  5  2  2  8  1  1
TB  A   Alexander Cobb.... 6  3  1  1  7  2  0
NYM A+  Dylan Owen........ 5  6  1  1  7  0  0
TEX AA  Thomas Diamond.... 6  4  2  2  4  1  0
ARI A   Jarrod Parker..... 4  4  1  1  7  2  0
LAA A   Jordan Walden..... 5  3  0  0  4  1  0  10 GB
NYY AAA Kei Igawa......... 7  7  0  0  5  2  0
NYY A+  Z. McAllister..... 6  1  2  1  3  1  1
FLA A   Kyle Kaminska..... 6  8  1  1  5  0  1
Access THT’s stats here…