Why the Pyramid Rating System Changed to a Grading System

No matter the valuation system, Mike Trout is still an all-time baseball great. (via Keith Allison)
Very few in the sabermetric community, if anyone, view WAR as an absolute value. However, the myth that WAR is an absolute value has been one of the toughest things to dispel among the non-sabermetric group. And while my overall sentiment is very much in the sabermetric crowd, I can sympathize with the people who don’t fully understand how the stat works and therefore question a lot of WAR’s validity. How does someone with 6.0 WAR compare to someone with 4.0 WAR? How does that comparison differ from that of a 4-WAR player to a 2-WAR player? What about negative WAR players: How is it even possible for a player to subtract wins from a team?
While a sabermetrician could rattle off answers to all of these questions, explaining how it all works to someone who doesn’t understand WAR can be problematic, if not impossible. To do that, you have to get into the math behind WAR, math that is difficult to understand even for people in the sabermetric community.
Complicating the situation is the need to treat these estimated values as absolutes at some point to make calculations and draw conclusions. In a lot of cases, having to do this can contradict the idea behind WAR and lead to outcomes that aren’t as conclusive as one might think — or just flat out inaccurate.
The original concept behind the Pyramid Rating System went to great lengths to ensure that players across major league history were treated fairly by strictly limiting comparisons to counterparts while ensuring each era is represented proportionally among the all-time greats. But one thing the original Pyramid Rating System did not do was make it any easier to discern what the real difference was between a 5.0 WAR player and a 4.7 WAR player. Instead, it merely shifted the debate between differing between a 5.0 WAR player and a 4.7 player to one that tried to understand the difference between a 62-grade player and a 57-grade one.
Because the system had no way of discerning the real difference between a great season and a good one, this would occasionally lead to issues in the ranking process where Player A was interpreted as having a better season than Player B even though the two seasons were almost equal. That’s because the math behind the ranking process treated the values as absolutes, which in turned contradicted the idea of both WAR and the Pyramid Rating System that viewed the numbers as estimated values and not hard facts.
Switching over to a grading system not only takes into account this estimated value quirk, but it also puts in far better perspective the difference between WAR for players.
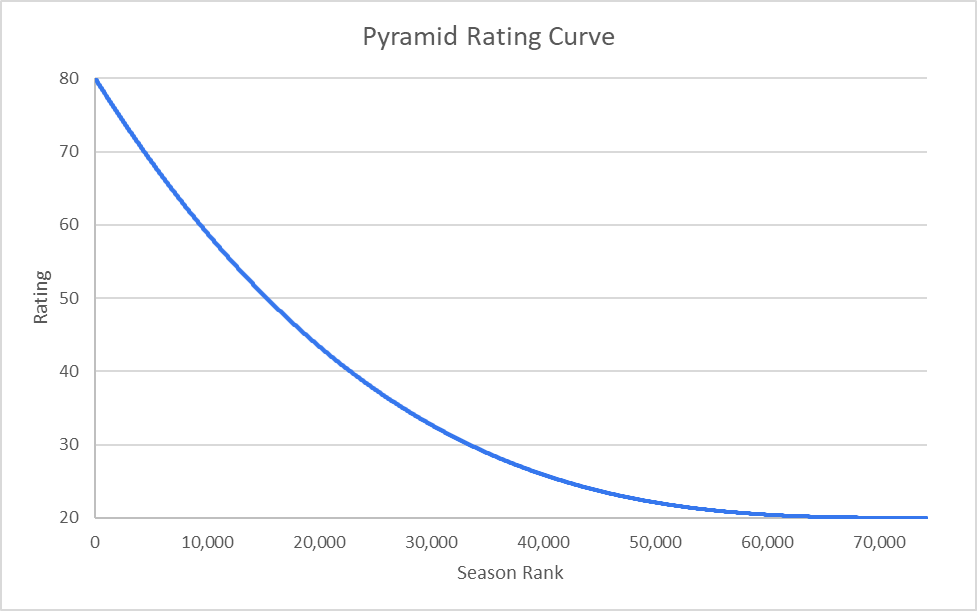
The old system, as seen above, ranked every season 1-70,000+ and plotted them along a curve. The new model keeps this approach, but rather than giving a hard ranking for players, it places them into grading buckets.
| Grade | # of Seasons | % of Seasons | Rating Range |
|---|---|---|---|
| A++ | 208> | .28% | 80 |
| A+ | 1,740 | 2.34% | 75-79 |
| A | 1,875 | 2.53% | 71-75 |
| A- | 2,040 | 2.75% | 67-71 |
| B+ | 2,239 | 3.02% | 62-67 |
| B | 2,493 | 3.36% | 58-62 |
| B- | 2,826 | 3.81% | 53-58 |
| C+ | 3,287 | 4.43% | 48-53 |
| C | 3,972 | 5.35% | 43-48 |
| C- | 5,125 | 6.90% | 37-43 |
| D+ | 7,612 | 10.25% | 30-37 |
| D | 25,772 | 34.72% | 21-30 |
| F | 15,049 | 20.27% | 20 |
| Total | 74,238 | ||
The idea behind this is twofold. One is to give people a better understanding of how different WAR seasons compare against each other.
| 2018 Batting Averages | 2018 Pitching Averages | |||||||
|---|---|---|---|---|---|---|---|---|
| Grade | Notable 2018 Example | WAR | G | PA | Notable 2018 Example | WAR | G | IP |
| A++ | Mike Trout | 10.1 | 138 | 611 | Jacob deGrom | 7.2 | 32 | 217 |
| A+ | Christian Yelich | 6.3 | 154 | 669 | Justin Verlander | 5.6 | 34 | 214 |
| A | Matt Carpenter | 5.1 | 149 | 648 | Zack Greinke | 3.7 | 33 | 208 |
| A- | Brandon Nimmo | 4.2 | 146 | 602 | Cole Hamels | 2.9 | 32 | 191 |
| B+ | Ozzie Albies | 3.7 | 141 | 588 | Jon Lester | 2.3 | 32 | 182 |
| B | Joey Votto | 3.2 | 144 | 568 | Clayton Kershaw | 1.8 | 27 | 159 |
| B- | Nick Markakis | 2.3 | 136 | 562 | Aníbal Sánchez | 2.1 | 25 | 137 |
| C+ | Matt Duffy | 2.2 | 131 | 507 | CC Sabathia | 1.4 | 29 | 153 |
| C | Yoan Moncada | 1.9 | 126 | 492 | Madison Bumgarner | 1.4 | 21 | 130 |
| C- | Brian Dozier | 1.5 | 117 | 445 | Joakim Soria | .9 | 66 | 61 |
| D+ | Jon Jay | 1.0 | 117 | 422 | Brad Ziegler | .9 | 82 | 74 |
| D | Ian Desmond | .3 | 78 | 254 | Félix Hernández | .4 | 29 | 156 |
| F | Chris Davis | -.3 | 50 | 137 | Adam Wainwright | -.1 | 8 | 40 |
| Inc. | David Wright | -.1 | 11 | 21 | Ervin Santana | -.1 | 5 | 25 |
As you can see from the chart above, the relationship between WAR and the letter grade is very correlated, with A++ seasons standing up far above the rest for both pitchers and hitters, and a steady decline in WAR for all grades A and below. (It’s worth noting with pitching that relievers are in the same grade as starters, which explains why WAR is more depressed for pitchers relative to hitters for grades A and lower.)
But in terms of ease of explanation, it’s easy to imagine an A++ player being the equivalent of a class valedictorian or an MVP Cy Young Award winner. The rest of the starters typically fall somewhere in the D+ to A+ range, while the ranks with grades of D, F, and incomplete are made up mostly of bench-warmers, middle relievers, and severely underperforming starters.
The second reason behind this change is to look at WAR and stats in general as a sample size with a margin for error, rather than a 100% accurate assessment of talent. Though the grading system on the surface seems to be more limiting in what it can account for, it still leaves room for players to fall into one of 14 talent categories. Even when looking at the game’s all-time best, no two players have the same grading breakdown.
| # of Seasons | ||||||||||||||
|---|---|---|---|---|---|---|---|---|---|---|---|---|---|---|
| Name | Rank | A++ | A+ | A | A- | B+ | B | B- | C+ | C | C- | D+ | D | F |
| Babe Ruth | 1 | 10 | 3 | 4 | 1 | 1 | 2 | 1 | 1 | |||||
| Barry Bonds | 2 | 8 | 8 | 1 | 1 | 1 | 2 | 1 | ||||||
| Willie Mays | 3 | 8 | 6 | 1 | 1 | 1 | 1 | 1 | 1 | 1 | 1 | |||
| Ty Cobb | 4 | 5 | 7 | 6 | 1 | 2 | 1 | 1 | ||||||
| Tris Speaker | 5 | 3 | 11 | 2 | 2 | 1 | 2 | |||||||
| Walter Johnson | 6 | 5 | 5 | 1 | 1 | 3 | 3 | 2 | 1 | |||||
| Lefty Grove | 7 | 5 | 5 | 2 | 1 | 1 | 1 | 1 | 1 | |||||
| Ted Williams | 8 | 4 | 8 | 1 | 1 | 2 | 1 | 1 | ||||||
| Honus Wagner | 9 | 3 | 11 | 1 | 1 | 1 | 1 | 1 | 2 | |||||
| Rogers Hornsby | 10 | 4 | 7 | 1 | 2 | 1 | 1 | 2 | 2 | |||||
| Roger Clemens | 11 | 3 | 9 | 2 | 1 | 1 | 1 | 3 | 1 | 1 | 2 | |||
| Alex Rodriguez | 12 | 4 | 6 | 1 | 1 | 4 | 1 | 1 | 1 | 3 | ||||
| Mickey Mantle | 13 | 4 | 4 | 3 | 1 | 1 | 1 | 2 | 1 | 1 | ||||
| Mike Trout | 14 | 5 | 2 | 1 | ||||||||||
| Mike Schmidt | 15 | 2 | 11 | 1 | 2 | 1 | ||||||||
| Lou Gehrig | 16 | 2 | 10 | 1 | 1 | |||||||||
| Hank Aaron | 17 | 14 | 2 | 1 | 2 | 1 | 1 | 2 | ||||||
| Stan Musial | 18 | 3 | 6 | 5 | 1 | 1 | 1 | 1 | 1 | 1 | 1 | |||
| Albert Pujols | 19 | 3 | 6 | 3 | 1 | 1 | 1 | 1 | 2 | |||||
| Cy Young | 20 | 1 | 10 | 5 | 1 | 1 | 1 | 1 | 2 | |||||
| Eddie Collins | 21 | 2 | 7 | 3 | 2 | 2 | 2 | 1 | 1 | |||||
| Greg Maddux | 22 | 2 | 6 | 3 | 2 | 1 | 3 | 2 | 1 | 1 | 1 | 1 | ||
| Rickey Henderson | 23 | 2 | 6 | 3 | 3 | 1 | 1 | 1 | 1 | 2 | 1 | 4 | ||
| Roger Connor | 24 | 2 | 6 | 2 | 1 | 2 | 1 | 2 | 1 | 1 | ||||
| Robin Roberts | 25 | 4 | 3 | 1 | 4 | 1 | 2 | 2 | 1 | 1 | ||||
We can also see the magnitude with which the Pyramid Rating System treats an A++ season, with Mike Trout already rating as the 14th best player in major league history on the strength of five A++ seasons. Only six players have as many, and all are in the top 10 all time according to the Pyramid Rating System. It’s also worth noting Babe Ruth having 23 graded seasons listed despite playing only 22 seasons in the majors. That’s because Ruth’s 1918 and 1919 seasons are graded separately as both batting and pitching seasons. This change was made to account for the arrival of Shohei Ohtani.
But even without getting into how Barry Bonds’ 2002 season compares against Ruth’s 1927 season, or how Rogers Horsnby’s 1924 season matches up against Ted Williams’ 1941 season, we still can make very definitive and accurate conclusions about where players rank all time. Instead of trying to figure out how to adjust WAR and account for era adjustments across different eras, the Pyramid Rating System has all of this built right into a grading system that represents each era proportionally as you go up and down the all-time rankings.
By grouping each player’s season into a grading bucket, we can gain more insight into a player’s relative greatness, rather than trying to measure the perhaps indiscernible difference between a 5.8 WAR season and a 5.3 WAR season.
This system also matches up more to how WAR should be interpreted, which is an estimate of a player’s value. By saying X number of players are rated as a B+, the Pyramid Rating System is saying there isn’t any inarguable conclusion you can draw as to who the statistically better or worse player is in this group. Did one player face tougher pitchers relative to another? Was another player in a better position to duck unfavorable pitching match-ups because his team had a better bench? Did one player play hurt for part of the year, affecting his stats? All of these factors can impact a player’s performance, but none of them has anything to do with a player’s ability.
The overall effect of these ancillary factors is likely minimal, but they will still show up in a player’s performance. Attempting to analyze these factors isn’t likely to yield anything of substance concerning how any given player compares to another, although it may steer further away from the reality of how the two compare if you attempt to dial in on a 0.1 difference in WAR.
However, drawing conclusions from these sometimes minor differences is precisely what the Pyramid Rating System was doing at times when trying to rank players against each other. It was always assuming seasons fall along that curve. But by grouping players into grading buckets, there is still a clear difference between a great season and a lousy season, regardless of how many or how few seasons are being looked at during the ranking process.
The greatest potential in this grade change is to make sabermetrics more palatable for not just the critical “old-school” fan but also the non-fan. A full explanation of WAR can take many minutes — and, to a non-fan, might be impossible to understand regardless. But someone who has never seen a baseball game in their life will be able to identify that an A+ player is tremendous, while a B player is good, and a C level one is about average.
The end goal of the Pyramid Rating System — examining how good a player is by taking in a variety of factors at once and outputting them into a value stat — remains the same with this update. One still can quickly identify the best players in history, as well as the oddballs and the overlooked players. But with this update, the information is now presented in a way that feels more innate and more natural to interpret, giving a better sense of accuracy in ways that overanalyzing the minutiae of WAR sometimes can miss.
Those interested in downloading the entire database to see how each season in major league history rates, along with where players rank all time, can do so by clicking here.
How is the all-time list derived from the number of individual seasons at various grades? Trout is ranked ahead of Schmidt, Gehrig and Aaron. He has more A++ seasons than they do, but they have more A+ seasons than Trout’ has seasons total. Musial, ranked still lower, has more seasons ranked A and above than Trout’s career total. Does an A++ season really count for that much more than an A+ or an A season?
For example, if you compare Trout with Schmidt and Aaron, he has three more A++ seasons, but nine or eight fewer A+ seasons. So it seems that an A++ season counts for at least three times as much as an A+ season. On the other hand, Speaker has two fewer A++ seasons than Johnson or Grove, yet is ranked higher apparently mostly on the strength of six more A+ seasons.
The reason I put such a high value on the A++ rating is that because any team with an A++ player on the roster has a 25% chance of going to the World Series. Last year four players who got the A++ rating. Mike Trout, deGrom, Nola, and Betts. The Red Sox won the World Series. (1 out of 4)
Drop down to A+, and that 25% chance drops down to around 16%. Go down to A though, and the odds become 15%, which isn’t much of a change.
But that’s why I put such an extreme emphasis on those A++ seasons. Of course, you need more than just one player to win, but without having at least one great player on the roster, you can’t win.
The easiest path to a World Series seems to be signing the best player in baseball, which is what Mike Trout is.
The reason why the value of the A++ seems to and does change is that the ranking process is iterative. An A++ season has no true value. It’s intrinsic based on not just how rare the A++ seasons are, but A+, A, A- and so forth seasons as well. I mentioned before how deGrom has an A++ season to his name, but all-time he ranks 811. Right near him is another player with one A++ season, Bryce Harper at 818.
With Trout, him having five A++ seasons in of itself says there is a 76% chance he should have gone to the World Series at least once by now.
There’s a lot of players you can build a World Series-winning team around, but there’s only a small handful you can potentially build a dynasty around, and this system views Trout as that type of player.
Is the 25% value based on all baseball history? Because that must change greatly depending on the playoff era. The same would apply to all other probabilities as well. Maybe it comes out in the wash though, and the increased chances of making the playoffs are being balanced by the chances of making it through the extra playoff rounds.
19 teams have made the WS this century, and 12 have won it. The astounding thing about the Angels isn’t that they’ve failed to make the WS with Trout (See Red Sox, Ted Williams era, where consistently good teams were consistently not good enough), but only made the playoffs once, with only one other “close” call the year after. I don’t want to run the numbers, but 1 playoff spot in the past 8 years must be close to the worst (Hi Seattle and Florida!)
also seems to me that guesses for negro league players have a better chance of relative viability with this grading system – can’t wait to see someone’s work on that
I would love to see it myself.
I can look at someone like Josh Gibson and if I figure 3 A++ seasons, 2 A+ seasons, 2 A seasons, 2 A- seasons, and 2 B+ seasons, all I need to do is find a comparison player he most closely lines up with to get a sense of where he would rank all-time.
If that estimate is correct, he would be on par with Cal Ripken Jr. who is 30th all-time.
I haven’t done any work on the Negro Leagues with regards to this, or even know if that’s how Gibson’s seasons would rate in this. I ‘m just using it as an example.
But I certainly think there is potential to do this using this ranking system that would make things far more manageable, than trying to calculate a WAR value for each season, based on limited data.
> Because the system had no way of discerning the real difference between a great season and a good one, this would occasionally lead to issues in the ranking process where Player A was interpreted as having a better season than Player B even though the two seasons were almost equal.
If this is indeed the driving force behind the letter system, I don’t quite see how the issue is addressed.
At some point, at whatever cutoff is selected, you’ll have a player with a B and a player with a B+ who have effectively had identically valued seasons (by WAR).
There’s a certain amount of truth to that. At some point you’re going to have to make a cut, and yes there are some B- seasons that rate closer to be and vice versa.
But keep in mind, we’re not treating WAR as an absolute value. We’re treating it as an estimate, which means those grades as estimates as well. And that’s the point I’m trying to drive at.
I’m not trying to figure out how foggy it is outside. I just want a yes or no as to whether it’s foggy outside or not. And by taking that approach, I think you’re results become more accurate, rather than trying to figure out which way is the best way to add up WAR, or debating how much emphasis should be put on peak vs career value.
Thank you for the last paragraph; I was looking at the chart of all-time greats wondering where one of my favorite early 20th century players (Christy Mathewson) was ranked. I read a biography about him late in my elementary school years and was enthralled by his career and life.
Thanks Paul for the enjoyable read!