10 Lessons I Learned from Creating a Baseball Simulator
Over a season, Mike Trout’s wOBA can reasonably vary by 60 points (via Keith Allison & Howell Media Solutions).
Editor’s Note: This is the first post of “10 Lessons Week!” For more info, click here.
Over the offseason, I decided to figure out how to make a baseball simulator, and not just any sim, but one that anyone could easily use. To my surprise, I actually did. You can find the result at baseball-sim.com.
The purpose of this article is not to promote my sim. Rather, the process of creating the sim taught me a lot, both about the process of simulating baseball games, and about the results of simulations that I have run myself. I’d like to share those lessons I learned.
Lesson #1: Baseball is simple
Ever since I started following sabermetrics, I have been fascinated by the discrete state-based nature of baseball. That is, at any moment in between plays during a baseball game, the state of the game can be described with a small number of variables, most with just a few possible values. On a play-by-play level, those states are: inning (and half), outs, baserunners, and score. Of course, there are other variables involved, but at the simplest level, a baseball game can be reasonably described with these four variables, and all but score consisting of less than 10 possible values.
I’m fascinated by this quality of the sport of baseball because it’s simple and easy to describe, and simple and easy to describe things can be easily measured and simulated. With regards to measurement, I have always loved statistics like RE24, which essentially sums the difference in run expectancy between states. But, of course, the aspect we care about today is simulation.
Most of you have likely heard of the concept of a baseball sim, either through games like Out of the Park Baseball or Stratomatic, or through custom simulators built by sabermetricians like MGL or Xeifrank. Those are all very complex, thorough simulators, but the great thing about the simple state-based nature of baseball is that a simulator does not need to be complex. All we need to do to create a simple sim is to keep track of the four variables I mentioned above, adjusting their values using whatever probabilities we want and a few simple rules about when innings transition, runners advance, and runs score. The basic process of creating this simple sim is as follows:
- Determine the probabilities of the main events occurring in a single plate appearance: single, double, triple, home run, walk, strikeout, and batted ball out.
- Determine rules for how runners advance given the event that occurred. In the simplest version, they can advance the same for every event, or you can assign probabilities of going first to third on a single, etc. Also set up rules for when runs score (when outs+runners+1 after the play is greater than outs+runners before the play).
- Start a game with the inning at 1, outs at 0, bases at 0, score at 0-0.
- Choose an event at random. Change the outs, bases, and score based on the rules specified above. Rinse and repeat until there are three outs.
- When there are three outs, start over, this time assigning runs to the other team. Rinse and repeat until there are three outs.
- When there are three outs, increase the inning by one, and start over. Rinse and repeat until 8.5-9 innings have been completed.
I took some shortcuts above, but the process of simulating baseball, at it’s simplest level, is, well, simple. Because of the small number of variables and the easy to understand rules, it’s not a hard model to set up.
Lesson #2: Baseball is not simple
The sim I laid out above, while interesting, is fairly useless when we’re trying to actually model a real baseball game. Here are some of the variables that are missing from the above model:
- Individual batter probabilities
- Starting pitchers
- Relief pitchers
- Baserunning
- Fielding
- Park
- Weather
- Umpire
- Handedness
- Bench
- Bunts
- Batted ball profile
- and so on…
While making my sim, I quickly realized that each additional variable I included would add a layer of complexity and work, complexity that compounded each time I made a change. Some of the variables were necessary to have a remotely useful sim, like batter probabilities, and others, while integral to the game of baseball, could be put off for another time, hopefully without sacrificing the usefulness of the tool (like baserunning). In the end, I created a model that considered the starting lineup and starting pitchers, but not much else. In this way, I would have a sim that was simple to use and understand, and could have some practical uses, but one that still required a lot more work in order to be relevant with regards to making predictions or optimizing lineups.
Lesson #3: Batter-pitcher matchups are much more complicated than you may think
The initial version of my simulator consisted of only the starting lineup. The sim would take the 2013 season stats of the players, turn those stats into probabilities of single, double, triple home run, strikeout, etc, and determine the outcome of each play based on those probabilities, adjusting the game state accordingly. That was fun and interesting, but after a while I became bored and ambitious. I wanted to include pitchers.
I began with the foolish thought that this would be a simple task of essentially averaging the the probabilities of pitcher and batter. The pitcher strikes out 20% and the batter strikes out 10%? Just use 15% — easy!
Not easy. You can probably already see why. If a pitcher and a batter both have strikeout rates below the league average, then combining those rates should produce a number that is even lower than both probabilities. Put another way, if you face Adam Dunn (31% K-rate) against Craig Kimbrel (47%), and average the strikeout rates, you get a 39% rate, but that’s lower than Kimbrel’s normal rate. In fact, we would expect Kimbrel to strike out Dunn at a much higher rate than normal.
That’s where the Odds Ratio method comes in. This is a variant of the log5 method made famous by Bill James to estimate the probability of team A beating team B, given both teams’ win probabilities. You can read a detailed description of the Odds Ratio method at Tom Tango’s blog, but the gist of the technique is that it allows one to estimate the probability of an event’s occurrence, given the probabilities of the event occurring for the pitcher, batter, and league. The simple implementation of the formula is:
Odds = Odds(H) * Odds(P) / Odds(L)
To implement this technique, I took each event (hit, strikeout, walk, etc), and used the hitter, pitcher, and league odds to find the overall odds, using the corresponding probability as the “true” probability of the event occurring. After doing so, the sim seemed to work fairly well. Batters performed worse against good pitchers, and vice versa. But, as Beyond the Box Score writer/researcher John Choiniere pointed out, the method I used didn’t quite work.
Why didn’t it work? Well, it’s complicated, but the basic idea is that the Odds Ratio method is only valid when there are two possible outcomes. That is, you can used Odds Ratio to find the probability of contact or no-contact overall, but you cannot sum up the Odds Ratio probabilities for home runs, batted ball outs, and non-HR hits in order to find the probability of contact. The reasons for this are beyond my understanding, but I confirmed that this was true by seeing that the sum of the probabilities as I had been calculating them did not equal 1.
Instead, I used a chained binomial approach–in layman’s terms, this means that I split each plate appearance into a “decision tree” of sorts, so that each time I used the Odds Ratio method, it was on an “A or not-A” set of outcomes, rather than “A or B or C or D”. In this case, that means I used pitcher and batter statistics to choose contact or no-contact, then if contact, home run or no-home run, then if no-home run, hit or not-hit, and so on. In the end, I came up with probabilities for each event that added up to 1.
Lesson #4: On high-scoring teams, OBP rules
A topic that has interested me recently is the effect of lineup construction and ability on overall offensive performance; in other words, how do the types of hitters on a team affect the way and extent to which teams score runs. Is it better to have high-OBP or high-SLG players, overall offensive ability being equal? What if overall offense is below average? What type of hitter do you want as a ninth player if the other eight are bad?
The topic has been covered extensively by Steve Staude at FanGraphs, as well as by Tom Tango, who both came to the conclusion that the higher the run environment, the more important OBP is over SLG. In other words, if you have a team of above-average players, you would rather they have a high OBP than a high SLG, their wOBA being static.
To test this, I ran two simulations. In the first, I ran a team of all 2013 Carlos Santana against average pitching, and in the second, I ran a team of all 2013 Marlon Byrd against average pitching, then compared their final runs per game. I chose these players because both had a .364 wOBA last year, but Santana had a line of .268/.377/.455, while Byrd had a line of .291/.336/.511. Based on the findings of Staude and Tango, we would expect that the Santana team to score more runs per game since both hitters are above average.
The simulation confirmed this suspicion. The team of Carlos Santana scored 6.2 runs per game, while Marlon Byrd’s team scored only 5.6. That’s quite a difference considering equivalent wOBAs, and the tip of the iceberg as far as determining the best construction of a lineup to take full advantage of these characteristics. Does this mean that front offices should value certain players more than others based on their current lineup quality, even if the players are of the same overall quality? Maybe, but that’s a question for another day.
Lesson #5: On low-scoring teams, SLG rules
The flip side of the above conclusion from Tango and Staude is that for a low-scoring team, it is better to have players with power than players who get on base, again, all else equal.
I tested this in a similar way as above, by looking at Jonathan Villar (.243/.321/.319) and Zack Cozart (.254/.284/.381), who both had a .289 wOBA in 2013. Because Cozart had a higher slugging, we would expect a team of him to score more runs per game than Villar’s team, since slugging is more important in low-scoring environments.
The sim confirmed this expectation, with Villar’s team scoring 3.3 runs per game compared to Cozart’s 3.4. As you can see, the difference wasn’t nearly as drastic as that of Santana/Byrd, partly because Villar/Cozart weren’t as bad as the others were good, and partly because the difference between the two with regards to OBP and SLG wasn’t as great either. Still, over 10,000 games, even a tenth of a run per game is evidence of the benefit of slugging on lower-scoring teams (see: Stanton, Giancarlo).
Lesson #6: Random variation is real and significant (for teams)
The effect of random variation should be well-known to those who read tangotiger.com often, myself included, but the extent to which simulation results vary, even over large samples, astonished me. As an example, I’m going to run a simulation of a sample game between the Yankees and Red Sox (based on ZiPS projections) 162 times, note the results, then repeat 10 times. Below are the results in winning percentages and runs per game:
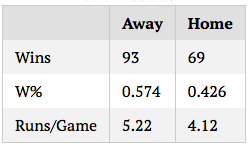

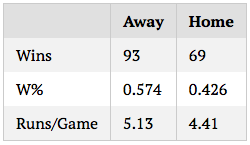
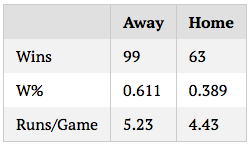


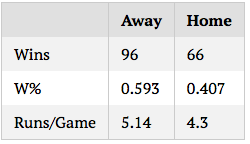


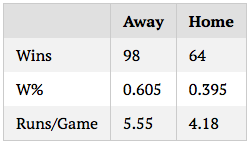
On the one hand, randomness like this isn’t, and shouldn’t be, surprising. One of the great things about baseball is the worse team always has a significant chance of winning, and it’s pretty much impossible to consistently predict who will win a game or series. So seeing variation in win percentages, in this sense, and in the statistical sense, is entirely expected.
On the other hand, the results shown above contradict the way in which many to most baseball fans and analysts think about the game, and about season results. A team that wins 104 games is clearly better than a team that wins 88. Even a team that wins 98 would be put in a different category than a team that wins 93, especially with the same quality of opponent. And yet, these are entirely plausible ranges of outcome for a team season. 104 and 88 are likely extreme cases for the team, but as we see above, it is not out of the question for a 96ish-win team to end up with 88 or 104 wins. As much as we want to ascribe final results entirely to skill, the fact of the matter is that there’s always an error range, even for entire seasons, a fact that should be in the back of our minds when we summarize past seasons or predict future ones.
Lesson #7: Random variation is real and significant (for players)
In the same vein as above, player results are significantly affected by random variation, as much as we want to ascribe them to skill rather than luck,. Consider the final batting statistics of 18 Mike Trouts batting against Yu Darvish over 150 games:
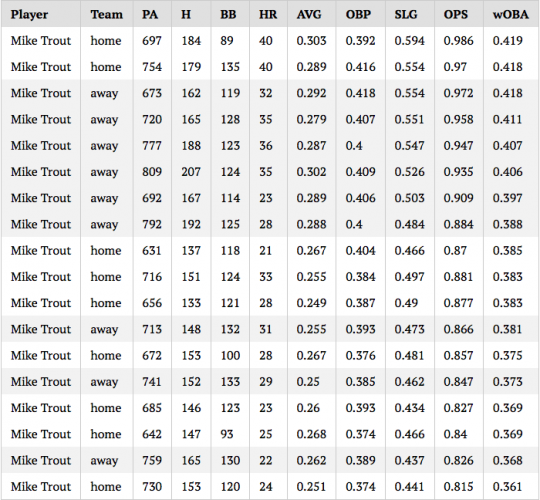
The results here seem even more surprising and counter to the common way of thinking about statistics than the team results. Based on pure randomness, a full season of the exact same player can reasonably vary between .360 and .420 wOBA, .250 and .300 batting average, 22 and 40 home runs, and so on. Those are drastic differences, and again, though they are the extremes of reasonable outcomes, they still illustrate the effect that randomness plays in player statistics. We may say that we are aware of random variation, and try to consider it in player evaluation, but for most people, including myself, the significance that it has in our day-to-day evaluation is probably not nearly as high as it should be.
(By the way, when I simulated 25 games, about how many players will have played when you read this, Trout’s wOBA ranged from .312 to .510. Another reminder to take early season statistics with a grain bagful of salt.)
Lesson #8: Batting order matters, sort of
Much has been written and researched on the ideal order of a lineup, and there are tools available to determine the best order of a lineup. I was still curious, however, about what my simple simulator would say about these theories and about the differences between types of lineup orders.
One example I heard a lot about last year and in the offseason was the placement of Joey Votto and Zack Cozart in the Reds lineup. Last season, Votto batted almost every game in the third position, behind Shin-Soo Choo and Cozart. Choo, of course, was one of the highest-OBP players in baseball last season, but Cozart’s .284 OBP in arguably the most important OBP spot in the lineup was, by no reasonable standards, a smart move.
This season, Votto has been batting second (behind Billy Hamilton), and Cozart eighth; this placement of the two should, by The Book, net the Reds more runs per game than batting Cozart second and Votto third, all else equal. So does it?
Yes, but barely. With Votto third and Cozart second, the Reds scored 4.23 runs per game using 2013 numbers (and 20,000 games simulated), but with Votto second and Cozart eighth, they scored 4.26. Over the course of the season, that’s about five runs, or half a win. Which is not insignificant, and surely means that Cozart should not bat second, but the impact of this change is small.
Lesson #9: A good closer makes a big difference
A fun aspect of the sim to play around with is the custom starting situation options, in which you can begin games at a certain inning, with a certain number of outs, runners, score, and batting spot. In particular, I was curious upon adding this feature about the significance of having an elite closer close the game instead of a mediocre one.
To test this, I took two random teams (Rays @ Angels in this case), and simulated 20,000 games starting in the bottom of the ninth, with the Rays up by one. The first time I ran the sim, I used Craig Kimbrel as the closer (with ZiPS projections), and the Rays won 87% of the time. Then, I ran the 20,000 games again, this time with Jose Valverde as the pitcher. In the second situation, the Rays won only 74% of the time.
Without doing any analysis of these numbers, that took me aback. There is a huge difference between 87% and 74%, one that would have a huge effect over the course of a season. If you assume that they both have 50 save opportunities in a season, that’s a difference of 6.5 wins. Of course, reality is a bit more complicated than that, but it’s a good indication that there is a bigger difference between an elite and below-average closer than WAR may indicate.
Lesson #10: My work will never end
When I began this project, I saw it as a simple opportunity to get more coding experience, and maybe make something that would be fun to use for a bit. I soon realized that 1) I knew nothing, and 2) there were a million things that I could do to improve the simulation engine itself, as well as add new, hopefully interesting, features. I wanted to add a “Scores” page, which would run simulation on all current games; I did this, but there is a lot I need to do to make it better. I want to add a lineup optimizer, a season simulator, and most importantly, the many factors I mentioned in lesson #2.
The sim is not perfect, but as the lessons above show, it can still teach me, and hopefully others, some interesting lessons about baseball. Or, at the very least, it can remind us of lessons we should already know.

What language did you program your simulator in?
I was browsing through google.scholar recently and I found a paper that used optimization techniques to set ideal fielder positions based on a batters hit chart. It divided the baseball field into a grid and using an optimization algorithm assigned positions for each of the fielders.
I wonder if you could even add that micro level into your model (ie ball hit location, ball hit speed) and incorporate the chance of H,2B,3B,HR, OUT,E off of something like that… O_o
Also I was thinking how you would account for bullpen management O_o
(yeah this stuff starts to add up quick haha…)
I wrote the core sim model in Python (because that’s all I know!). Yeah, the batted ball location is interesting, and definitely something worth looking into. Of course, before I do that, I first would need to include batted ball type (GB, FB, LD). This is something that shouldn’t be terribly difficult, but will probably still take me weeks to implement. Though bullpen management is probably higher priority. I think my approach will be to just assign “roles” to each reliever, and then make pitching changes based on league trends from runs allowed, and innings pitched, and situation. Again, it’ll be quite an endeavor to add this in, but I think it’s a pretty important step.
“Also set up rules for when runs score (when outs+runners+1 after the play is greater than outs+runners before the play).”
This formula doesn’t seem quite right… I would move the +1 to the other side and flip the inequality sign. Or just switc h “before” and “after”.
I don’t think this is right? If there’s a solo home run, then Outs+Runners after will be equal to Outs+Runners before. So to get the one run, you go with (aOuts+aRunners+1) – (bOuts+bRunners).
Or am I thinking about this incorrectly?
It works in that case but would also work with (bOuts+bRunners+1)-(aOuts+aRunners) = 1
Now consider men on 2nd and 3rd and a single that drives them both in. In this case your formula gives
(aOuts+aRunners+1)-(bOuts+bRunners) = 0
because aOuts-bOuts=0 and aRunners-bRunners = 1-2 = -1. Whereas my formula gives
(bOuts+bRunners+1)-(aOuts+aRunners) = 2
which is the correct number of runs.
This is awesome, I had seen this earlier in the season but never got a chance to play with it.
As the simulator currently stands, is the bullpen completely ignored?
Yeah, right now it assumes that the starter pitches the whole game, unfortunately. I really want to get the bullpen in there, but it will just take a bit of background work with bullpen management, etc. I’ll probably start with just the closer, and then add the other pieces as well.
Good starting work and good article Matt. Even this far in, the extent of random variation takes me back a little bit.
One caveat I’d like to point out is that the Kimbrel-Valverde comparison of 6.5 wins isn’t really fair because each of the 50 save opportunities take place when the team has one run advantage. In reality only roughly 1/3 of save opportunities will take place with this score (in actually it’s probably a little more than 1/3, but you get the point), so the leverage will on average be much lower than the one described above. Of course if closers got 50 oppurtunites to save one-run games over the course of the season, then yes they would be very important!
I too think that closers are under-rated by the sabremetric crowd, but not “they’re worth 6.5 wins” under-rated.
A quick look at the leaderboards suggests that an elite closer offers a WAR of around 3, while a bad closer is replacement-level or even a bit below. Quickly playing with the simulator suggests that the winning percentage difference between Kimbrel and Valverde with a two-run lead is ~6%, and with a three-run lead ~4%. Assuming that save chances are evenly distributed among one, two, and three-run leads (which admittedly probably isn’t true), that suggests that the difference between Craig Kimbrel and Jose Valverde is about 3.8 wins over the course of a season.
So while WAR may slightly underrate the importance of an elite closer, I don’t think it does so by very much. A difference of less than one win is probably within the error bars of both WAR and this simulator.
Yeah, that was a silly assumption to make. Obviously the difference between the two is going to be much smaller than that. Whoops! Thanks 🙂
I love the amount of random variation that comes into play – that’s a lesson I never get tired of learning about baseball. Do the guts of your simulator allow you to figure out how much of that variance is tied up in known “sources” of luck, like BABIP? And if you added complexity to the simulator by adding batted ball types, more in-depth pitcher/hitter matchups, or the like, do you think that would measurably affect the amount of random variation (and in which direction)?
Another thing I wonder is whether simulators have value in getting a better grasp of true player talent. By running multiple simulations with a known, constant “true talent” level, you should be able to get more information about the distribution of outcomes based on chance. Which, in theory, could be useful in putting confidence intervals on a player’s true talent given a few seasons of actual results.
I have some questions about how much random variation there is in player BABIP versus player wOBA, OPS, etc… If you added BABIP to the Mike Trout table in #7 above, for example, would the standard deviation of BABIP be that much larger than the standard deviation of wOBA or OPS? I think it would be very interesting if you found that BABIP had a much “luck” or random variation as wOBA or OPS.
Those are excellent questions and ideas. I’ll definitely look into adding BABIP and maybe some other stats as well. I’d also like to figure out some way to vizualize the distribution of outcomes, both team and individual. That might give a better idea of what to expect than just showing the mean.
This was fantastic. The points about variance were really, really fascinating I thought. Crazy to see a team range from 88 to 104 wins. Super duper job.
Yes, we all know that there is that kind of variation in a team’s record due to chance, but seeing it in this context makes a real impression.
Is homefield advantage accounted for in this simulator? I have run a handful of 3,000 game batches with identical teams (9 Daniel Navas facing Clay Buchholz) and the road team appears to have a modest but noticeable advantage.
Nope, no homefield advantage. Theoretically, two identical teams should be completely equal, regardless of home or away, so the difference you saw in the sims was probably just chance.
Hey Matt,
Really enjoyed this piece and its takeaways.
I do think the batted ball profiles are definitely something to explore. It could give us a measurable uncertainty in Batted Ball distributions, but also help us understand how much the pitcher influences the probability of a hitter’s batted ball outcomes.
For instance, if pitcher A gives up a LD% of 35% and Batter A has a LD% 25%, what’s the P(LD) (where LD !=HR) given this interaction. Simulating these kinds of events would give us a better understanding of how BABIP is influenced by pitcher and hitter match-ups.
This way we can get a better understanding of adjusting for pitcher-neutral ball-in-play (BIP) distribution as it relates to BABIP. I think if the simulator can handle this kind of exploration, it would be worth it to add those batted ball profiles. Of course, the simulator as it is now is already awesome, adding batted balls would make it a new kind of awesome.
Agreed! I’d love to add batted ball types for pitchers and hitters. The problem is that I don’t believe the major projection systems include batted ball outcomes, so I’d have to use a different source for that (maybe just 3-year averages?). Still, it would be awesome to have this, and have a good way to display the results and how each factor influences the end results. Thanks Max!
Did you adjust for platoon splits in your batter-pitcher matchups?
Nope, but I’m planning on doing that in the future. It’ll likely be only on the batter end to start, and maybe only for certain data sources, but it would be really cool to have that.
Great article, Matt. Thanks!
Awesome stuff, and very readable even by plebeians like me.
thanks for the thoughtful piece, and the relevant references.
When I was learning programming I built baseball simulators. I made one similar to the one described in the post, but I always wanted to do something more.
These situation based sims are good for statistical evaluations, but I wanted one a little closer to describing the game itself. I created pitch types with profiles for movement, break, deception, velocity and control, with corresponding skills for hitters.
I got as far as having the pitcher select the most appropriate pitch based on the count, execute the pitch with random variation, having the pitcher deciding whether or not to swing, and then missing or making contact. The result was converted to a horizontal and vertical vector as well as velocity.
The pitch would show on a graph of a strike zone (a la pitch tracks) and an outline of a field would display a vector.
It needed a lot of work and all the other things mentioned in this article to make it worthwhile, but at that point I was over it. haha.
Now the whole point I was making with this is, soon we may end up with access to data on the physics of balls in play, which would allow us to make simulations like this work with actual players and actual data. It could be extremely fascinating.
I’d bet the players you use in your simulation are rated based on their true talent, as opposed to the single-season performances that are the bases for the traditional, marketed baseball sims like, say, Strat-O-Matic, APBA, and Replay. (I know that OOTP breaks the tradition and that projection disks, like those offered by Diamond Mind Baseball, are based, as much as feasible, on the true-talent model.) An interesting discussion of baseball sims, random variation, and people’s expectations about “accuracy” in sports simulations was started by Ted Turocy, a stats and economics prof and game-theory expert, here.
You could have just used DYNASTY League Baseball Online Matt.
http://www.dynastyleaguebaseball.com/Main.aspx