A Humidor at Chase Field: What’s Up With That?
The Diamondbacks will employ a humidor at home this season. (via Gradecki)
Back in 2011, I wrote an article the primary focus of which was an attempt to postdict the effect of the humidor on home run production at Coors Field. The article was based in part on a piece of academic research I had done with my collaborators a few months earlier in which we did careful laboratory measurements of the effect of humidity on the weight and coefficient of restitution (COR, or the “bounciness”) of the baseball. The essential idea is that when a baseball is stored in a humid environment, it absorbs water, which has the dual effect of decreasing the COR and increasing the weight, both of which should result in a reduction in exit speed, all other things being equal.
It might be helpful to review the basic facts about Coors Field, which long has been viewed as a batter’s paradise and a pitcher’s nightmare. Because the air density in Denver is approximately 80 percent of that at sea level, fly balls carry farther and pitches have less movement, both of which contribute to an increase in a variety of offensive statistics, particularly home runs.
For the first seven seasons at Coors, there were 3.20 home runs per game compared to 1.93 per Rockies away game. However, starting in 2002 the Colorado Rockies began to store their baseballs in a humidor at a constant 50 percent relative humidity and 700F, as opposed to the more typical 30 percent humidity in Denver. During the period from 2002-2010, the Coors ratio decreased to 2.39, a reduction of 25 percent, while the away game ratio stayed essentially constant at 1.86.
To calculate the expected decrease in home run production at Coors required a three-step process. First, it was necessary to estimate how the elevated relative humidity (from 30 percent to 50 percent) affected the properties of the baseball–primarily COR and weight–resulting in a reduced exit speed. That was accomplished using laboratory measurements of the effect of humidity on the COR and weight, along with a physics model of the ball-bat collision to calculate the effect of these quantities on the exit speed.
Second, using the reduced exit speed, an aerodynamics model for the flight of the baseball was used to calculate the reduction in flyball distance. Finally, actual home run data, courtesy of ESPN Home Run Tracker, were used to calculate the reduction of home runs expected from the reduced distance. Amazingly, the calculated reduction in home runs at Coors, 27±4 percent, agreed essentially perfectly with the actual value of 25 percent.
In the course of this work, there were stories reported that the Arizona Diamondbacks were considering installing a humidor at Chase Field. So we decided to use the same technique to extend our calculations to Chase, where the relative humidity is even lower, about 20 percent, than at Coors. Therefore, we expected and found an even greater reduction in home runs, 37±7 percent, than at Coors. Interestingly, the plans to install the humidor subsequently were abandoned. I realize correlation is not necessarily causation, but it is very tempting (not to mention flattering) to think there was a causal connection with our article.
Now we fast forward to the 2017 season, where reports abound that the D-backs are reviving their plans to install a humidor, and it will probably happen within a month or so. D-backs CEO Derrick Hall is quoted as saying regarding the humidor, “Again, I don’t know if it’s going to make a difference. It hasn’t made a huge difference at Coors Field, I don’t think.”
With all due respect, Mr. Hall, it has made a huge difference at Coors, at least with respect to home run production. Moreover, if our previous analysis is even close to being correct, it will make an even larger difference at Chase. To prove that, I decided to dust off my old calculations and come up with an updated prediction. And unlike our earlier postdiction for Coors, the new prediction soon will be tested. In other words, I am really sticking my neck out here.
I am going to approach this problem a bit differently than last time in that I want to rely as much as possible on publicly available data from Statcast from the 2015 and 2016 seasons, including exit speeds, launch angles, and outcomes. I will be using two categories of data:
- Data Set 1: All home and away batted-ball data for the D-backs
- Data Set 2: All batted-ball data from Chase Field
I first use Data Set 1 to compare home and away mean exit speeds for D-backs batters. The essential idea is that higher exit speeds would be expected for the home games at Chase Field due to the elevated COR in the drier climate. A home/away comparison is shown in Figure 1, where the histograms have been scaled so that the same number of batted balls appear in each plot.
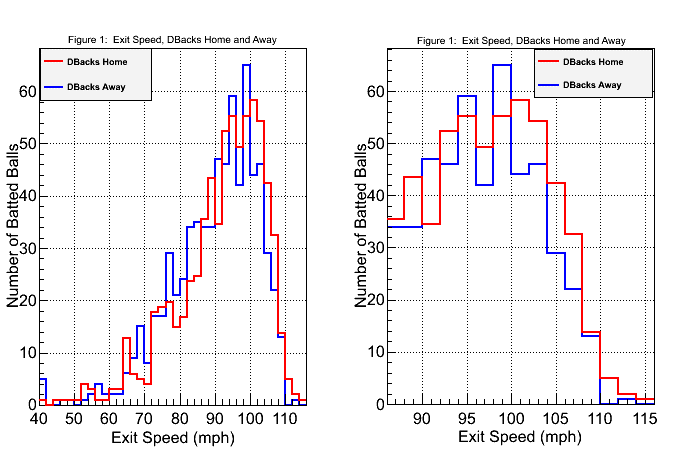
Since I am considering only home runs, only events in the launch angle range 20-35 degrees — encompassing about 90 percent of total home runs at Chase — are included. The left plot shows the full distribution, the right plot a blowup of the region above 90 mph, which is the region most relevant for home runs. The mean exit speed is 91.9 and 89.9 mph for home and away, respectively, a clear-cut two-mph shift to higher speed for games played at Chase. The shift is particularly apparent for exit speeds above 100 mph, as the right plot most clearly shows.
At this point I want to digress briefly to comment on how compatible a 2-mph shift in exit speed is with expectations based on how the baseball properties depend on relative humidity. In fact, based on a starting point of 20 percent and elevating to 50 percent (both at 700F), the physics-based calculation predicts a shift of about twice that, or 3.8 mph, which is essentially identical to the 4.1 mph shift we found in 2011, despite the improved ball-bat collision model. I am puzzled by this discrepancy and wish I understood it better. But I don’t and will proceed with the analysis assuming a two-mph shift, but also realizing the effect on home runs could be even greater. I will return to this point shortly.
Given the two-mph shift in exit speeds, the analysis now proceeds along the same lines I used in an article I wrote last year about the increase in home runs starting with the 2015 All-Star break. Using Data Set 2, which are batted balls at Chase Field (both home and away teams), and once again restricting the analysis to balls hit in the range of launch angles between 20 and 35 degrees, I plot in Figure 2 the distribution of exit speeds — both the actual exit speeds (red) and the same exit speeds shifted downward by two mph (blue), the latter simulating the effect of the humidor.
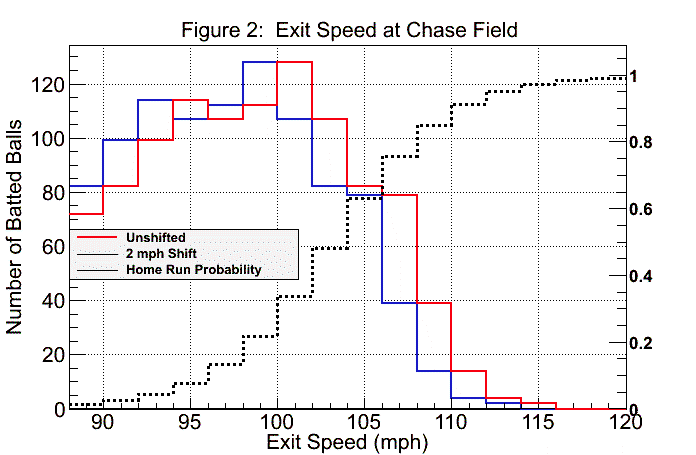
The dotted curve shows the home run probability as a function of exit speed, which varies between zero and one and is a smooth fit to the Statcast data. Given that the exit speed distribution is falling rapidly in just the region where the home run probability is increasing rapidly, it is not hard to imagine how a seemingly small shift in exit speeds can have a very large effect on the number of home runs.

This is further apparent by the curves in Figure 3, which were obtained by multiplying the exit speed distributions by the home run probability for each 2 mph bucket of exit speed. The resulting curves are the distribution of exit speeds for balls hit for a home run.
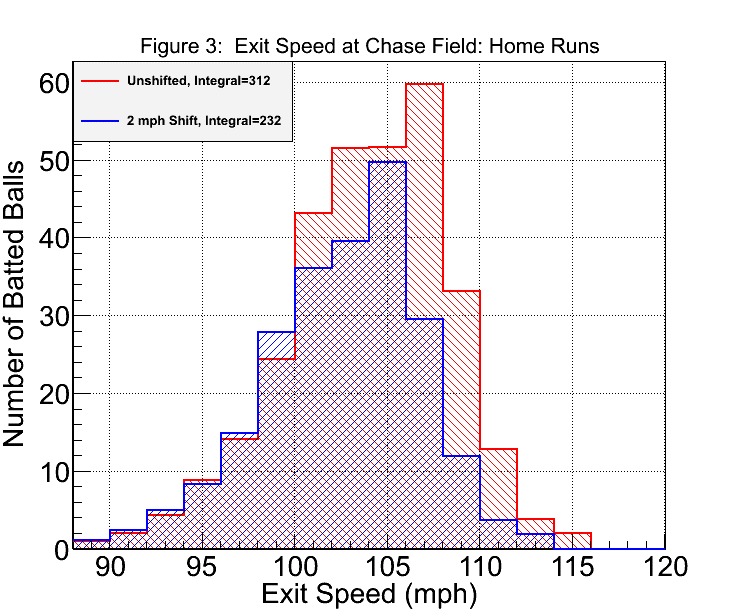
The area under each curve is the expected number of home runs, which is 312 for the actual data and 232 for the shifted data, a 26 percent reduction. If the actual shift in exit speeds were four mph, as the physics-based calculation predicts, the expected number of home runs would be 164, a reduction of 47 percent. Interestingly, the average of these two results is 37 percent, exactly the value found in the 2011 analysis. However, this perfect agreement is surely fortuitous, given the very different techniques and data utilized back then.
So what do we conclude? I am very comfortable saying that, with the humidor running at 50 percent and 700F, there will a reduction in home run production at Chase by 25-50 percent. While it would be nice to come up with a more precise prediction, we should not lose sight of the principal takeaway that the installation of a humidor will reduce the number of home runs substantially.
References & Resources
- Statcast; Baseball Savant
- ESPN Home Run Tracker
- Alan Nathan, Baseball Prospectus, “Baseball ProGUESTus: Home Runs and Humidors: Is There a Connection?”
- Alan Nathan, Lloyd Smith, Warren Faber and Daniel Russell, American Journal of Physics, “Corked bats, juiced balls, and humidors: The physics of cheating in baseball”
- Nick Piecoro, The Arizona Republic, “Arizona Diamondbacks exploring ways to make Chase Field less hitter friendly”
- Nick Piecoro, The Arizona Republic, “Arizona Diamondbacks back off idea of using humidor this year”
- Vince Marotta, ArizonaSports.com, “Get a grip: Arizona Diamondbacks to install humidor at Chase Field”
- Alan Nathan, The Hardball Times, “Exit Speed and Home Runs”
Wouldn’t the massive difference in elevation between Chase Field and Coors Field factor in to a less dramatic reduction in Home runs that you’ve concluded will happen?
I didn’t see you factor that into any part of your discussion about Chase Field installing the humidor, only factored in when discussing Coors in the early part of the article.
I can’t speak for Alan but he’s only addressing EV. Altitude (air density) has little to do with that.
What happens after the ball leaves the bat is another story and mostly independent of the effects of increased weight and decreased COR although to some extent the air density may affect the effect of change in weight.
In other words a decrease in EV of X should decrease home run rate by R regardless of the air density.
Obviously for any given EV the ball flies a lot farther at Coors than at Chase.
I’d be interested to see the effect that the drier humidity has on exit velocities in terms of moisture retained in the bats. Granted I don’t know if there is a way to reliably measure that while cancelling out a lot of other noise, but I have to imagine there is some effect coming from that as well. The additional moisture in bats in more humid climates I would imagine makes them heavier and a little softer, which I would guess reduces bat speed and the potential bat-on-ball impact, if even minimally. Having a drier, harder bat has to make some kind of impact, which is at least the theory that Ted Williams was operating from when he used to put his bats in the drier at the stadium to get the moisture out of them.
I’d also guess that the impact of moisture in the wood of the bats likely has far less impact than the moisture of the baseballs, but I have to think it would still be significant.
Joe I would think that humidity has very little effect on the properties of the bat.
Humidity certainly has a major impact on wood flooring and wooden instruments. Why not bats?
Alan I’m confused as to where you get the 2 mph effect and the 4 mph “physics based” effect.
Does the 2 mph come simply from the difference between home and away Statcast EV values? In other words you assume with a humidor that balls at home will now act like balls on the road, exit velocity-wise?
Why do you make that assumption?
Or are you assuming that the batted balls will see the same EV decrease at Chase as in Coors when the humidor was installed?
And where do you get the 4 (3.8) mph theoretical reduction? How do you know the effect of the humidor on the COR and weight? Doesn’t it depend on how long the balls are stored in the humidor or are you just assuming they’ll keep them in there so long that we can assume it’ll be just as if Chase were at 50% humidity?
Do you know when they take them out before the game and if that has an effect?
Finally, if Coors Field is essentially going from 30 to 50% and Chase from 20 to 50% why would you expect the same % reduction in HR rate (25%)? Shouldn’t it be higher at Chase?
Part of what I was asking is, do you know the actual relationship between ambient humidity and the weight and COR of a ball?
So is that where you’re getting the 3.8 mph number?
I don’t know about the 2 mph number.
If that’s what’s observed at Coors my guess is that the difference is due to the balls being out of the humidor for some period of time or perhaps not being in the humidor for as long as you think.
Unless in your 3.8 mph estimate you already account for the balls being out of the humidor for X hours/minutes? In other words in your testing you’ve placed balls in a humidor for some period of time, taken them out for some period of time and then weighed them and computed their COR?
I’m curious, how long do the balls need to be in the humidor to acclimate to the 50% RH environment? And how long after being removed from the humidor will the balls “dry out?”
The reason I ask my above question is that if the balls are not kept in the humidor long enough before being used in play, the reduction in home runs will be drastically lower than your prediction. Likewise if they are removed from the humidor too long before being used.
Lots of questions to answer, so here goes, in no special order:
1. It takes many days for the water content of the baseball to equilibrate to its environment. The storage time in the humidor is very long and the time from removal to end of game is probably <6 hours. So my expectation is that the water content during a game will be the same as in the humidor.
2. The 3.8 mph number was derived using the same assumptions as in my previous Coors article, using measurements in the American Journal of Physics article (http://baseball.physics.illinois.edu/AJP-June2011.pdf). The article has graphs showing the relationship between COR and relative humidity (also weight). There is also a graph showing how the weight depends on the amount of time in the humidor (related to my first point about equilibration time). The 2 mph number was based on actual data, described in the next paragraph.
3. So, how do we estimate the shift in exit speed due to the dry climate at Chase. I look at DBack batters, comparing exit speeds home vs. away. The assumption is that the home exit speeds are elevated due to the higher COR & lower weight associated with the drier climate. It is the best I can do using nothing but data. One can poke holes in such an argument.
4. Bottom line: "physics" predicts ~4 mph shift (leading to ~50% reduction in HR); Statcast data (as described above) shows a 2 mph shift (leading to a ~25% reduction in HR). As a physicist, it is very unsatisfying to end up with two different results differing by so much. But so be it.
5. As I emphasized in the last paragraph of the article, don't let the uncertainty take away from the point that whether 25% or 50% reduction, there will be a significant reduction in HR.
6. Finally, as MGL pointed out, the altitude at Chase does not play a role. We are comparing pre- to post-humidor HR at Chase, and the difference is all driven by the difference in exit speeds.
Does the COR change the pitch at all? Could the higher COR and lighter balls lead to faster pitches, therefore decreasing movement? This could lead to more “barrels” and a higher sample in the same launch angle.
And if the humidity changes the ball, it could make the bats lighter, as someone mentioned earlier.
That missing 2% is one of my favorite things about baseball. There’s so many variables its almost impossible to nail them all down at once.
Regarding the discrepancy, I assume one hypothesis is that the away locations don’t average to the expected 50% humidity. For instance, a quarter of the D-backs’ away games are in LA or San Diego — if those stadiums are really dry or have other exit-speed-reducing factors, that could have a noticeable impact on the numbers.
I’m also curious if the home vs. away pitch velocities differ. One would expect the pitching staffs to be about equal, but if something’s causing balls at Chase to reach the plate at a slower speed, that would offset the boost in collision physics.
Terrific article, and I’m already looking forward to another update in a couple years. If the data always matched predictions, science would be boring! 😉
Actually, I meant to address the issue of the bats. There is a story that Ted Williams used to put his bats in an industrial clothes dryer in the summer to drive out the water. Maybe true, maybe not. It is true that the wood can absorb water, with the principal result being that the bat is heavier. The story has some credence in my own mind, since I know Ted was very sensitive to small changes in bat weight. But I think that kind of issue plays no substantial role in the humidor question. The effects would be much too small, compared to the principal effects on the COR and weight of the baseball.
The COR has no effect on the pitch. However, it is true that one reason for using a humidor is that the surface of the ball feels very slippery to pitchers when it is very dry, making it hard for them to get a good grip on the ball. That’s a hard effect to quantify so I didn’t even attempt to address it.
Here’s my guess: When all is said and done, the reduction in home runs will come out to be closer to the 50% than to 25%. We already saw a 25% reduction at Coors and it simply has to be true that the drier climate in Phoenix will result in a greater reduction once the balls are stored at 50%/70F.
This is great stuff, Alan. Your original piece about Chase Field and the humidor is one of the things that got me into Statcast research.
That said, when you mentioned the unexpected discrepancy in exit velocity, I got excited thinking I may have a solution. Each stadium has a built in measurement bias, as I am sure you are aware. Perhaps that could make up the difference? Well, if I am not mistaken, Chase Field has a 1.2mph measurement bias. Which, I believe, would be in the opposite direction of what you would want to cover that discrepancy you’re referencing here. If you subtract 1.2mph from the average, it would be only 1mph out of the 4mph difference you wanted.
But, maybe I am reading this chart wrong, and I have the sign backwards? Anywho, I am referencing this article here: http://www.baseballprospectus.com/article.php?articleid=29210
Andrew…good comment. I am not sure of the sign of the effect in that article, which has Chase with a 1.17 mph Park Effect for exit velocity. Does that mean it has 1.17 mph higher exit speed or lower exit speed. If higher, then that goes in the “right direction” to be an effect due to the dry climate, since dry means elevated COR and reduced ball weight. Of course, the essence of that article is that there are park effects due to calibration issues. I would argue that there ought to be park effects due to climate-related issues. Of course, both might exist, but neither their technique nor mine can distinguish the two. Which is why I ultimately prefer the physics-based estimate of a 4 mph shift.
As to bats and absorbing or losing water content to humidity, that impact has to be very minimal but beyond that, I would think bats would take months to adjust to changes in humidity. As such, bats are pretty much unaffected by the changes in humidity – the DBacks’ bats would be dry even after a road trip and the visitor’s bats wouldn’t have enough time to adjust to the dry desert air in just a few days.
A 25-50% reduction? No way! Chase was 4th in HR’s last year with 221 – only 6 ahead of COL (Seattle led with 234/SF was last with 119). A 25% decrease would drop them to 24th based on 2016’s numbers. 50% would put them dead last with 111.
Reduction at home only.
Good Stuff , Alan
Any guesses on whether there might be any impact on pitchers? Just random thoughts:
– Will there be a better grip to spin breaking balls better (or does rosin / “other” substances render this moot)
– Will it have any effect on fastball spin rate?
If these are impacted, these might have an indirect effect on HR rates?
Have the Diamondback said that they will set the humidor to 50 percent and 70°F? If they read your articles and don’t want that big of a reduction in home runs, couldn’t they use a different value, say 40% humidity?
What would a 25%-50% reduction in HR rate translate to in terms of expected runs/game?
According to the articles I read, through 50%/70F is specified by MLB. My guess is that ultimately every team will store their baseballs in that environment.
Grip will improve at 50%, probably resulting in greater spin.
I think MGL comment about the 2mph is that the implication that the humidor will set the ball at Chase equivalent to what the ball is on the road.
Good stuff! For what it’s worth, I plugged the 2mph delta into the Deserved HR model (at BaseballHQ.com) and got a similar result: minus 27% HR for Chase field. I plugged in 3.8 mph and confirmed a 49% reduction.
Kanye West’s “Cream White” Adidas Yeezy Boost 350 V2 drops Saturday, but one sneaker retailer almost had to call off its launch in the wake of an alleged robbery.