A New Metric for the Skill Shown on Batted Balls

Players like Byron Buxton could soon benefit from a new batted ball metric. (via Andy Witchger)
Last year, Twins fans were treated to the emergence of uber-talent Byron Buxton. The former No. 2 overall draft pick regularly appeared on defensive highlight reels and showed an elite ability to run the bases. With his sprint speed, ranked by MLB Advanced Media (MLBAM) as being baseball’s best, Buxton was able to turn ordinary batted balls into close plays and possible hits. One example is this ball in play against the Astros last year:
Shortstop Carlos Correa made a great play here, diving to keep the ball on the infield and jumping quickly to his feet to unleash a strong, accurate throw to first. Even with that, Buxton’s tremendous speed turned this batted ball into a hit. The play is exciting yet predictable, given all we know about Buxton’s athletic talent. There was a strong chance of a single off the bat, an outcome which tends to be worth 0.9 runs towards the offensive team’s cause.
Yet MLBAM’s xwOBA, which measures the expected value of a batted ball based on Statcast data, pegs Buxton’s BIP as being worth just 0.392 runs—less than half of a single’s typical value. The metric seems to be missing something here, which is perhaps unsurprising given its fairly simple formulation: xwOBA takes a batted ball’s raw exit velocity and launch angle combination, and assesses its actual value, consulting nearby neighbors where necessary to expand the sample size. The aim of this process, according to MLB.com’s Statcast glossary, is to produce an output that’s “more indicative of a player’s skill than regular wOBA.” The entry adds that hitters “are able to influence exit velocity and launch angle but have no control over what happens to a batted ball once it is put into play,” a statement that suggests hitters can control the pair of batted ball readings and little else.
But that isn’t really true. The Buxton example is emblematic of how foot speed can matter. And it isn’t the only hitter attribute that will affect a BIP’s value after its speed and angle have been established. We need a batted-ball value stat that captures additional variables to get us closer to measuring batting output with skills. To that end, this article introduces a new wOBA-on-contact metric, called Batted-Ball Run Value, or BBRV for short.
BBRV’s Set-Up
Rather than incorporating a manual binning process, BBRV is built with a statistical model that parses through exit velocities, launch angles, and other variables to identify the drivers of run creation. More specifically, outcomes are modeled with a generalized boosted regression model (GBM), an accessible R implementation of Jerome Friedman’s gradient boosting machine that utilizes decision trees.
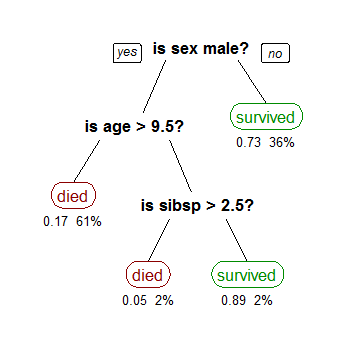
Maybe you’ve come across a basic decision tree, which models an event by separating a dataset into spaces. The resulting models are user-friendly but too simplistic, as a single decision tree tends to be overfit and perform poorly in out-of-sample testing. With boosting, this variance is reduced when a new tree is fitted to each current tree’s set of residuals. Over many tree-fitting iterations, the model distinguishes areas of underperformance and adapts to make more accurate estimates. To do so, the GBM handles non-linear relationships and interaction effects, features that should allow it to sift through the varying impact of different factors on a BIP outcome.
I used 13 variables to predict the multinomial output: the probability that a BIP will be a single, double, triple, home run, or out. Later on, probabilities were converted to a run value with the weights from Tom Tango’s standard wOBA equation.
| Category | Input |
|---|---|
| Attributes of the batted ball | Exit velocity, launch angle |
| Aspects of the hitter’s profile | Sprint speed, handedness, pull rate on that batted ball type, projected ISO |
| Conditions under which the ball was hit | Temperature, wind speed, wind direction, weather conditions, park, defensive efficiency |
| Additional context | Year |
Exit velocity and launch angle are flowed into BBRV, but not in their raw form. First, they were adjusted for park effects—the delta-style difference in each measurement for hitters at the given park and elsewhere. The goal of that step was to push “true” exit velocities and launch angles into the model, rather than those warped by park effects and measurement biases. Additionally, the two components were modeled separately based on a host of factors (including batted-ball type, hit location, and corrected pitch attributes) with the aim of substituting an estimate where raw exit velocities or launch angles appeared misleading. Details on that smoothing process are in the Appendix.
Sprint speed is included, of course, to help explain the ability to leg out infield hits and take extra bases on outfield hits. Batter handedness and pull rate on either grounders or air balls affects fielder positioning and the likelihood of success on a given batted ball. Projected ISO (per Steamer) acts as a control for how batter power can influence the depth of opposing outfielders. Ingrained in a hitter’s profile, these attributes are effectively part of batters’ true talent and influence their performance.
Also evaluated is the impact of temperature, wind speed, wind direction, weather conditions, and any remaining park effects. Defense also enters the equation; on grounders and pop-ups, the defensive efficiency of the fielding team’s infield is weighed, while the outfield’s out-conversion rate enters the picture on fly balls and line drives. These figures are for the full-season and split by batter hand; they aren’t exact representations of the defense on a given play, but serve as a proxy for the overall strength of a team’s defensive unit.
At first glance, the inclusion of these contextual factors may seem curious, since they’re not the batter’s responsibility. They were included with the intention of actively adjusting for their impact with the GBM’s ability to hone in on marginal effects when the other variables are held at their averages. More specifically, each factor would be neutralized for each hitter given their impact over the course of the season. Even though it was a sensible plan, these adjustments brought no benefit to the model’s performance and weren’t made in the end. By percentage influence, several of these conditional factors held little weight in estimating run value, anyway.
Full-Year Metric Performance
On a per-record basis, BBRV seeks to explain the value of each BIP. But remember, our real target with BBRV is the skill shown on batted balls. The best indication of this is through predictive power: how well a player’s BBRV corresponds to their future wOBAbip, which is the average actual run value generated by a player’s BIP. That isn’t to say that BBRV is intended to be a pure projection—age and injury history aren’t weighed, for instance—but the mark of success for the model is a stronger signal of future performance through a better understanding of hitters’ characteristics.
Let’s evaluate BBRV alongside other metrics that are used evaluate batter skill. Those would be xwOBA, actual current-year wOBAbip, and the BIP portion of Andrew Perpetua’s similarly-named xOBA, a stat which also goes beyond the basic xwOBA framework. Here and throughout this section, Spearman correlations were drawn, with comparisons weighted by a player’s total BIP (or harmonic mean of BIP, when year pairings are compared). Spearman correlations, based on ranks rather than raw figures, are more robust than the familiar Pearson formulation. We’ll also consider absolute error in this section, which is identically weighted and expressed in wOBA points. Data from 2015 to 2017 was used.
| wOBAbip | xwOBA (MLBAM) | xOBA (Perpetua) | BBRV |
|---|---|---|---|
| 0.516 | 0.532 | 0.536 | 0.571 |
By Spearman, BBRV emerges as the victor over the three other metrics. My stat has a 0.039-correlation lead over MLBAM’s xwOBA and a similarly high differenceover Perpetua’s xOBA. By absolute error, BBRV is off next year’s target by an average of 39 OBA points, whereas xwOBA averages 43.1 points away from the following season’s mark. It’s a good sign that BBRV is indeed providing enhanced insight into the skill shown on BIP.
At the same time, BBRV’s absolute error is nearly identical to Perpetua’s xOBA, which is 39.1 points. So while the Spearman figures indicate that BBRV is better at sorting future hitter performances in their proper order, xOBA is essentially equivalent in terms of raw error rate.
Keeping our focus on absolute error, wOBAbip misses its next-year self by 41.4 points. While BBRV and xOBA come in with better error rates (as they should), xwOBA comes in worse with its 43.1 mark. Those turned tables illustrate the room for improvement in MLBAM’s metric.
Given BBRV and xOBA’s advantage at predicting future performance on BIP, we might expect for both metrics to be fairly consistent from year to year. So next, let’s check the three batted-ball estimators’ ability to predict their future-year selves.
| xwOBA (MLBAM) | xOBA (Perpetua) | BBRV |
|---|---|---|
| 0.737 | 0.661 | 0.698 |
Interestingly, the results in this area are flipped: the weighted Spearman correlations identify MLBAM’s xwOBA as the “stickiest” metric of the bunch. It’s possible that this correlation is the product of xwOBA’s narrower emphasis on exit velocity and launch angle, two measurements that “stabilize” quickly. On the one hand, that strong ability to stay consistent is a good look for xwOBA. On the other hand, this result shouldn’t supersede lackluster predictive performance, which is of greater importance to this analysis. The bells and whistles of BBRV and xOBA introduce less stability, but I would still argue that those features are to the models’ benefit.
Mirroring previous results, the Spearman correlations indicate that BBRV is more reliable than xOBA. Yet once again, the absolute error tells a different story; xOBA comes in at 32.4 points away from its next-year self, while BBRV is at 33.9. When it comes to stickiness, there is more of a rank/error-size trade-off between the two stats.
The other full-year area we should examine is the metrics’ ability to describe current-year wOBAbip. MLBAM’s xwOBA was partly built for this capacity, so let’s see how the trio of metrics stack up.
| xwOBA (MLBAM) | xOBA (Perpetua) | BBRV |
|---|---|---|
| 0.813 | 0.870 | 0.862 |
Even though BBRV’s construction leans towards predictive ability, its descriptive ability comes out ahead of xwOBA by a sizable margin (and xOBA is even a touch better). Both my and Perpetua’s metrics are likely benefiting from the inclusion of additional descriptive variables. Unlike the other two areas tested, xOBA’s descriptive ability is tops in both Spearman correlation and absolute error, the latter of which is just 21 points. My metric hits the 23-point mark and xwOBA stands at 27.1 points.
In-Season Metric Performance
Beyond full-season evaluation, skill-oriented stats are often used to identify whether a player has been lucky or unlucky after a chunk of playing time. For BBRV to be useful, it should provide a benefit in this area. So let’s test the metric in a different way: by averaging BBRV out for hitters at various levels of playing time, and correlating those figures to the players’ end-of-season wOBAbip. How does the strength of BBRV’s signal change depending on how much playing time a hitter has amassed?
From the 431 qualifying batter-seasons in the 2015–2017 period, I extracted 350 randomly-selected batted balls. Then, BIP were ordered from 1 to 350 at random, with BBRV figures progressively computed as more playing time was piled up in each batter-season. To compare BBRV’s rolling performance with other baselines, the rolling computation process was duplicated for both wOBAbip and xwOBA.
Against all of these these rolling figures, I found the Spearman correlation to the actual, final wOBAbip posted in those seasons. Those correlations are charted below.

A close look reveals that BBRV tops the pack in small samples. More specifically, from 20 BIP through 110 BIP (after which point actual wOBAbip takes over), BBRV has the highest correlation to end-of-year performance. At 53 BIP, it reaches a 0.04 advantage over xwOBA that it doesn’t relinquish. That’s the predictive capacity of BBRV shining through. Does this mean that you should rely on BBRV instead of a hitter’s rolling projection from Steamer or ZiPS? No, but if you’re looking for an additional perspective on whether a strong early-season performance could last, BBRV is a viable option.
As a last step, let’s split this test by location. Are there differences in BBRV’s usefulness for home and road performance? I ran the same test as above, with the differences being a split of batter-seasons by home/road and BIP thresholds that were halved to 175.

My metric is a significantly better indication of end-of-year home performance than xwOBA. At 10 balls in play, BBRV’s correlation is better by 0.06, and that advantage reaches 0.09 at 40 BIP. With more playing time, that edge is a consistent 0.08–0.09. BBRV also maintains a lead on the road, albeit a slimmer one that peaks at 0.05 and averages a steady 0.02. The fact that my metric appears more predictive of home than road play isn’t surprising, since it relies on a regression that isn’t truly park-neutral.
Concluding Remarks
How could BBRV be improved? Rather than rely on the GBM, BBRV could utilize a mixed model, which might enhance its predictive ability by more effectively neutralizing environmental conditions. A stat that examines batting through that type of complex framework may be released soon by Baseball Prospectus’ stats team, so it will be interesting to see how it compares to BBRV.
But Mark 1 of BBRV takes a solid first step. I find that it’s highly competitive with xOBA and tests better from a rank standpoint, all while topping xwOBA both between and within seasons. If you’re trying to figure out whether to use the current editions of xwOBA or BBRV, the latter appears to get closer to the “expectation” that many people seek in these statistics.
As one final test, what does BBRV expect of that hit from Buxton in May 2017? It pegs that BIP as having a 74.5% chance of being a single, confidently signaling that Buxton was likely to reach first base safely. Converting the outcome probabilities to run value yields an output of 0.818 runs—much closer to a single’s 0.9 run value than xwOBA’s 0.392-run estimation. Here and for many other batted balls, BBRV benefits from getting a fuller idea of the context around the play and gives us a better picture of hitter ability.
Appendix: Extra Technical Details
The models used to predict exit velocity and launch angle were also GBMs and were constructed with 34 variables. While that was more factors than necessary, each model ultimately performed well in out-of-sample testing; the exit velocity model had a mean absolute error of 6.4 miles per hour, while the launch angle model had a MAE of 6.433 degrees. After the pair of models were built, my next step was to figure out when to deploy their estimates. That came down to finding cutoffs warranting the best-possible use of the modeled values instead of actual exit velocities and launch angles.
To that end, I built 64 different versions of the BBRV model, ranging from strictly raw readings to strictly modeled values. The model most predictive of future performance had mostly raw exit velocities, as there needed to be a 16.2 mph difference between the modeled and actual values such that my estimates were necessary. (In standard deviations of the residuals, that 16.2 mph represents 2.5 SDs.) On the other side, BBRV became more predictive by relying heavily on predicted launch angles—the difference on that front needed to be just 3.381 degrees, a 0.5 SD separation.
Separately from the smoothing process, the expected run value of bunts was evaluated in a separate GBM that didn’t include pull rate. Foul outs are included in BBRV too, but assigned a run value of zero and not modeled.
For batter-seasons to be evaluated in the main model and included in the metric performance comparisons, they were required to hit certain benchmarks:
- The given batter/bat hand/year combination needed at least 25 ground balls and 25 air balls.
- Batter-seasons needed a corresponding Steamer projection and sprint speed from MLBAM.
References and Resources
- Google doc with 2015–2017 full-year BBRV figures
- Raw Statcast inputs, xwOBA figures, and sprint speed measures are courtesy of MLBAM via Baseball Savant (xwOBA figures were downloaded on July 10)
- xOBA figures come from Andrew Perpetua’s Google doc (downloaded on July 21)
- Projections of hitter ISO are courtesy of Steamer
- Rob Arthur, No Little Plans, “Imputing Statcast’s Missing Data”
- Craig Edwards, FanGraphs, “What Can Statcast Tell Us Early in the Season?”
- Glenn Healey, The Hardball Times, “The Intrinsic Value of a Batted Ball”
- Glenn Healey, The Hardball Times, “The Reliability of Intrinsic Batted-Ball Statistics”
- Jonathan Judge, Baseball Prospectus, “Prospectus Feature: The Siren Song of Statcast’s “Expected” Metrics (For Pitchers)”
- Jonathan Judge, Nick Wheatley-Schaller and Sean O’Rourke, Baseball Prospectus, “Prospectus Feature: The Need for Adjusted Exit Velocity”
- Andrew Perpetua, The Hardball Times, “xStats and Fantasy Uses for Statcast”
- Gerald Schifman, The Hardball Times, “The Lurking Error in Statcast Pitch Data”
Great stuff Gerald! Every time I look through wOBA vs xwOBA laggards it’s a bunch of slow / likely shifted upon batters who are obviously going to create less value with a given ball in play than a superior runner / player who is defended straight up.
Quoting from Jay Jaffe’s excellent piece on replacement level 1B production around the league:
“He [Carlos Santana] has an 18 wRC+ when facing the shift as a lefty (166 PA), down from a 72 wRC+ last year, and a -4 wRC+ as a righty (albeit in a much smaller sample of 31 PA), down from 44 last year. Even including the balls that he’s hit over the wall when facing the shift, he’s still slugging just .349 under those conditions via Statcast.”
Are PA’s facing a shifted defense at all accounted for in this model?
Batter handedness and pull rate both enter the model and should act as a good proxy for the defense that each hitter often faces. Baseball Savant does produce shifting information in their game logs now, which could be useful in a future version of BBRV.
Thanks for the reply! I am really into this work attempting to quantify and account for everything classically attributed to BIP luck dragons.
Gerald: enjoyed this a lot. Very thoroughly and rigorously done. Looks like it will be a fun summer for batting metrics.
Thanks so much, Jonathan. I’ll be looking forward to the release of DRC+.
Great stuff! What were the variables that were used in the final model?
Thanks, Travis. The final variables are the 13 shown in the first table. I didn’t pare it down in this iteration.
Did you try to correct for xwOBA’s overall error this year? For the whole league it’s not centered at zero, it’s about 0.020 too high overall.
I mean it’s fair to be happy you don’t have the same skew, but still it’s kind of taking candy from a baby.
Gerald, for reference, I reviewed the issue here: https://www.fangraphs.com/fantasy/hard-xwoba-and-the-de-juiced-ball/
It’s evident xwOBA suffers greatly from its lack of year controls/fixed effects as well as potentially severe data collection/quality assurance issues in the first half of 2015.
I used 2015-2017 data for the analysis and output, so I didn’t delve into issues arising this season. But Alex’s piece speaks to the importance of including a year control in these metrics, which BBRV does have.
Great work, Gerald! Loved the read. Maybe I missed it, but will readers get the privilege to see a 2018 BBRV leaderboard? 🙂
Thank you. The analysis didn’t include 2018 data so those BBRV figures aren’t available yet.