A Tale of Two Dingers

Things are looking up a bit for Alex Rodriguez early in 2015. (via Keith Allison)
“It was the best of times, it was the worst of times.” With apologies to Charles Dickens, that quote describes almost perfectly the career of Alex Rodriguez, who has had more than his fair share of ups and downs during his time in the majors. On the one hand, he has been one of the most productive hitters of his generation. As of a few years ago, he was on track to break Barry Bonds’ career home run record. But then bad things started to happen: hip surgeries, suspensions, etc. Now he’s back again, and the big question is whether this season will again be his best of times or will it be his worst of times.
We will know much more in the coming weeks. However, if the start to the 2015 season is any indication, you might want bet on “best.” And nothing exemplifies that better than his offensive outburst on April 17, when Rodriguez belted two tape-measure home runs off the Tampa Bay Rays in a game at Tropicana Field.
According to StatCast, the first homer had the longest distance of any home run recorded thus far in the new season, where–as usual–the distance is an extrapolation of the actual trajectory to where the ball would have landed at field level had it not hit something else first. The second home run was not quite as impressive but a pretty good shot nonetheless. The full “slash line” from StatCast is summarized in Table 1. Note that the horizontal angle is measured with respect to straightaway center field, with negative indicating a hit to the left side.
| StatCast Parameters, Alex Rodriguez Home Runs |
|---|
| Home Run | Initial Speed (mph) | Vertical Angle (deg) | Horizontal Angle (deg) | Distance (ft) |
| HR1 | 107.3 | 26.1 | -11.9 | 471 |
| HR2 | 110.8 | 22.8 | -32.2 | 400 |
When I learned about these numbers, I immediately was puzzled why the distances on the two homers were so different given their similar launch conditions. In fact, HR2 came off the bat more than 3.0 mph faster than HR1, albeit with a slightly smaller vertical angle, yet it traveled a whopping 71 feet less.
I would have expected the carry distances to be much closer to each other. Could it be due to a variable wind? Not likely, since the game took place at a covered stadium where fly balls are not subject to variable atmospheric effects. So why the big difference in carry? To answer that question, I had to dig deeper.
The first place I went for additional information was the ESPN Home Run Tracker, which essentially confirmed the distances found by StatCast: 477 feet for HR1 and 389 ft for HR2. The numbers are off by a few feet from the StatCast numbers, but that did not concern me since I am trying to understand effects that are much larger than that. My first real clue to what was going on came from the apex (the highest point in the trajectory), which was 97 feet for HR1 and 63 feet for HR2. This immediately suggested that the HR1 was hit with considerably more backspin than HR2, providing more lift to counteract gravity, keeping the ball in the air longer so that it can travel farther.
At that point, I decided to go right to the source, Greg Rybarczyk, the inventor of the Home Run Tracker and now an analyst for the Red Sox. What I asked for and received from Greg was the “raw data” that goes into the Home Run Tracker algorithm, namely the precise coordinates where the baseball initially touched down and the hang time. I won’t bore you with the coordinate numbers, but the hang time is very revealing: 5.35 seconds for HR1 and 3.85 seconds for HR2, a difference of 1.5 seconds! This is qualitatively exactly what one would expect if HR1 were hit with much more backspin than HR2. Once again, more backspin means greater lift, keeping the ball in the air longer.
It is possible to be more quantitative and come up with reasonable estimates of the spin, both backspin and side spin, for each home run. To accomplish this, I used my trajectory calculator with the initial speed and angles set to the StatCast values. I then adjusted the amount of backspin and side spin as well as the average drag coefficient until the resulting trajectory passed right through the Home Run Tracker landing point at the measured hang time. The results are shown in Table 2:
| Parameters Inferred from Analysis of Home Run Tracker Data |
|---|
| Home Run | Backspin (rpm) | Side spin (rpm) | Drag coefficient | Distance (ft) |
| HR1 | 1848 | 226 | 0.314 | 479.2 |
| HR2 | 952 | 1551 | 0.385 | 388.7 |
My suspicions about the larger backspin for HR1 are confirmed by this analysis. Note that the total spin is very close for the two homers, but while the first has primarily backspin, the second has primarily side spin. The greater side spin for HR2 is consistent with what is known about the ball-bat collision, where balls hit down the line have much more sides pin than balls hit up the middle. I suspect Rodriguez undercut the baseball a bit more for HR1 than for HR2, leading to greater backspin. If high-speed video were available, it might be possible to confirm this suspicion. Note that the extrapolated distance agrees nearly perfectly with Home Run Tracker. That should be no surprise since the calculated trajectory is heavily influenced by the measured landing point, which is already very close to ground level.
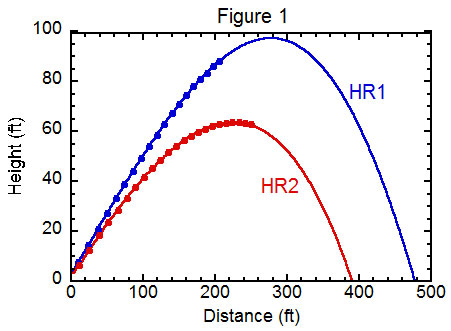
I could have stopped right there and declared victory. However, I decided to go for broke and see if I could obtain the actual trajectory data measured by StatCast. And that is exactly what I did. The data consist of a table of all three coordinates (x,y,z) at 1/100-second time intervals. Some of the data are shown in Figure 1, where I have plotted the height of the ball above the ground versus the horizontal distance from home plate. The points show the actual tracking data; to keep the plot uncluttered I have plotted only every 10th point. I will explain the line shortly.
The first thing that stands out in these plots is how different the two trajectories actually are. Given their similar initial velocities and vertical launch angles, the two fly balls start out on similar trajectories but very quickly diverge from each other, reaching greatly different apexes and total distances.
The next thing to notice is that the tracking is incomplete and terminates close to the apex. This is not at all uncommon for the TrackMan system used to obtain the data, as I discussed in my recent article, “Testing TrackMan: Just How Well Does TrackMan Work?” TrackMan uses a proprietary algorithm for extrapolating the partially-measured trajectory back to field level, and it was that technique that StatCast used to obtain the distance. The experiment reported in the linked article shows that the TrackMan algorithm does an excellent job in determining the landing location.
I used my own technique for extrapolating the trajectory, essentially identical to the one used to get the results in Table 2. I used my trajectory calculator to adjust the values of backspin, side spin, and drag coefficient to fit the StatCast trajectory data. Having obtained the best-fit parameters, I can then extrapolate it to ground level to find the distance and total hang time. The resulting trajectories are the solid curves in Figure 1, and the parameters are presented in Table 3.
| Parameters Inferred from Analysis of StatCast Trajectories |
|---|
| Home Run | Backspin (rpm) | Side spin (rpm) | Drag coefficient | Distance (ft) | Hang Time (sec) | Apex (ft) | az0 (ft/s2) |
| HR1 | 1625 | 237 | 0.312 | 479.2 | 5.691 | 97 | -28.7 |
| HR2 | 939 | 2102 | 0.364 | 391.2 | 4.154 | 62 | -41.4 |
These parameters represent our best shot at understanding the difference between the two trajectories. The backspin and side spin values are rather similar to those in Table 2 and confirm that the difference in backspin plays a major role in the different values for distance, hang time, and apex of the two home runs. The last column is the initial vertical acceleration, including contributions from gravity, drag, and the upward lift due to the backspin. The downward (negative) acceleration is greater for HR2, reflecting the smaller upward lift relative to HR1 and leading to a lower apex, a smaller hang time, and ultimately a shorter distance.
It is still a bit puzzling to me that the inferred drag coefficient is so different for the two homers, although variations from one ball to another are expected. Despite the significant difference in drag coefficients for the two home runs, these do not play a large role in the carry distance. If I calculate the distance of HR2 with the drag coefficient set to be the same as for HR1, but with everything else the same, I find the distance increases by 26 feet, from 391 to 417 feet. On the other hand, if I instead make the spin values for HR2 the same as for HR1, I find the distance for HR2 increases 60 feet, from 391 to 451 feet. It is clear that the difference in spin is the primary factor that contributes to the difference in distance.
So my initial puzzle as to why there was such a great difference in distance between these two home runs has been resolved. Multiple analyses using both Home Run Tracker and StatCast data show the primary reason for the different distances is the backspin. Everything hangs together nicely. In fact, the closeness of the StatCast distance to the independently determined distance from Home Run Tracker provides additional confirmation that the TrackMan algorithm for extrapolating from the measured trajectory to ground level is very robust. The StatCast era is upon us, and it will be very exciting to see what new things it will teach us about the game of baseball.
References & Resources
- Thanks very much to Greg Rybarczyk for sharing his Home Run Tracker data.
Terrific article Alan. Did StatCast give a value for the total spin on each Home Run and if they did was it consistent with the implied total spin from your calculations? Also, Hit Fx would have given you a horizontal angle off the bat and Hit Tracker would give you the actual landing points and that would be one way to confirm the amount of side spin. In your previous research did you find variations in the drag coefficient between different MLB balls as great as the implied difference here?
Since StatCast uses Trackman for the batted ball, the initial spin is known. But I don’t have that information myself. But your question is a good one. Regarding the side spin, if you look at the sidespin in Table 2, that was determined just as you described, since I used Trackman for the initial velocity vector and Home Run Tracker for the landing. In Table 3 I used only Statcast trajectory data. You can see that the side spin is not exactly the same as before. One additional thing to do is use all the data simultaneously. But it is hard to know how to attach relative weightings to the Home Run Tracker and StatCast data, and that would be essential to finding the overall solution. The answer to your drag coefficient question is “yes”. Unfortunately the article is behind the pay wall, but you can find it on my web site: http://baseball.physics.illinois.edu/FlyBallDistance.pdf.
Your spin argument is consistent with the fact that the homer in the second inning was hit to center field resulting in more backspin than side spin. The homer in the 6th was pulled to left resulting in substantial side spin compared to back spin. Nice work.
There is a curious thing about the effect of side spin that I only recently started to appreciate. Because the relationship between spin and movement is nonlinear, a ball hit with a certain amount of backspin will have greater lift if the side spin is reduced. So, balls hit to CF with backspin but little side spin will have greater lift than balls hit down the line with the same backspin but lots of side spin. Moreover, there is a second effect. The sidespin makes the ball curve in the horizontal plane. As it curves, the backspin becomes less effective at producing lift. More technically (and I tried to avoid this language in the article), the horizontal component of the spin vector (i.e., that due to backspin) starts out perpendicular to the horizontal component of the velocity, producing maximum lift. But as the latter curves away from its initial direction, it ceases to be perpendicular to the former, so that there is less lift. While I have always understood that these effects might exist, I never appreciated how bit they can actually be. I have learned a lot by doing this analysis. And that’s a good think!
Sorry…I got carried away and was typing too fast. In the last two lines, “bit”=”big” and “thing”=”thing”.
Oy! “think”=”thing”
Hi Alan,
Since Statcast use radars to track the path of the ball, do you think the distances given are more accurate than Hittracker? I know Greg has to pinpoint the landing spot of each homerun on a diagram of the stadium, which calls for some guessing. Do you know if Statcast’s data are automatically processed without any subjective calculations whatsoever? If it’s the case, that should decide the issue.
For example, Josh Donaldson’s blast last night was given at 481 ft by Statcast (113.5 mph exit speed), and 469 ft by Hittracker (120.5 mph exit speed)…That’s a big difference. Who tells the truth?
I love Hittracker since it’s inception in 2006, but Statcast might be the real deal now that it takes out any ambiguity with all its radars. Or maybe not…
My own measurements show that Trackman (the radar used in StatCast) gives very accurate distances when the ball is tracked to the landing point. But many are not tracked all the way. Indeed, the two in this article were only tracked to near the apex. In such cases, an extrapolation has to be made. As I mention in the article, a proprietary algorithm is used to do that. I have my own algorithm, which is not the same as is used.
Notice that I haven’t answered your question yet. Quite frankly, I would like to see a more comprehensive comparison between StatCast and Hittracker. The data already exist to do that. But what we don’t know for StatCast is which homers were tracked to their initial landing point and which were not. That would be valuable information to have in comparing the two.
My best guess is that the two techniques will be very close for balls that are tracked to their initial landing point. I would reserve judgment for those that are not.
Interesting that they lose batted balls in midair that often. Do you know how robust their tracking is of the relevant people on the field as a play progresses?
Sorry, I am completely unfamiliar with the Chyron/Hego camera system used to track the people on the field. The ball tracking uses Trackman, which I have actually used myself and am pretty familiar with.
Giving me some unwanted flashbacks to my physics class. Great info as usual.