Aging Curves Revisited: Damn Strikeouts

Strikeouts are a big culprit to a hitter’s downturn as he ages. (via Ian D’Andrea)
Seven years ago, I found that the PED era was hiding that hitters were peaking earlier. I’ve created various aging curves since that article (including the award–winning series I did with Bill Petti on pitchers) and never found anything out of place. A few times recently, I’ve been asked to revisit the data since the article is six years old and seems dated. I re-ran the numbers and found some pitching adjustments have changed the strikeout aging factors for both hitters and pitchers and, therefore, the overall curves.
My goal was not to go too in-depth into every possible stat. I didn’t delve into every little detail. Instead, I focused on major trends and, when necessary, dove in a little deeper. I used a total value measurement for both pitchers and hitters. Additionally, I compared strikeout rate, walk rate, batting average on balls-in-play (BABIP), and how hard the ball was hit (ISO for hitters, HR/9 for pitchers). Any changes in how players age would be apparent in these metrics and then investigated further.
For the curves, I used two time intervals, from 2005 to 2012 and from 2012 to 2019. Any time before 2005, the aging curves seemed to defy logic. It was as if the players found a secret elixir to keep them from aging.
To create the new curves, I used the delta method by weighting plate appearances by the harmonic means. This method has a small survivor bias summarized by Mitchel Lichtman here at the Hardball Times.
… survivor bias, an inherent defect in the delta method, which is that the pool of players who see the light of day at the end of a season (and live to play another day the following year) tend to have gotten lucky in Year 1 and will see a “false” drop in Year 2 even if their true talent were to remain the same. This survivor bias will tend to push down the overall peak age and magnify the decrease in performance (or mitigate the increase) at all age intervals.
Another correction I didn’t include when I first started creating aging curves is a major league-wide adjustment. If major league-wide power increased over several seasons, as with the current juiced ball, I corrected the curve to remove this trend. The overall goal is to learn whether players are changing, not the whole major leagues. I’ll start with batters.
Batters
It’s great that wRC+ exists. It’s perfect for spotting aging trends because it sets several variables, like home parks, to a neutral level.
When I compared aging curves a few seasons back, I found hitters peaked earlier, which is likely from better and earlier training. That trend continues with hitters peaking around age 26 as seen here.
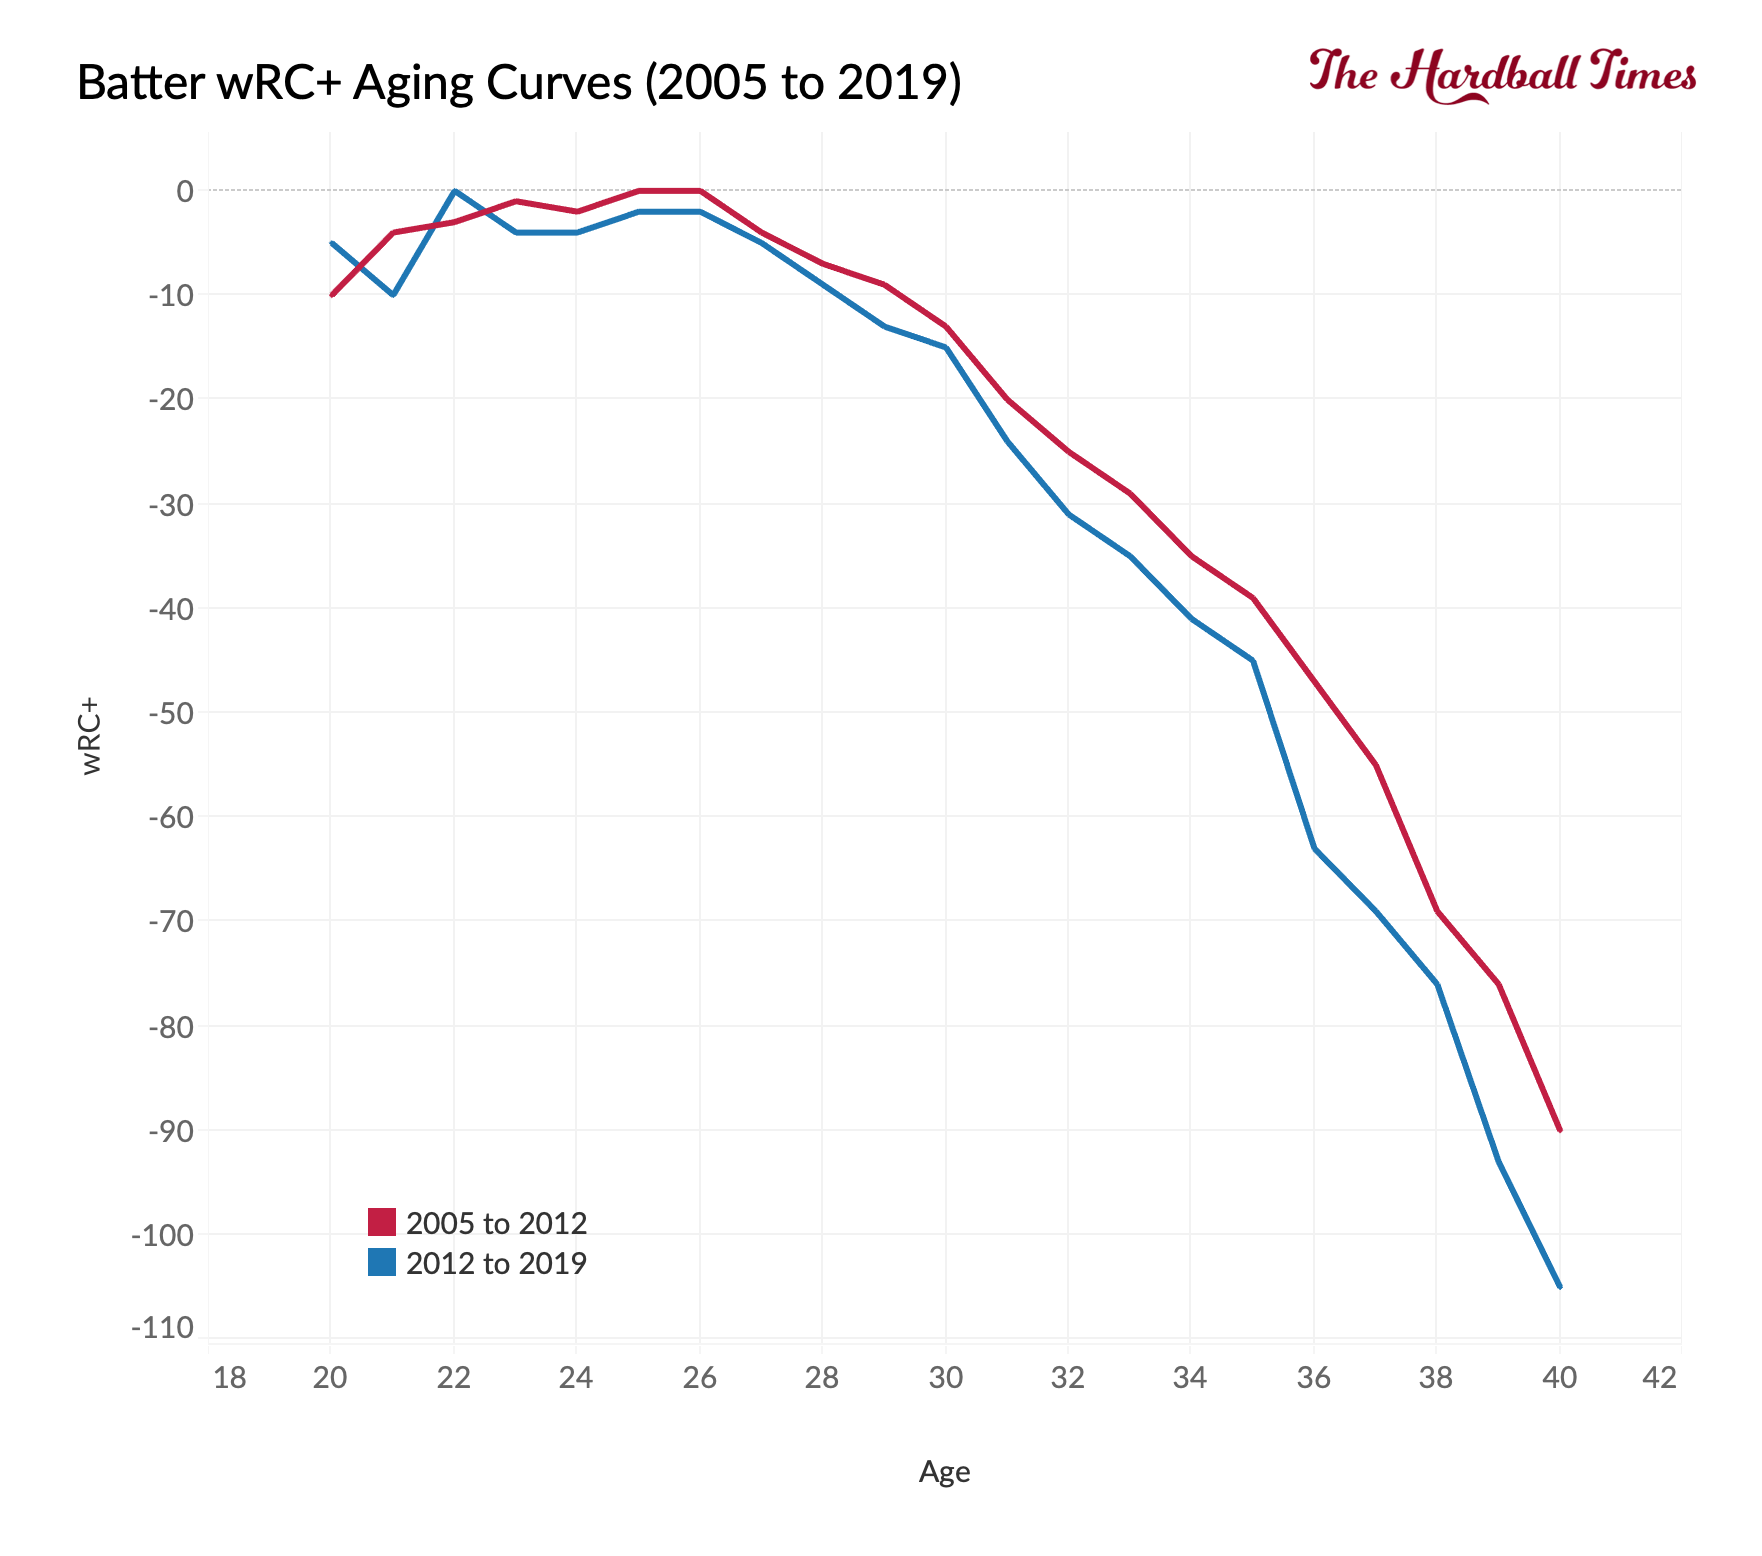
One noticeable change is that hitters seem to be aging faster, especially after their age-30 season. To find out why, each core stat must be examined.
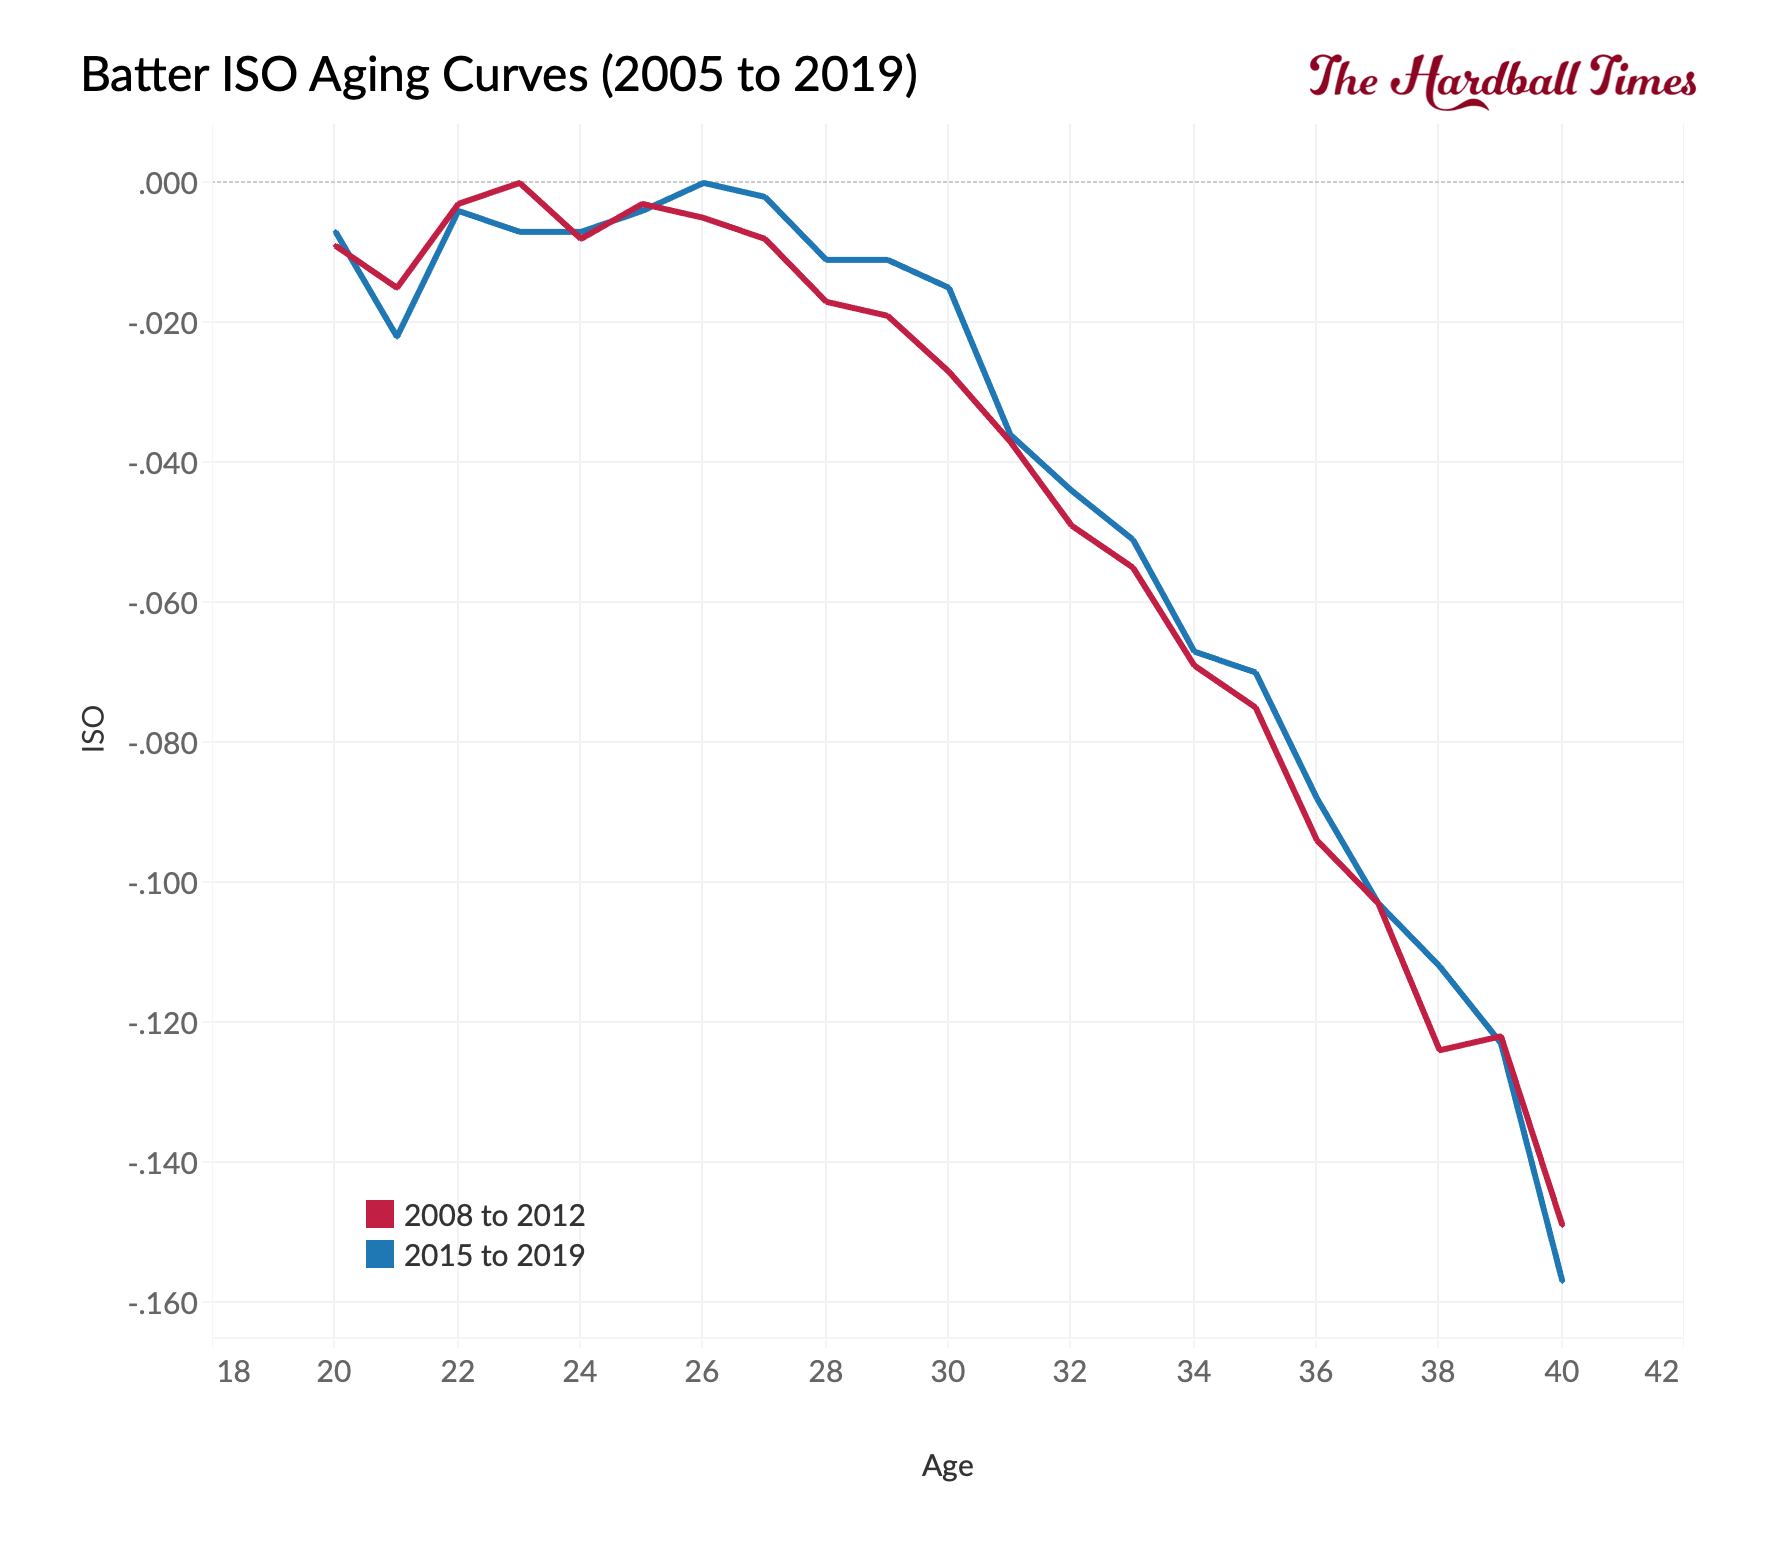
To start with, the isolated power (ISO) aging curve remains constant with the decline starting in the late 20s.
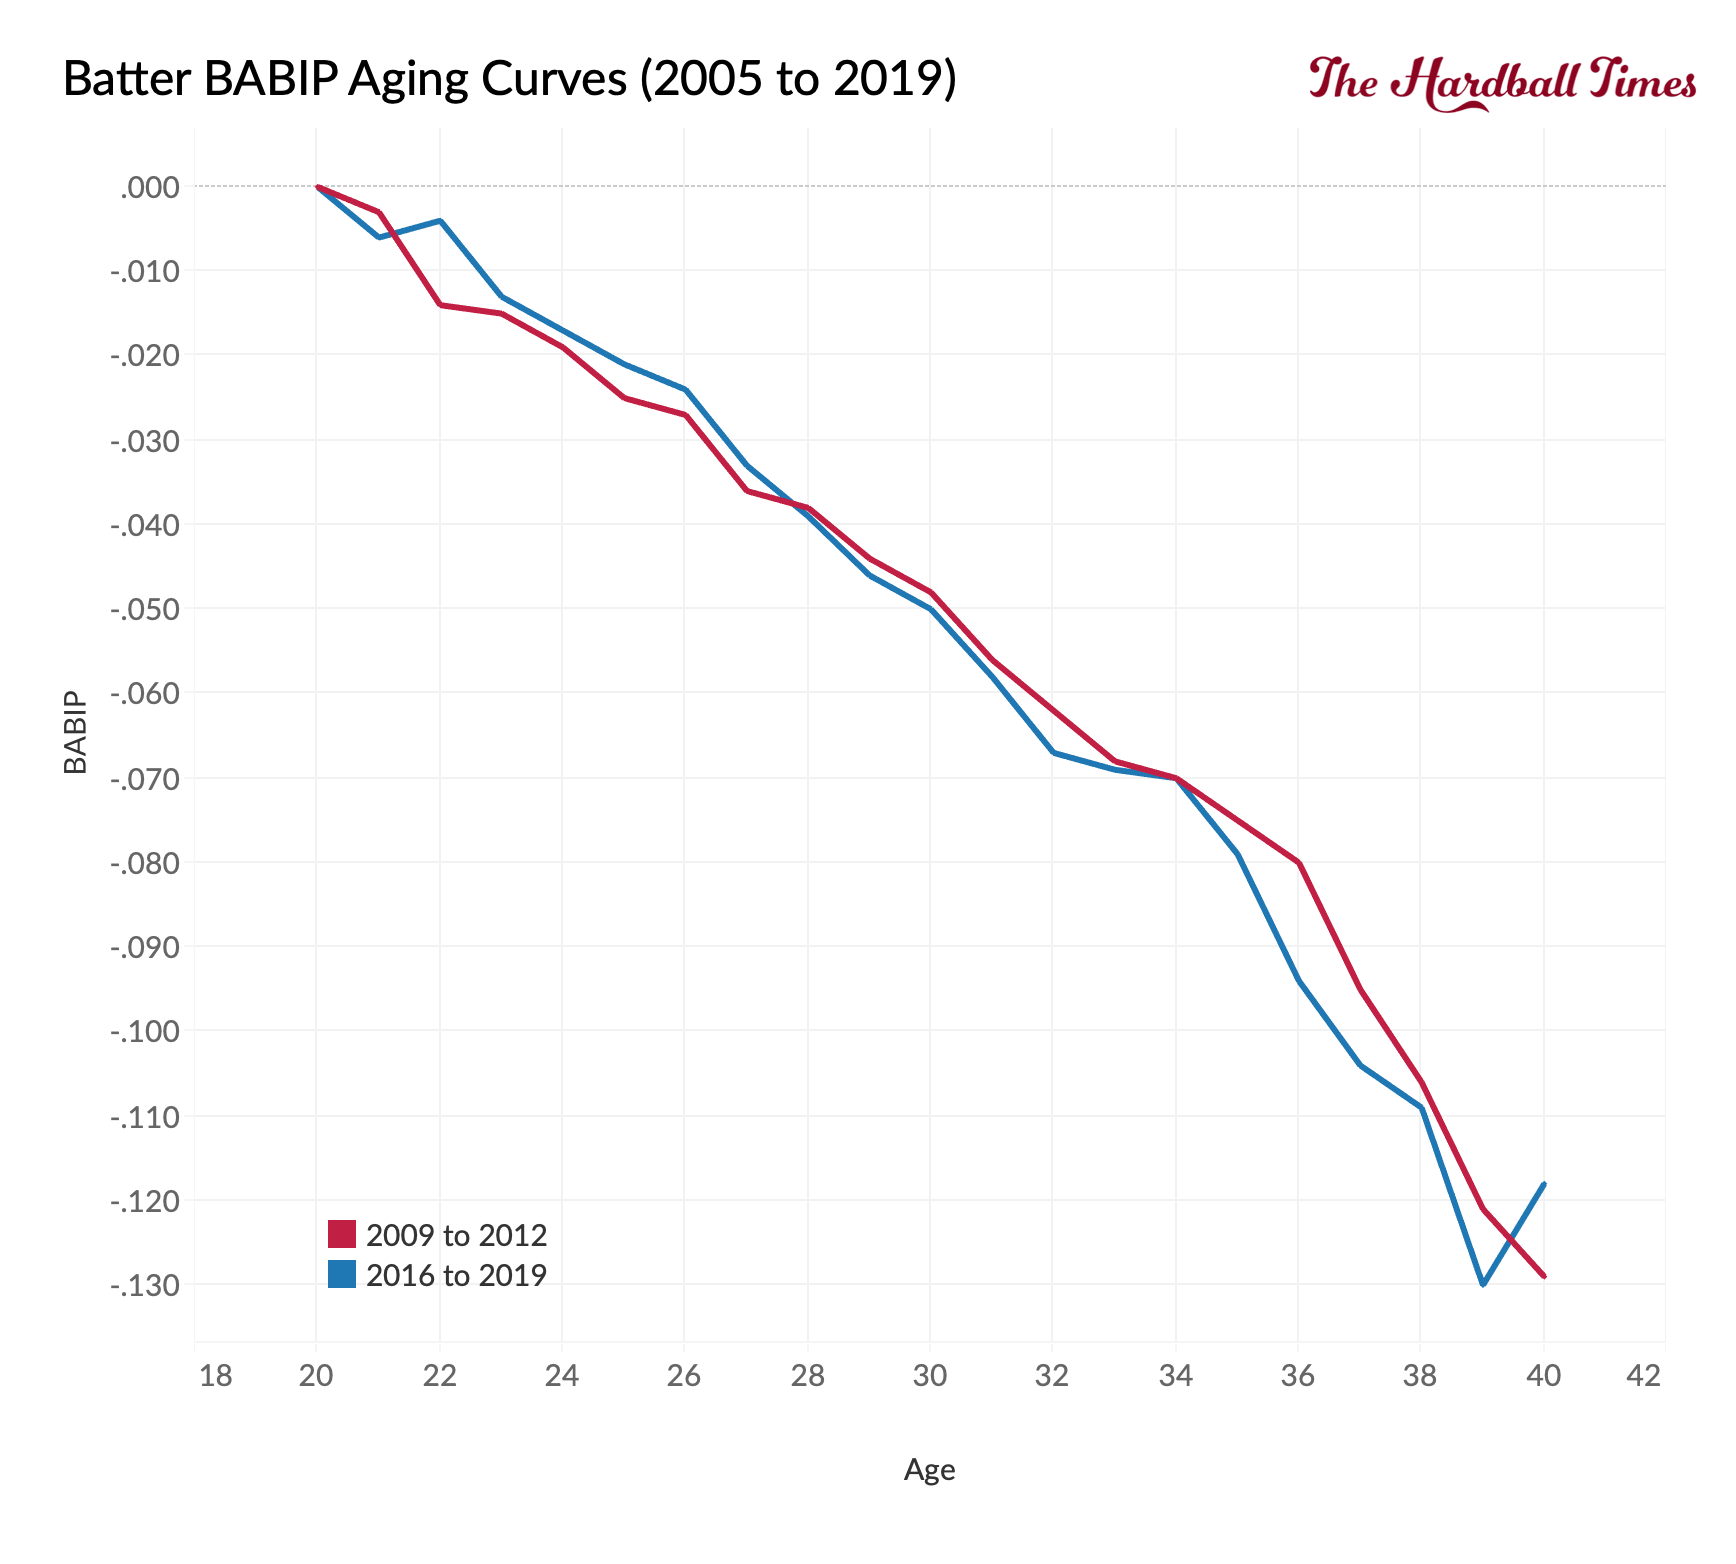
BABIP has stayed the same. I thought it might drop faster with more teams shifting.
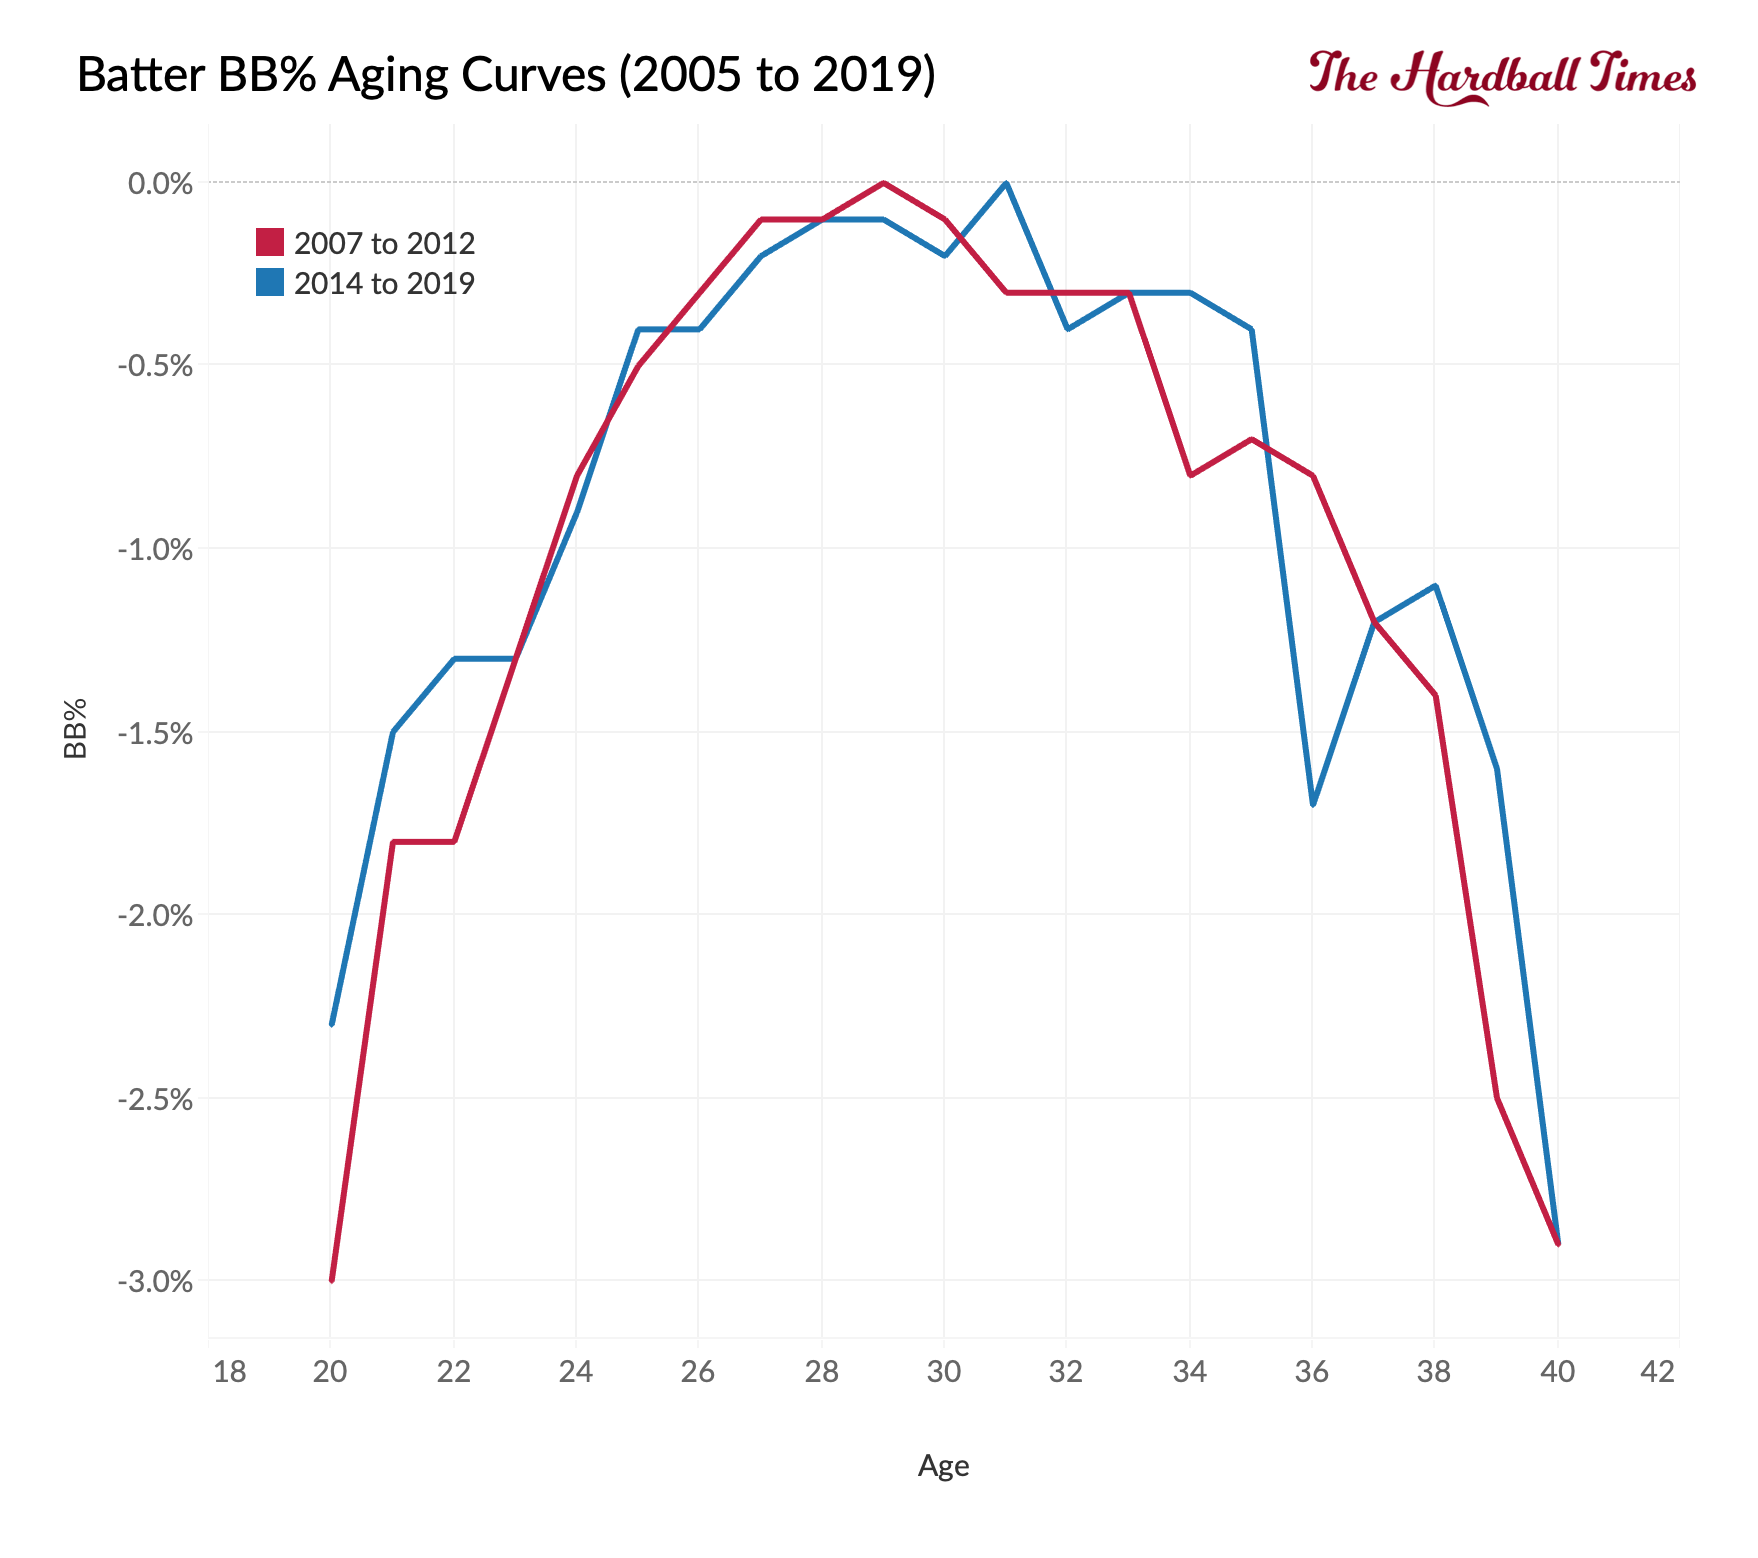
And while a little bumpier, the walk rate aging curve has stayed constant.
It’s obvious I saved the instigator, strikeout rate, for the end.
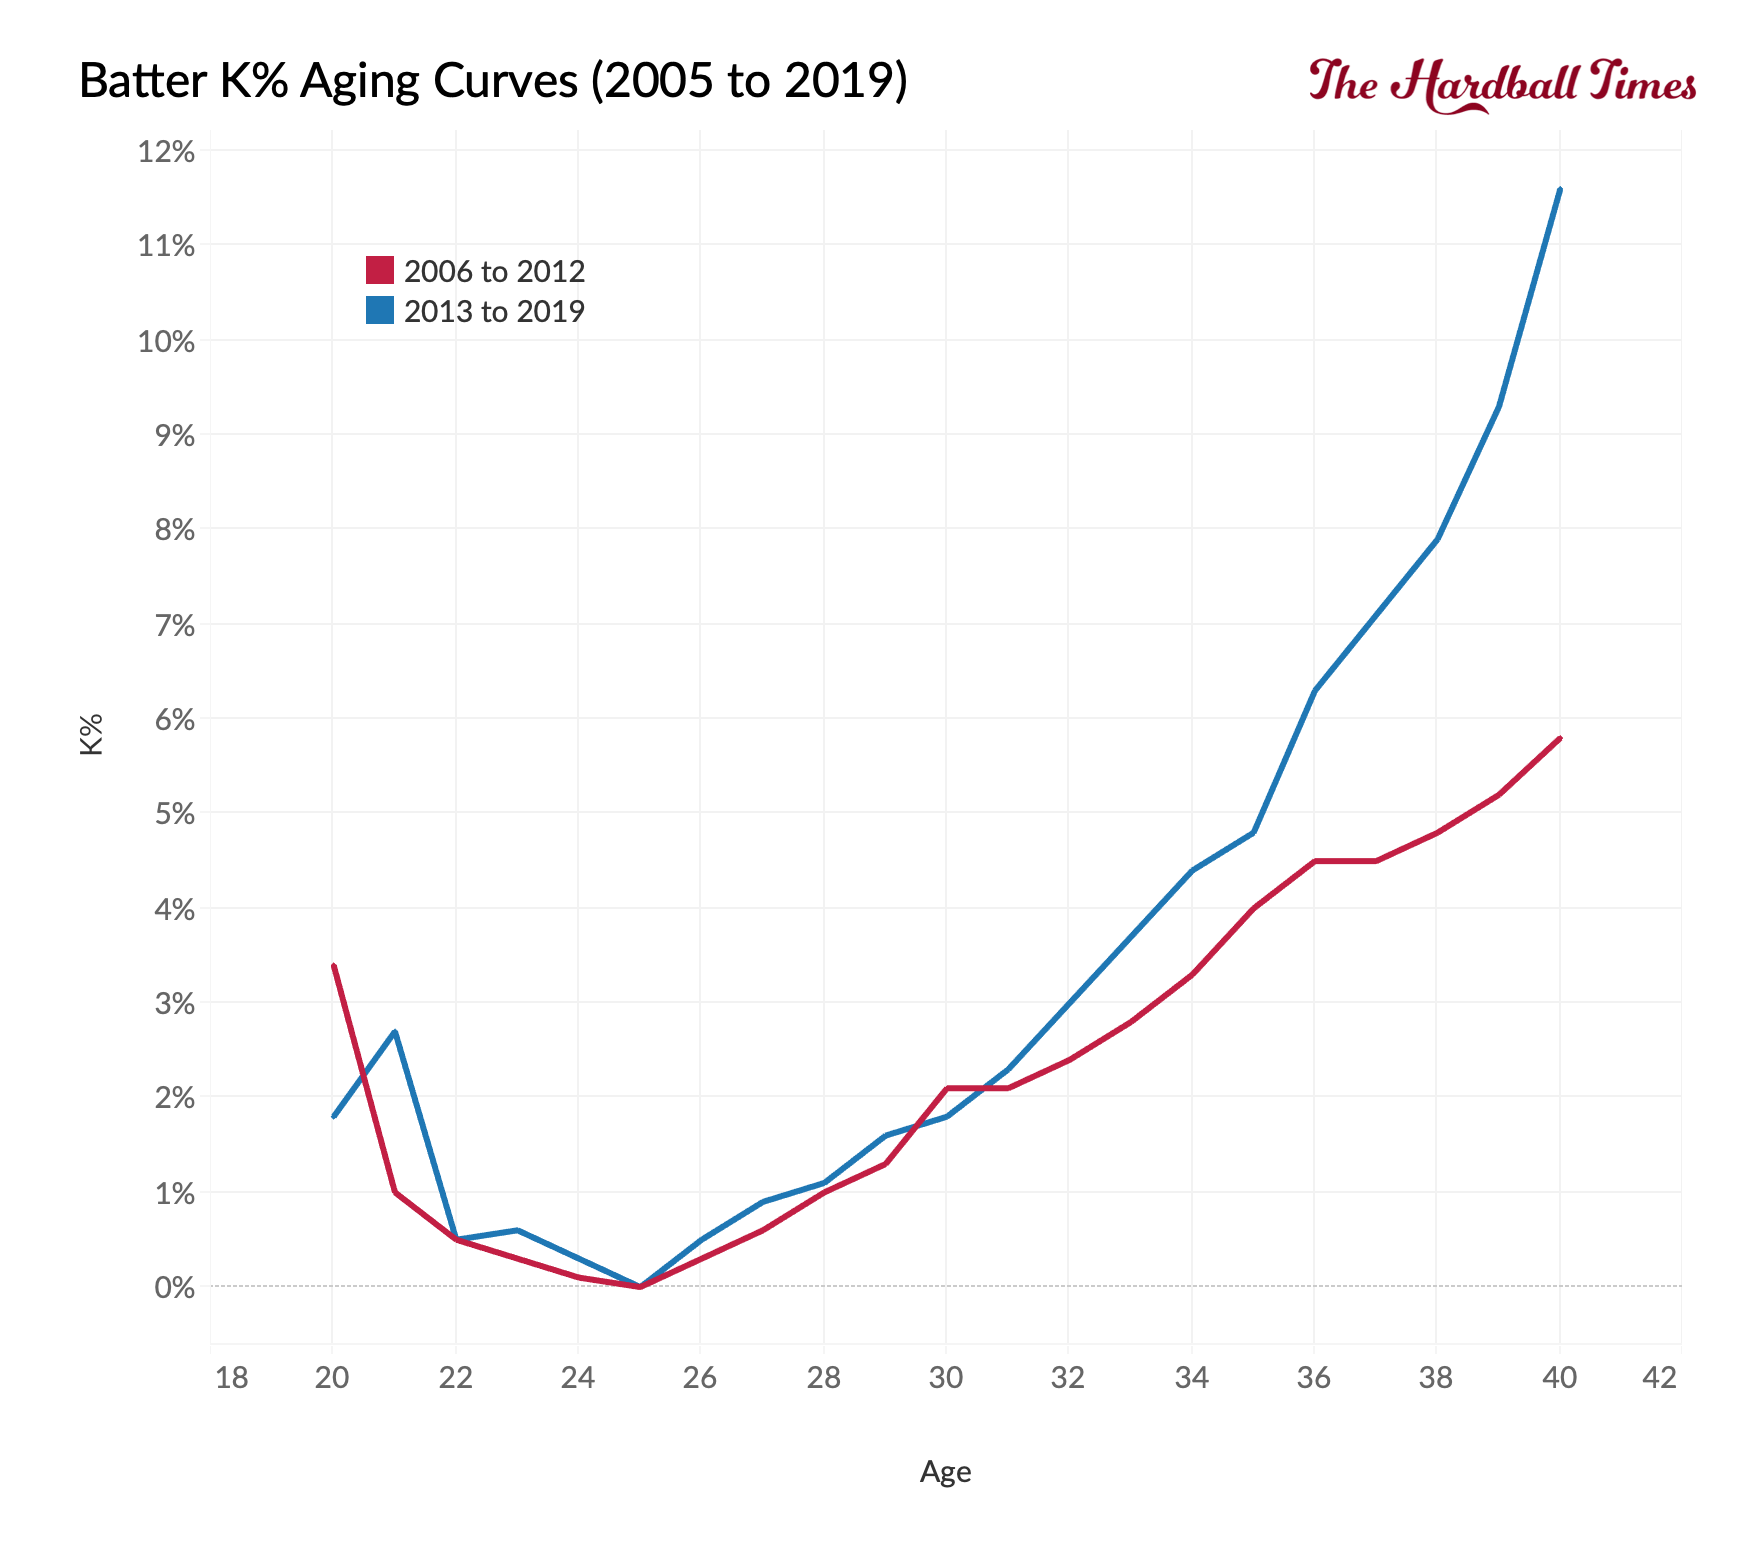
The average hitter’s strikeout rate has increased at a faster rate once a hitter ages past his age-30 season. I had several theories why this was happening, but it becomes obvious once the pitchers are examined.

Pitchers
The pitcher results mirror the hitting curves with not many changes. To show the overall pitcher aging trend, I used ERA-. As with wRC+, it adjusts to major league-wide differences, where a value of 100 is league average.
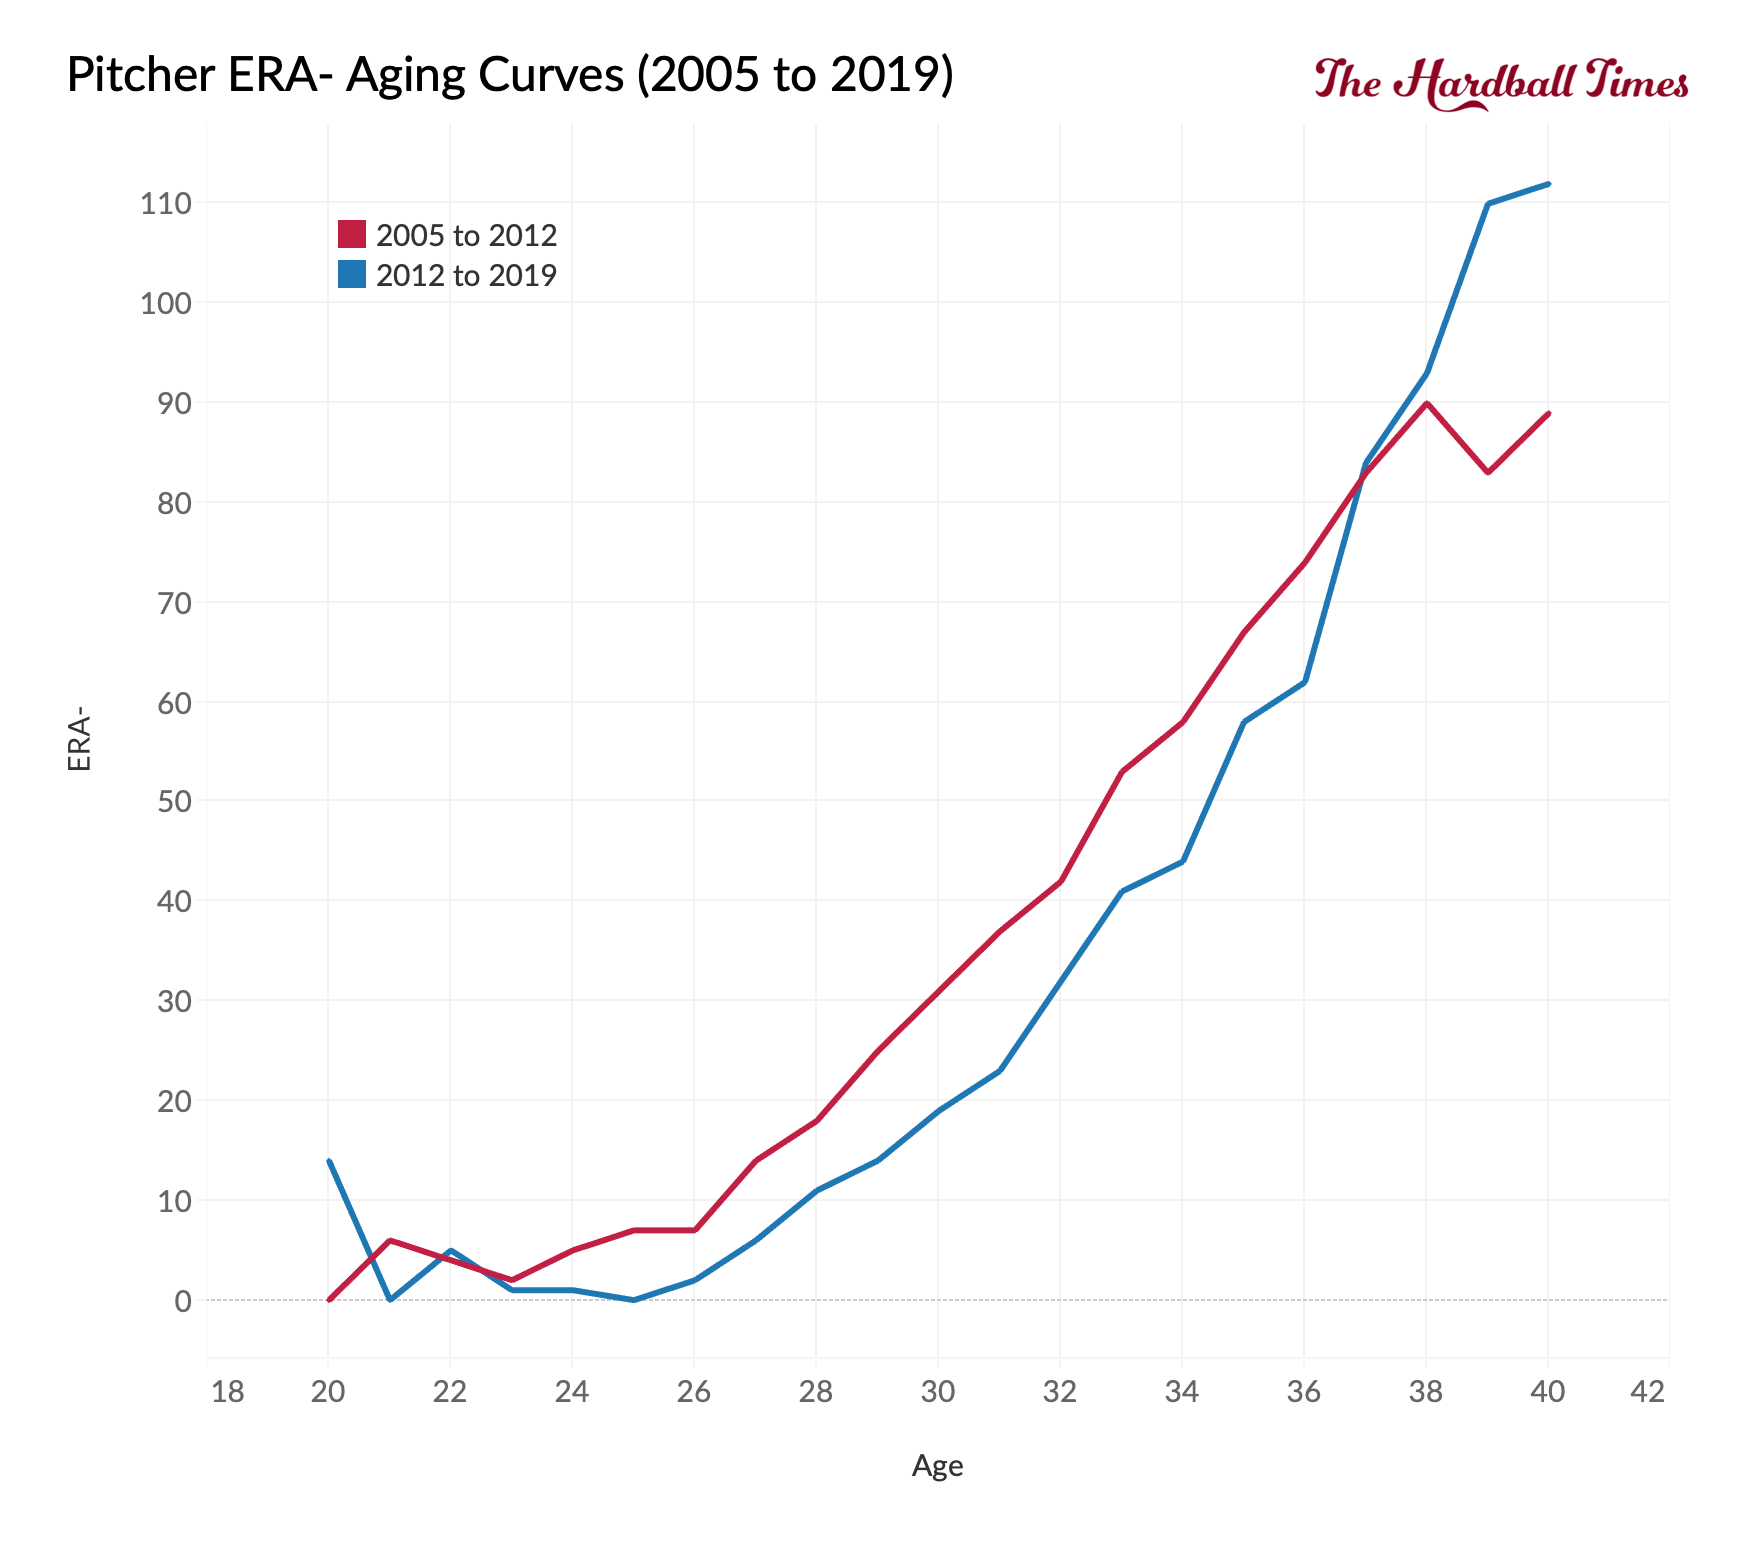
Pitchers no longer have an immediate, steady, steep drop. It’s a little more curved even though it eventually declines. The next step is to see if anything besides strikeouts is to blame for the changes.
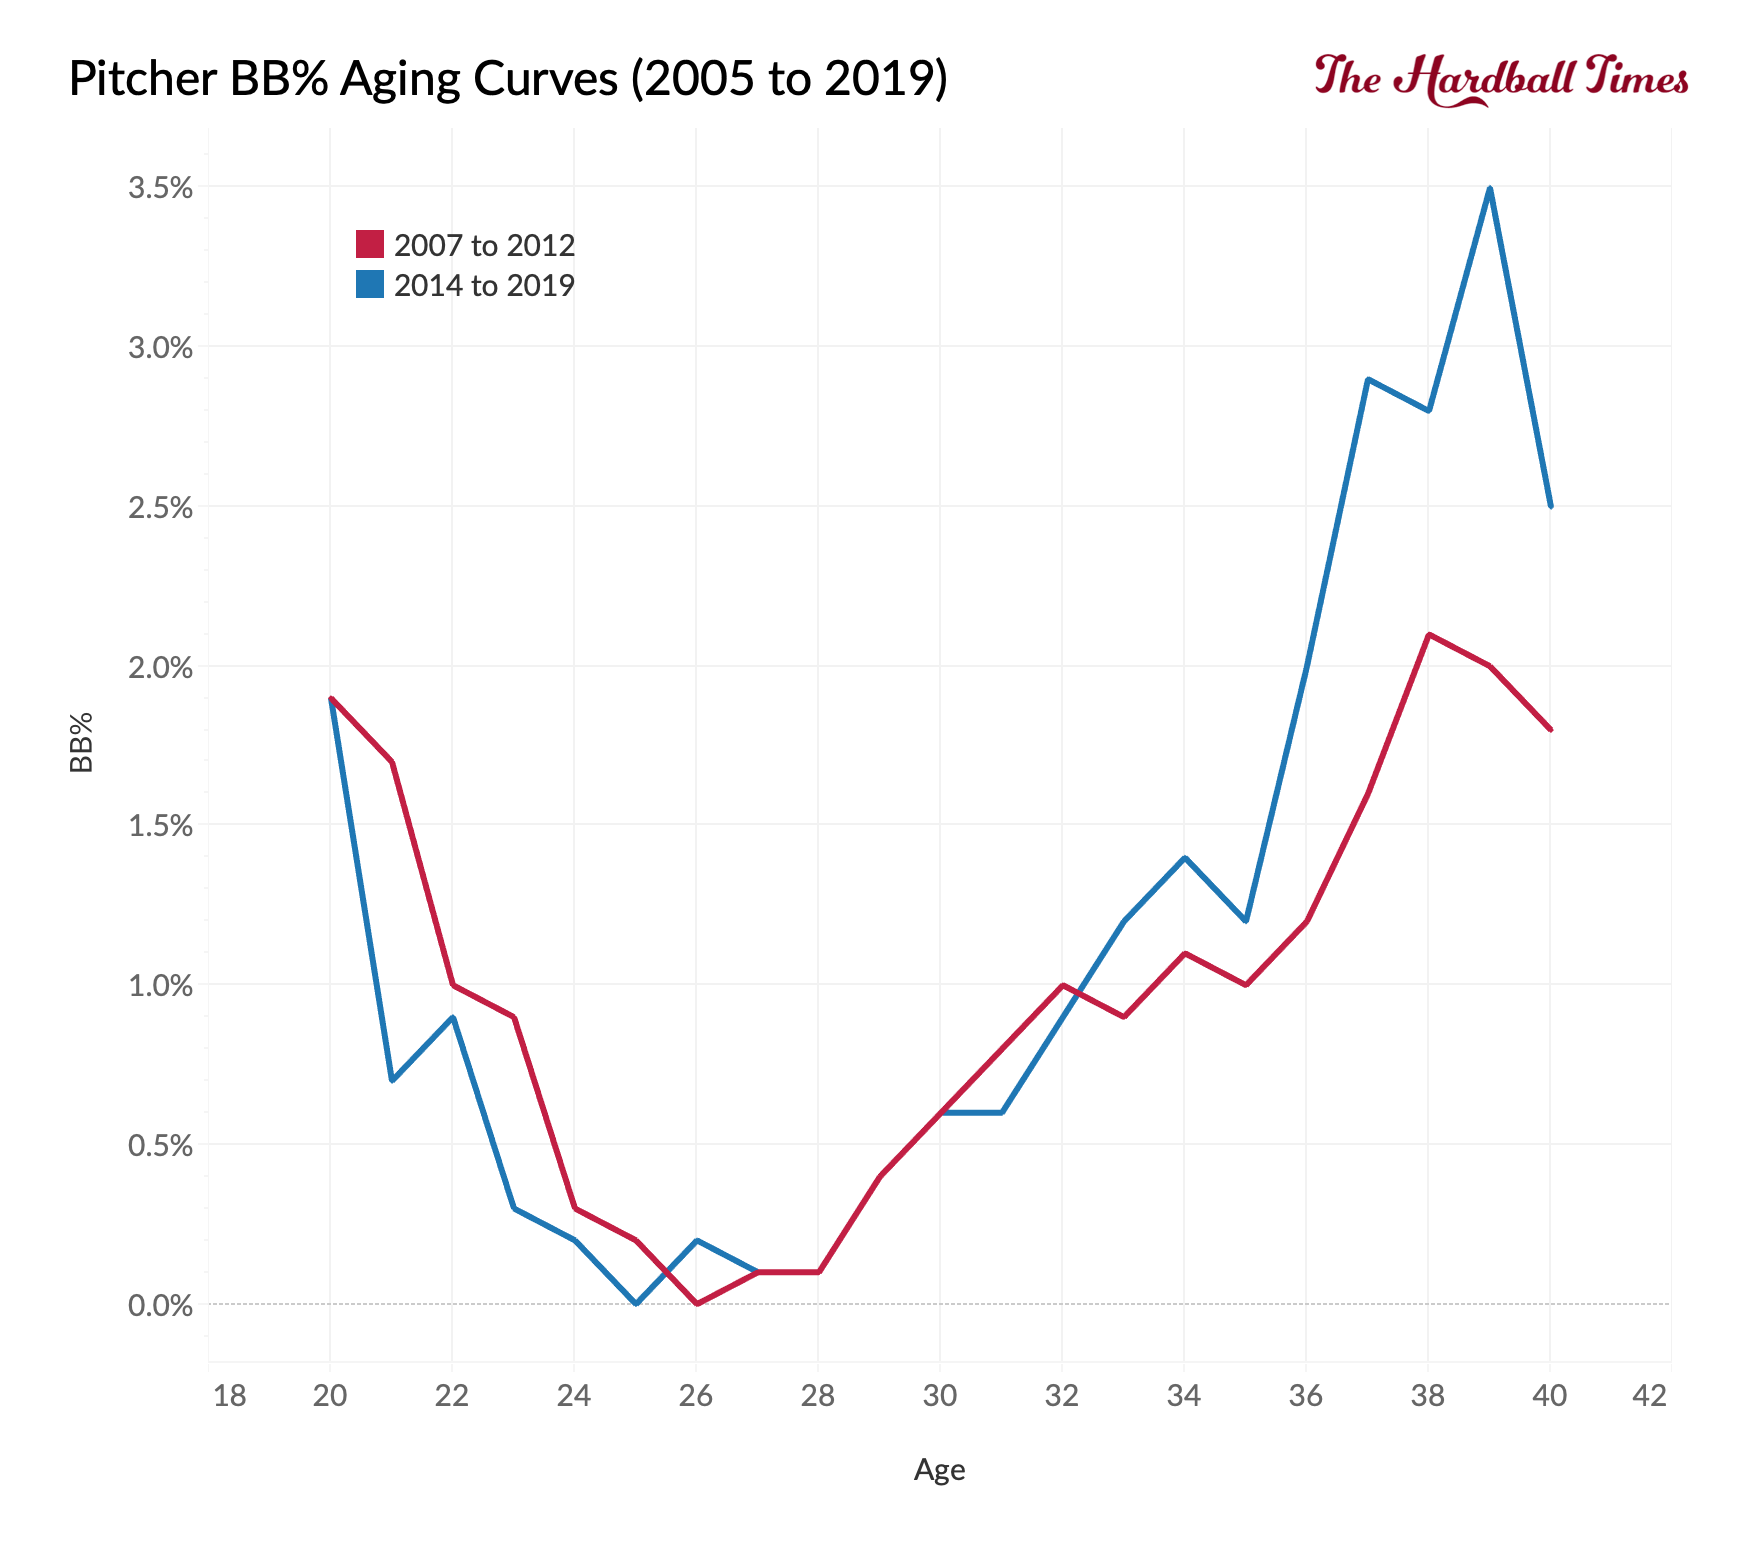
None of the new aging curves differ from the older ones. Walk rates bottom out around age 26 and then head back up.
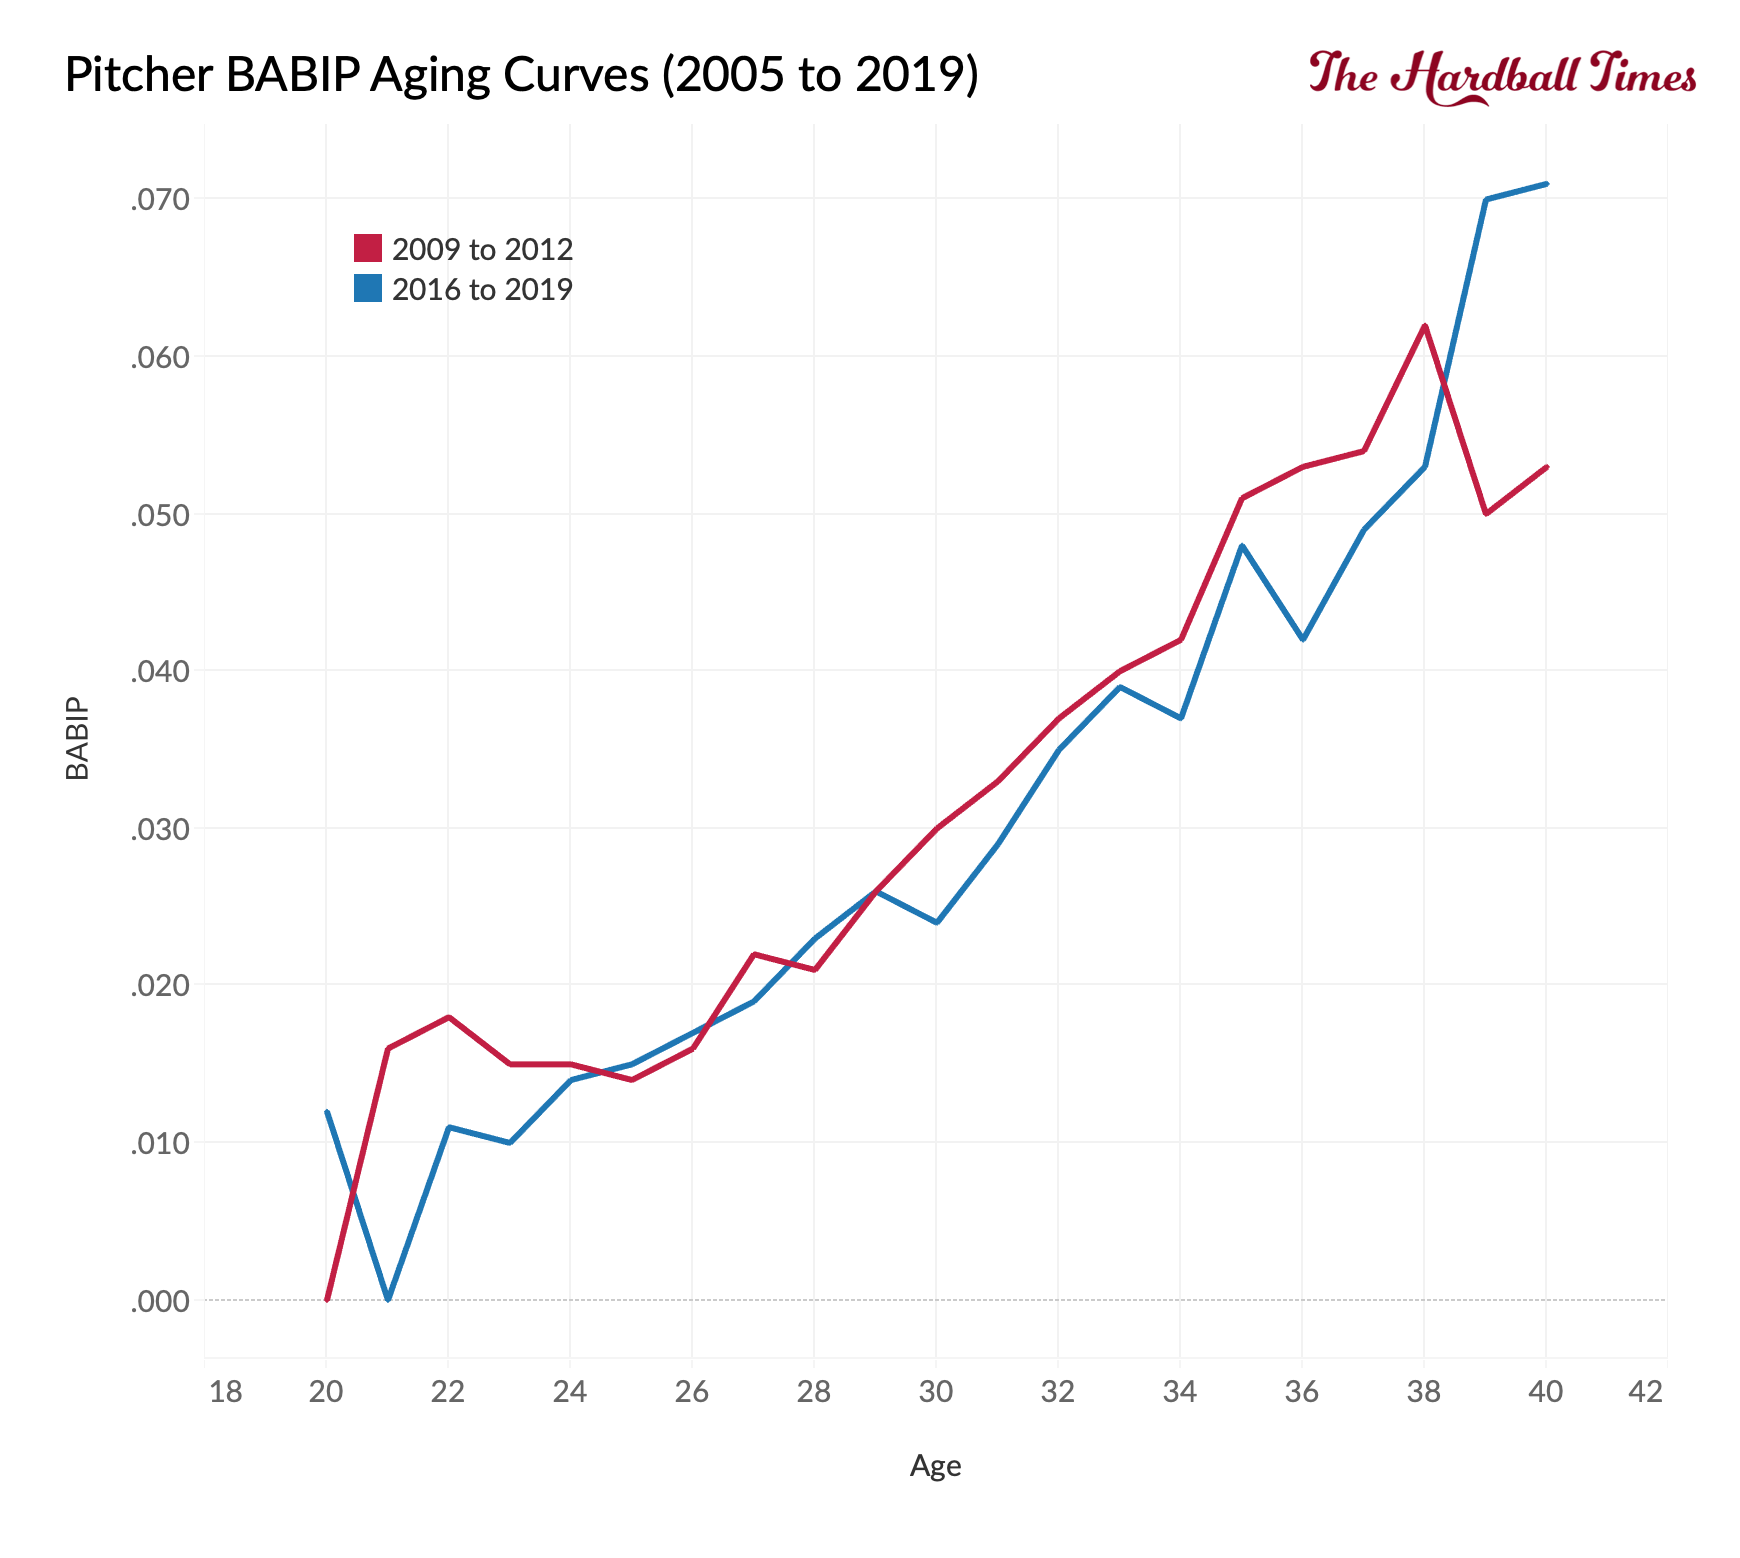
BABIP steadily climbs once a pitcher enters the league.
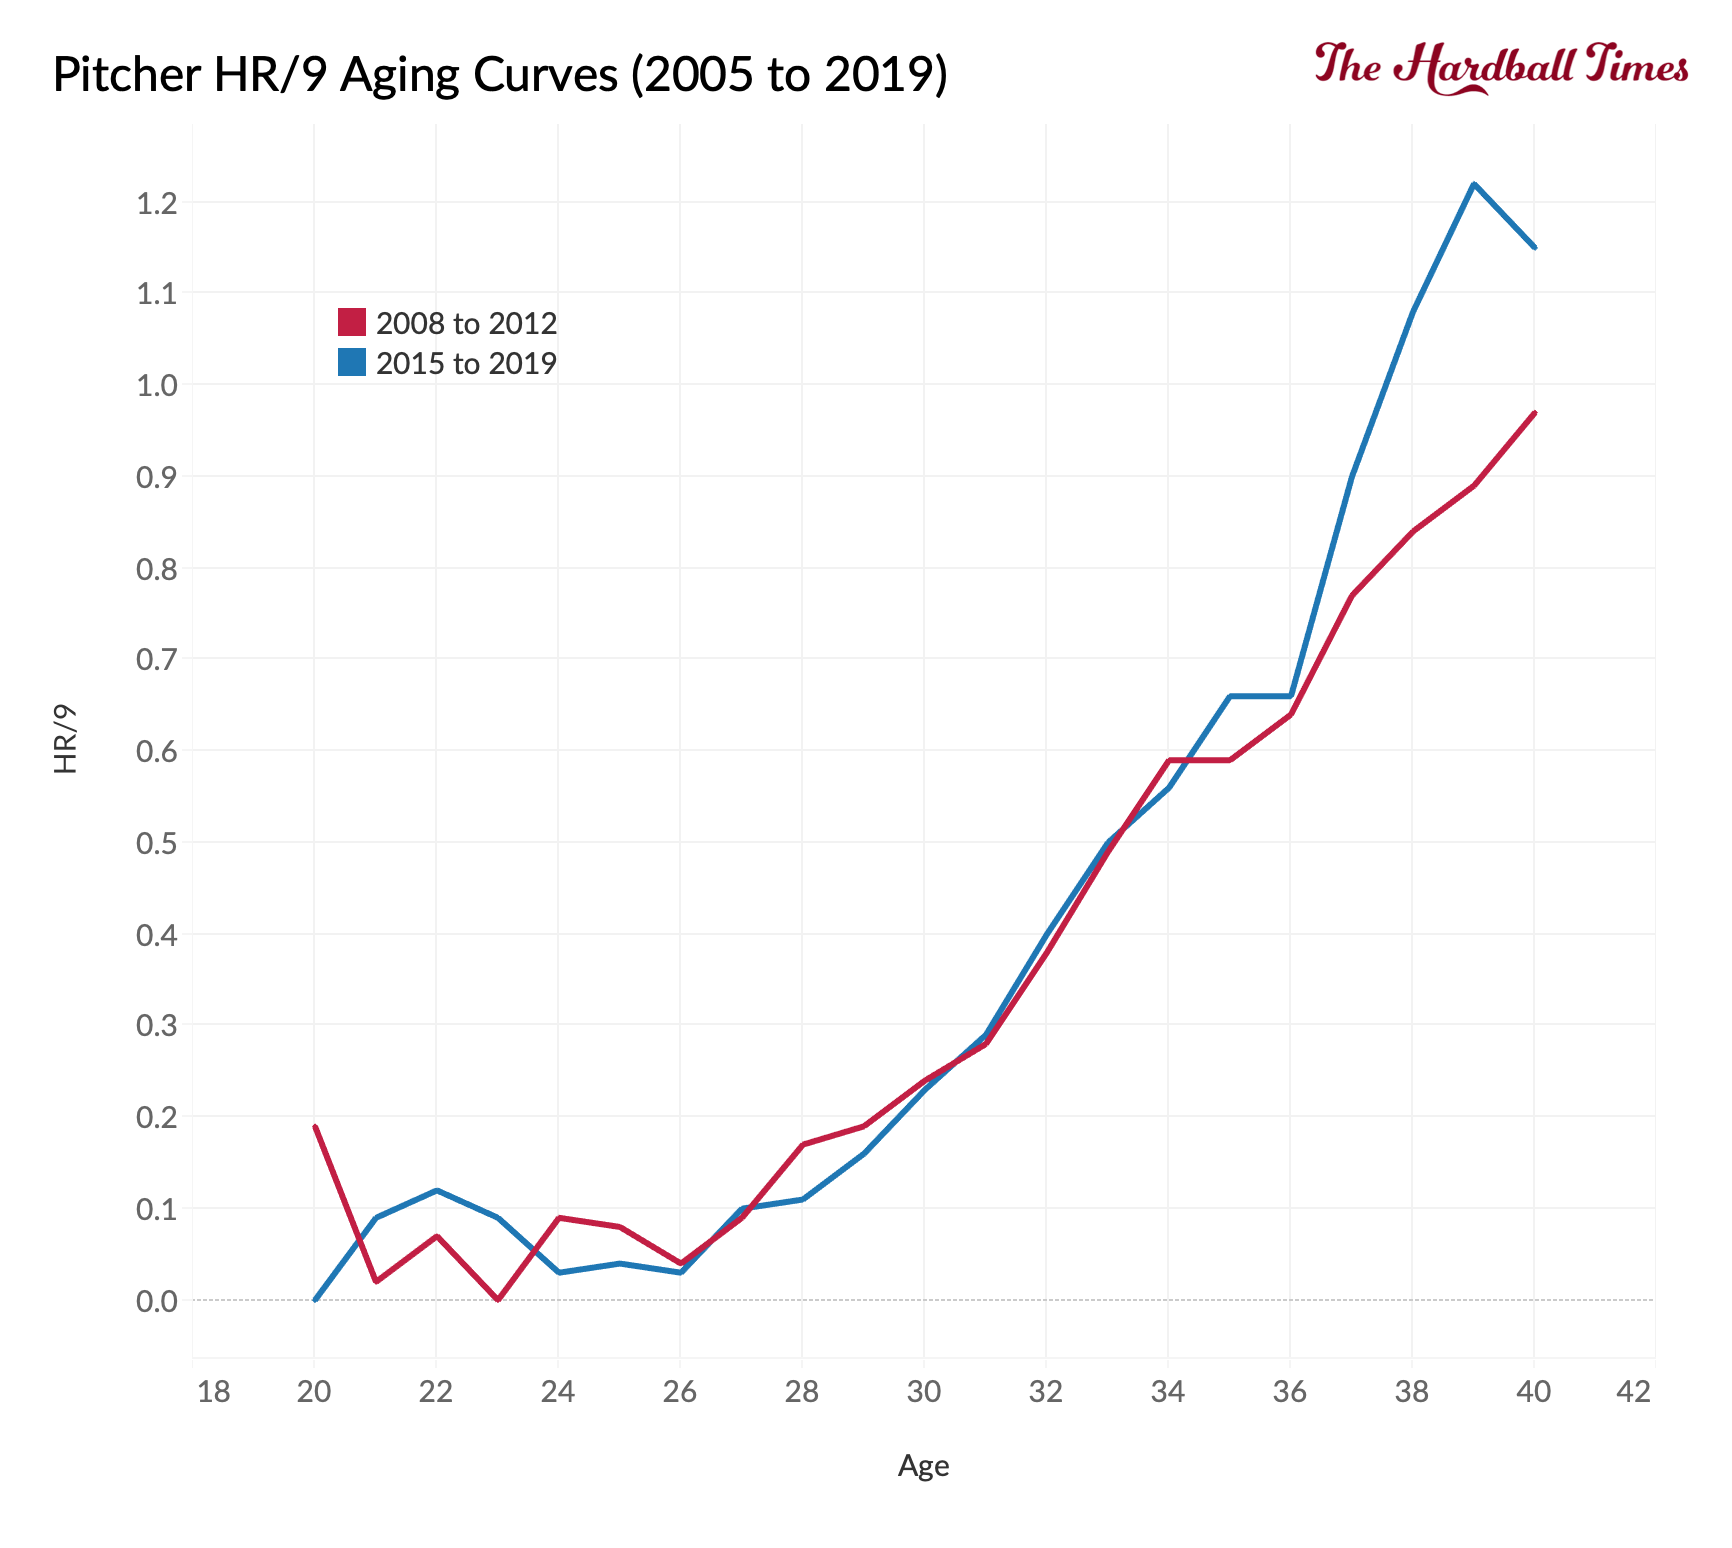
Pitchers are able to limit home runs for a while, but after age 26, the rates start climbing.
The strikeout rate was saved until the end because it needs further examination.
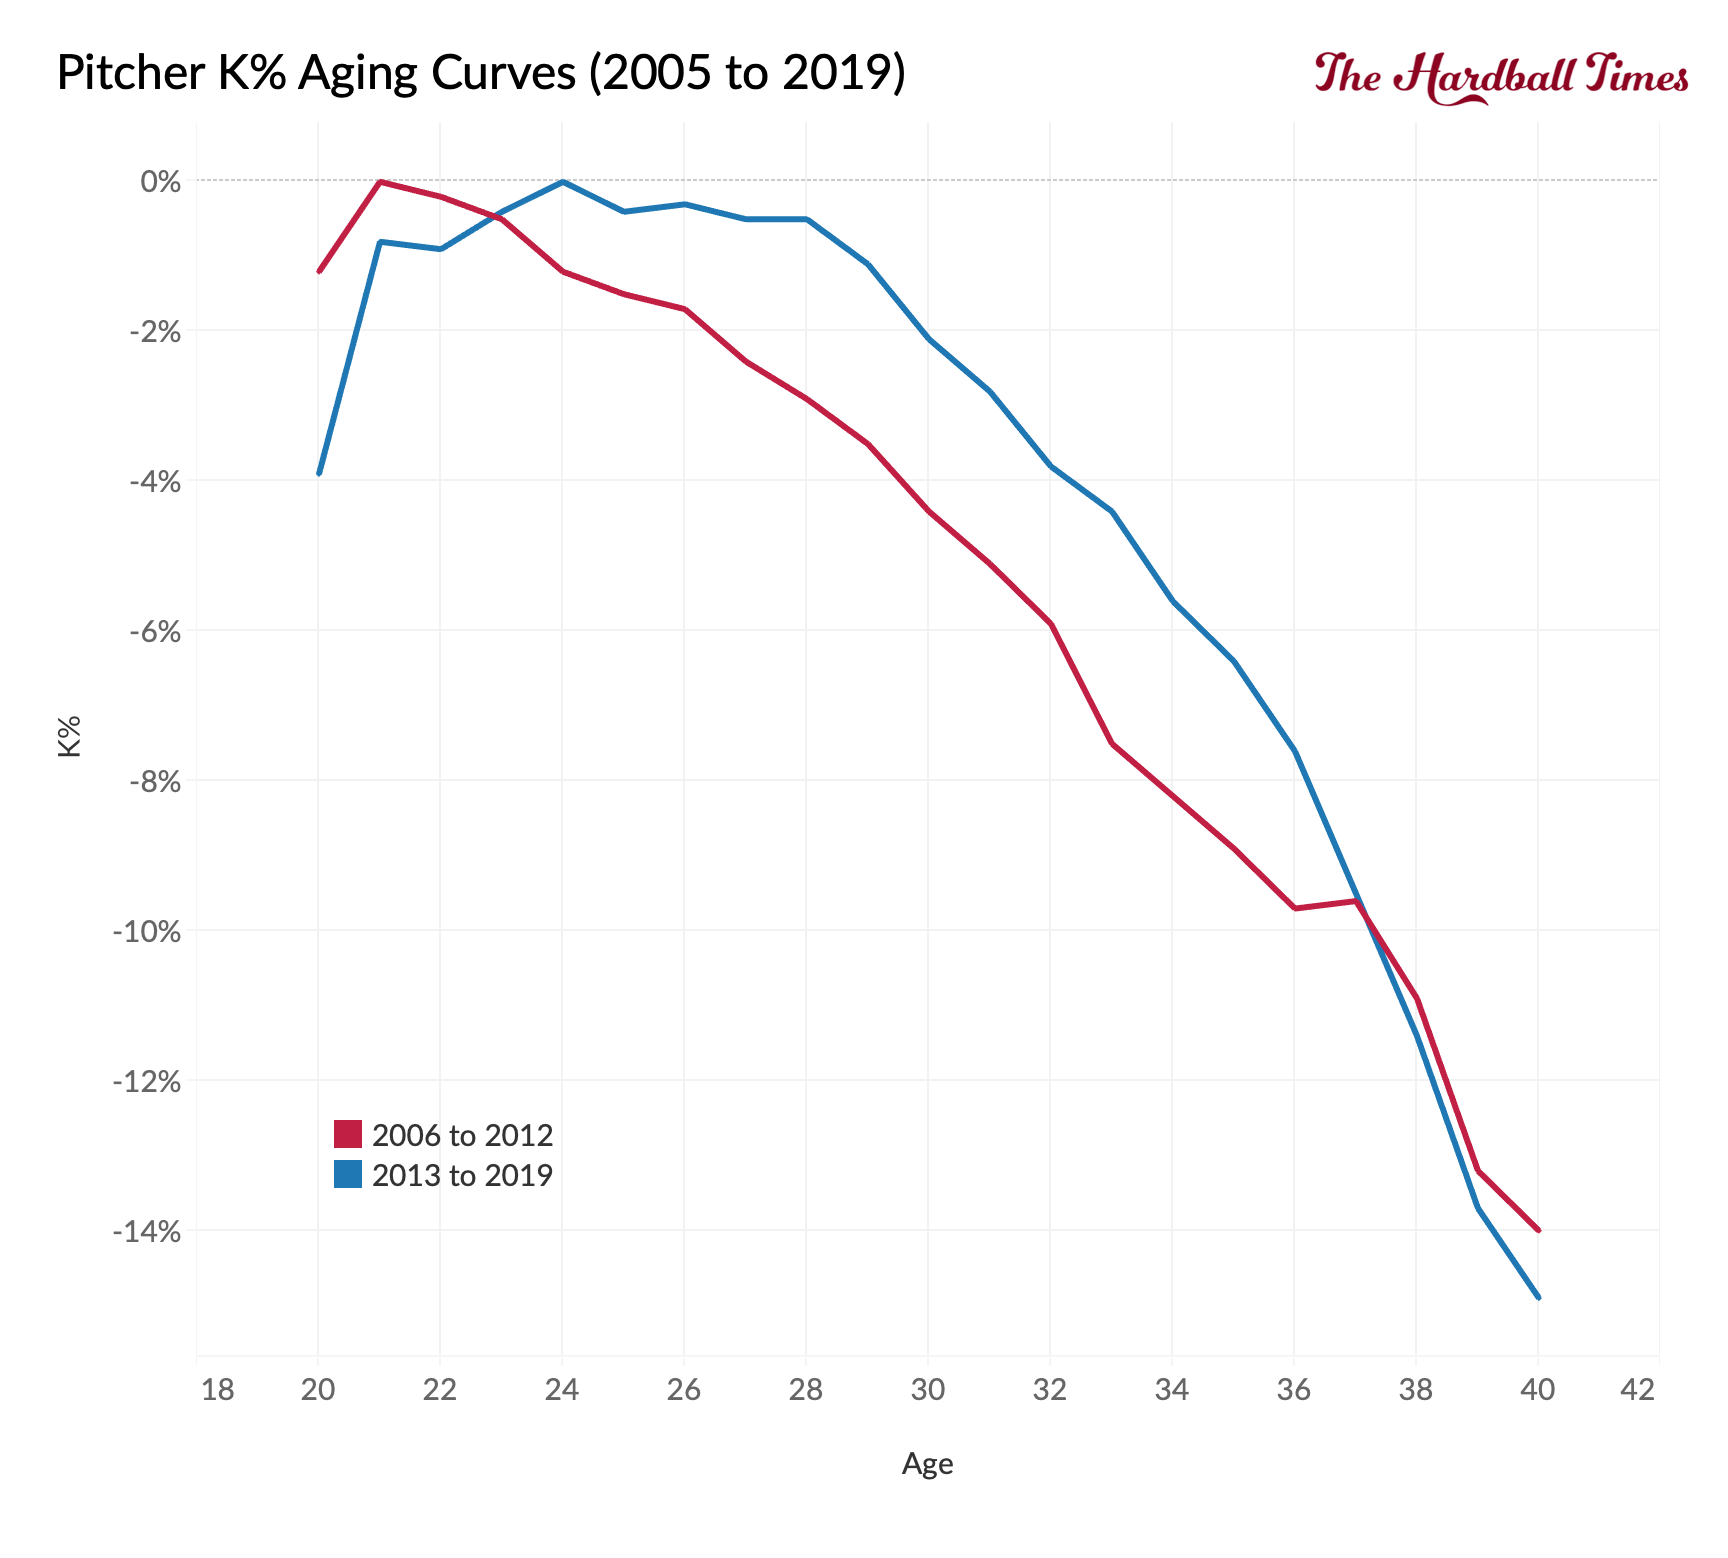
Instead of showing a straight decline starting in the early 20s, the current strikeout rate has a curved shape. The immediate drop in strikeout rate, and the two batted-ball curves, were linked to fastball velocity, which immediately declines. Something else is going on.
The change in the strikeout rate comes down to two reasons. First, pitchers are keeping more of their fastball velocity.
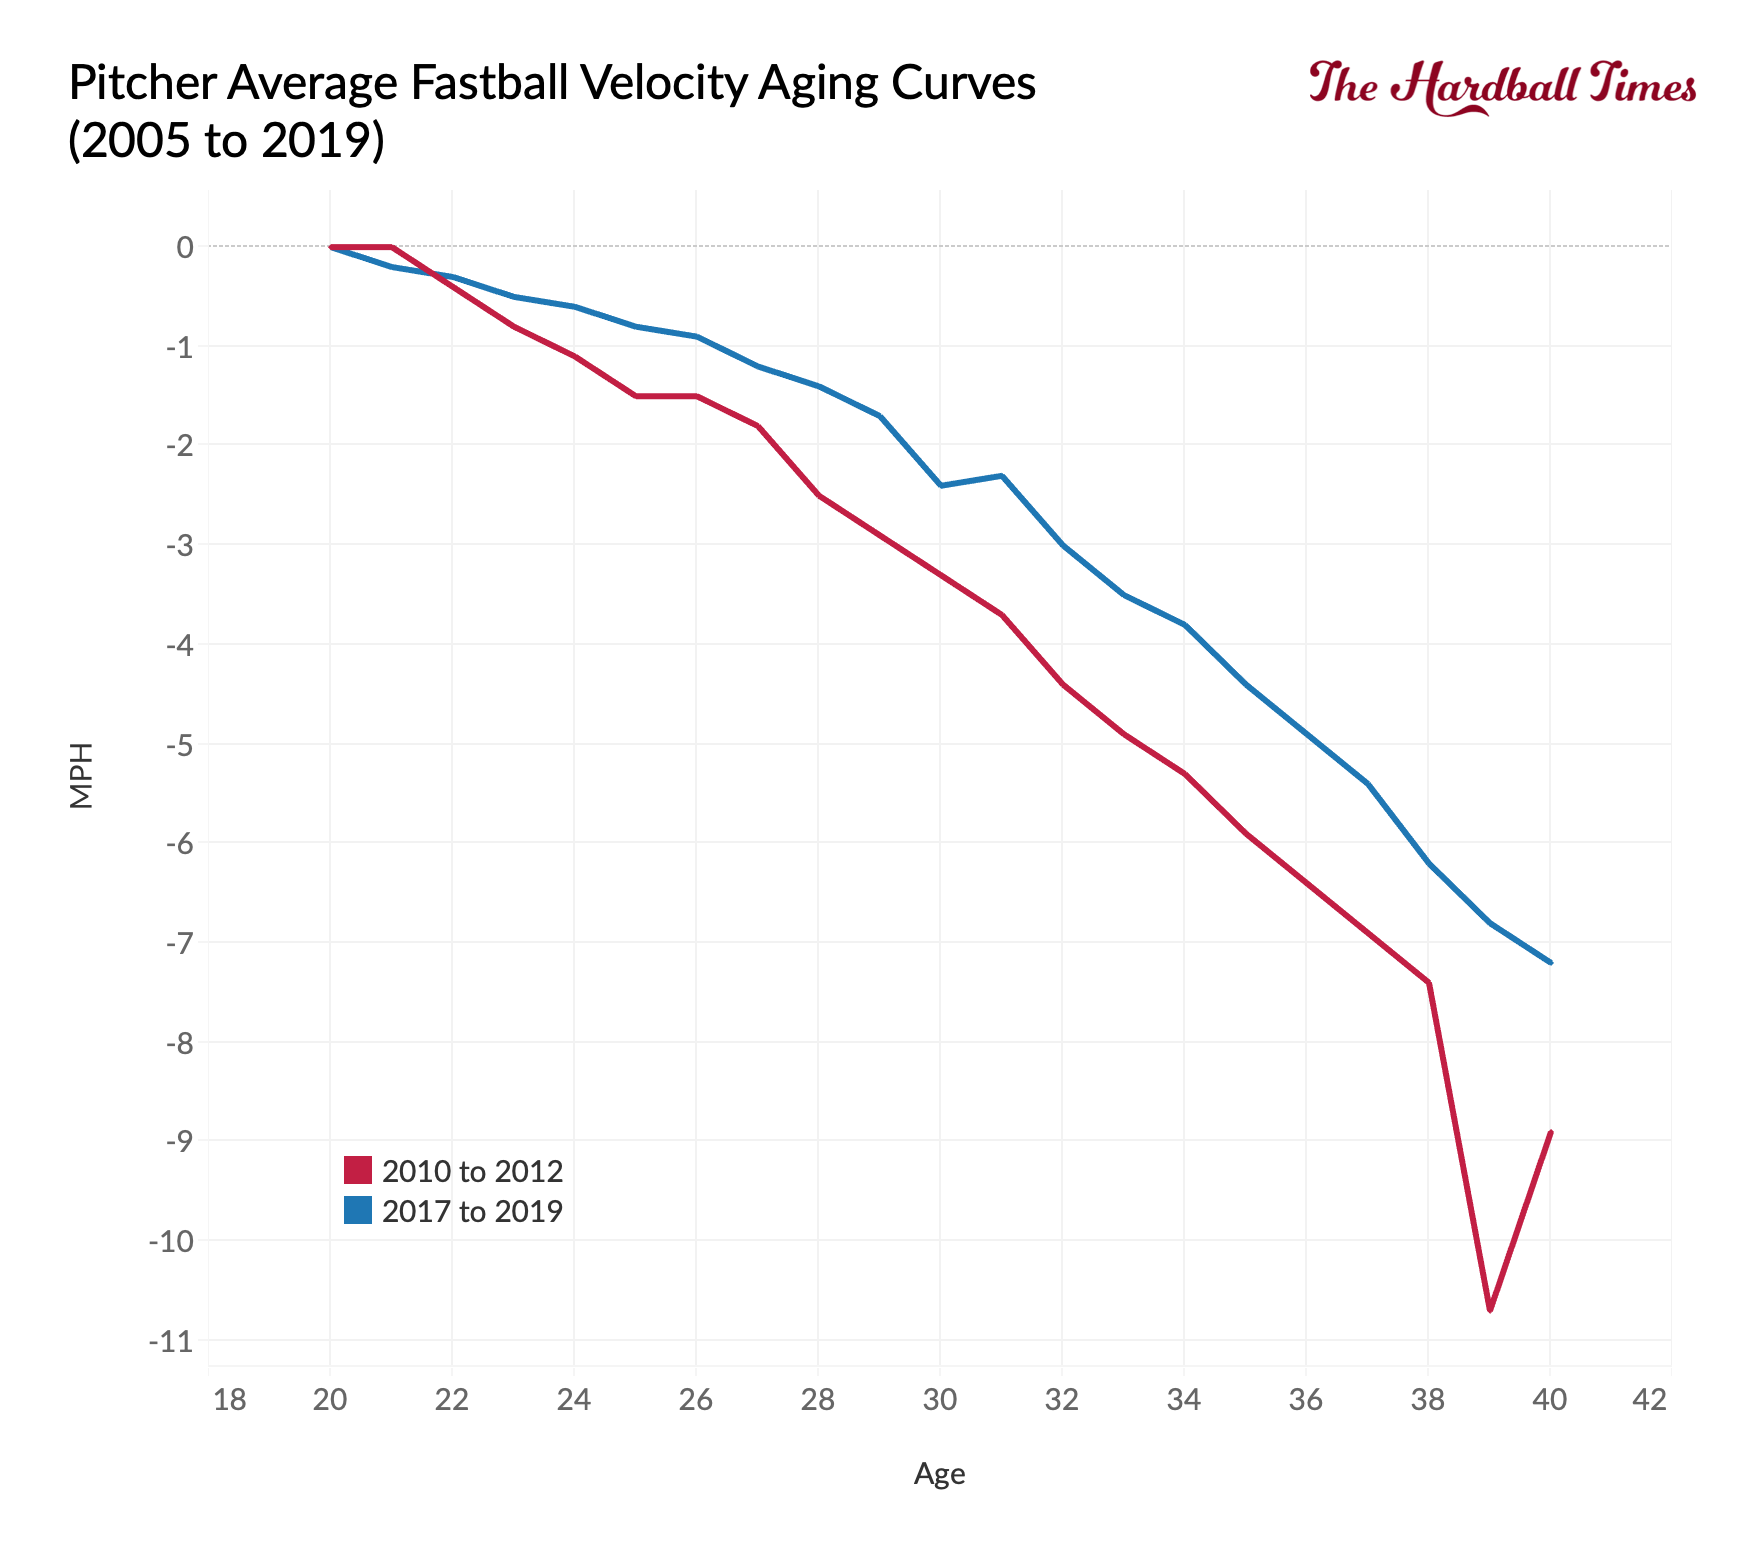
Over the last few seasons, pitchers have maintained more of their velocity as they age. The reasons for this change could be several factors. Offseason training could be better. Better medical knowledge and the 10-day IL could help minimize injuries. Or pitchers might not be relying on their fastballs as much, which leads to the second change.
Pitchers are moving away from the fastball and throwing their high swing-and-miss pitches earlier in their careers.
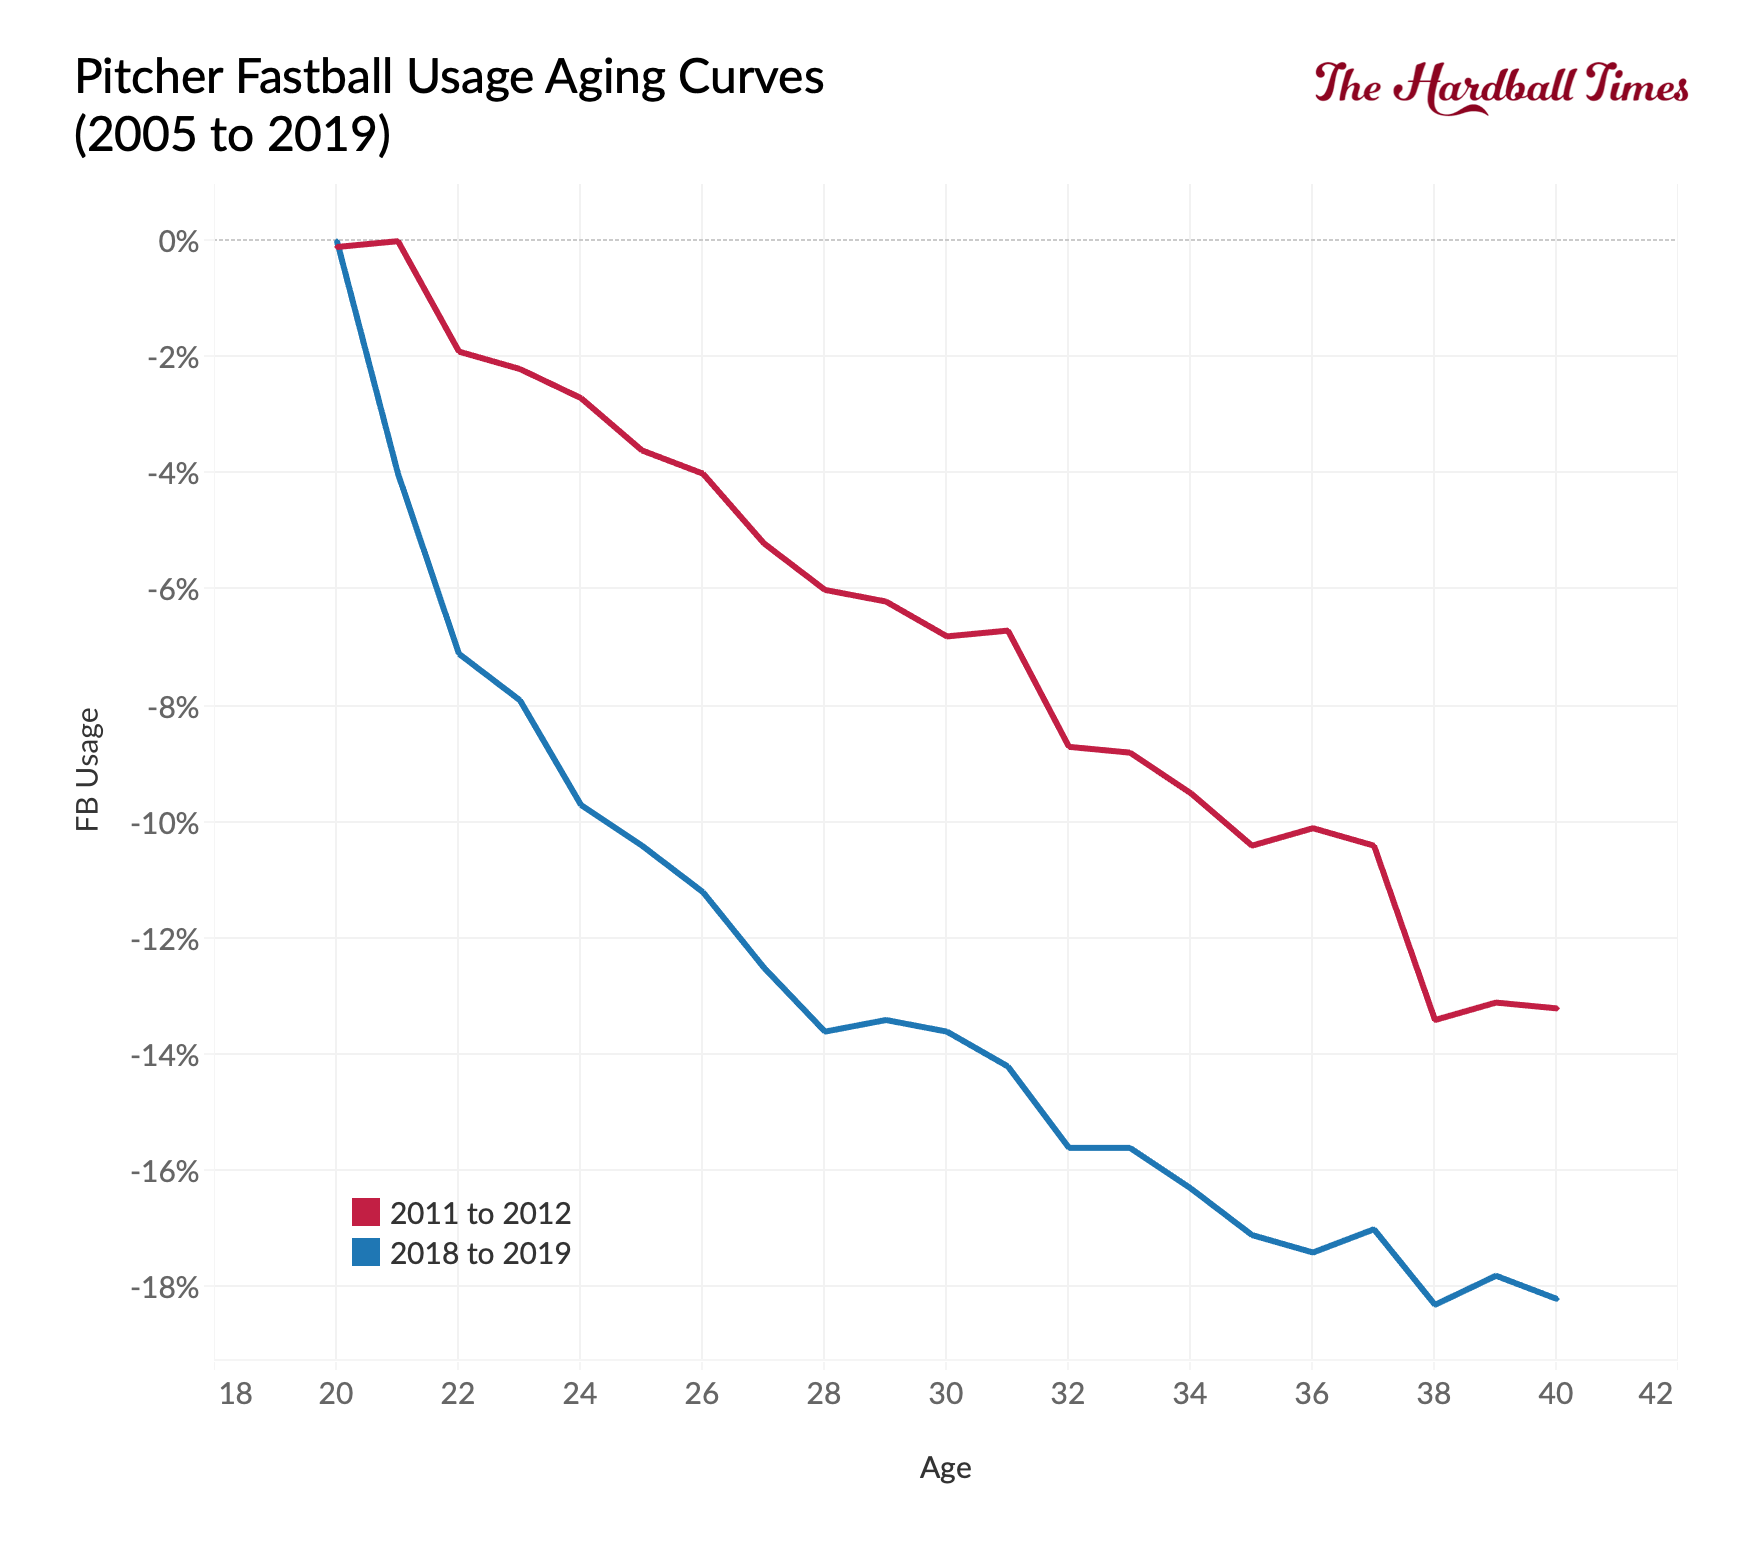
It used to be that once a pitcher could no longer get anyone out with his fastball, he went breaking-ball heavy. Pitchers now understand the advantages of breaking balls and are moving away from their injury-inducing fastballs earlier in their careers. And hitters are paying for this transition.
Hitters are struggling to keep up with both changes. The two changes are the reasons why the major league-wide strikeout rate (K%) has jumped from 16.4% to 23% in the past 14 seasons. Simply, as hitters age and lose their edge, the pitchers are attacking them with pitches they can’t hit..
Several factors (e.g., the juiced ball) are changing the meta-game with trends like more strikeouts and home runs. On the individual pitcher level, the shift away from the fastball has extended the effectiveness of pitchers, especially in relation to an improved strikeout rate. Meanwhile, veteran hitters are struggling against these better arsenals and are being forced into retirement more quickly than they were less than a decade ago.
Who knew Adam Dunn was a trend-setter?
Great, great, great stuff. Thank you!
“ One noticeable change is that hitters seem to be aging faster, especially after their age-30 season.“
This is because aging players can’t get away with using steroids the way they used to. Plot the change versus steroid testing/enforcement by comparing under age 30 WAR versus age 30 and over WAR versus time. When you do that it’s clear exactly when steroid enforcement/testing went into effect.
I did. That is why i brought it up in the article and used seasons after the ban. They are nuts before then.
Hey Jeff, this is great!!
Would love if you could try to slice the data by looking how the aging curve might differ for “elite” players. Have you tried this already? Or maybe you could eyeball the data?
More mathematically: if player X accumulated > Y wRC (or WAR, whatever makes the most sense) by age 25/26, then what do those aging curves look like and how much different are they than the general player population?
Thanks and love the work!
Alex