An early look at HITf/x
HITf/x is fun, even with one month of sample data. The two basic pieces of information that I’m playing with now are the initial speed and launch angles. That’s plenty of fun, especially when combined with the event data and descriptions entered by stringers.
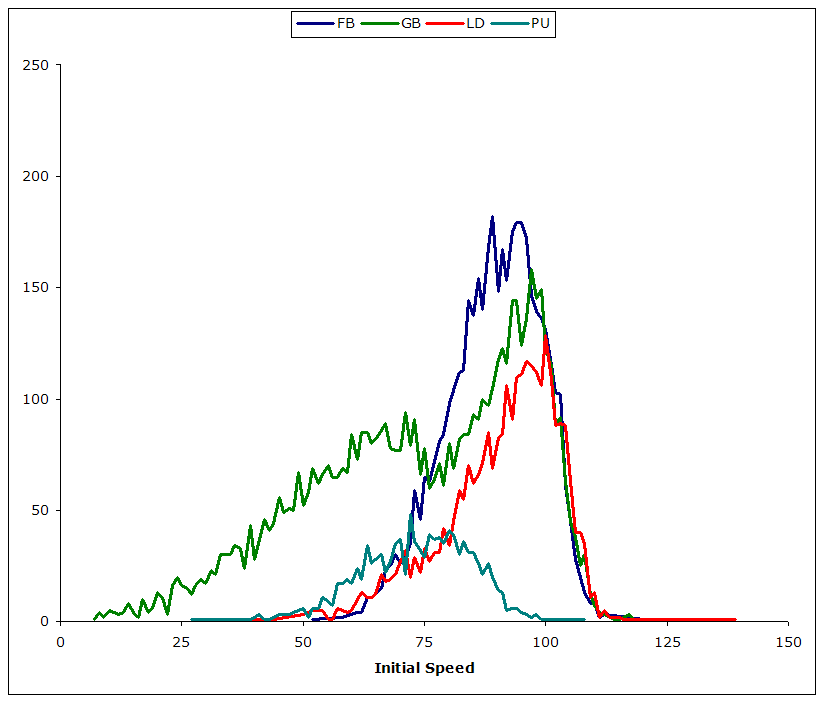
Classifying batted balls is next, but, for now, I’m just filtering by the stringer’s classifications: ground ball, fly ball, line drive and pop-up.
The following three charts show how many of each type of ball were hit. Click the charts to pop-up a larger version (if available).

Benefits of speed
Stopping well short of run values (that’s next, since game states are conveniently in the sample data already), here are in total bases per ball in play, split into 10 mph buckets for each of the batted ball types above, except pop-ups.


Without regard to direction (that’s next), the harder you hit a line drive, the more bases you get. Makes sense. The fly balls are pretty cool. The bloopers and the blasts get you somewhere, but pop-ups (not shown) don’t result in more than .067 bases per batted ball. Grounders have a similar pattern: to get on base, either hit it too softly to be fielded in time or rip it by the fielders. But get it past the catcher’s reach, will ya?
The distribution on the fly balls paints a good picture of the risk/reward nature of the fly ball hitter: Nail it, you’re golden. Just miss, you lose.
Vertical launch angles
Let’s try that again, this time by initial vertical angle (IVA). This time, I’m including pop-ups—there appears to be a dunk zone. Zero degrees is straight, 90 is straight up and -90 is straight down.

For liners, higher is better, based on this crude review.

Lower is better for flies—makes sense.

A ground ball that isn’t pounded down into the ground is better, again confirming intuition.

There’s that dunk zone, in the 30s.
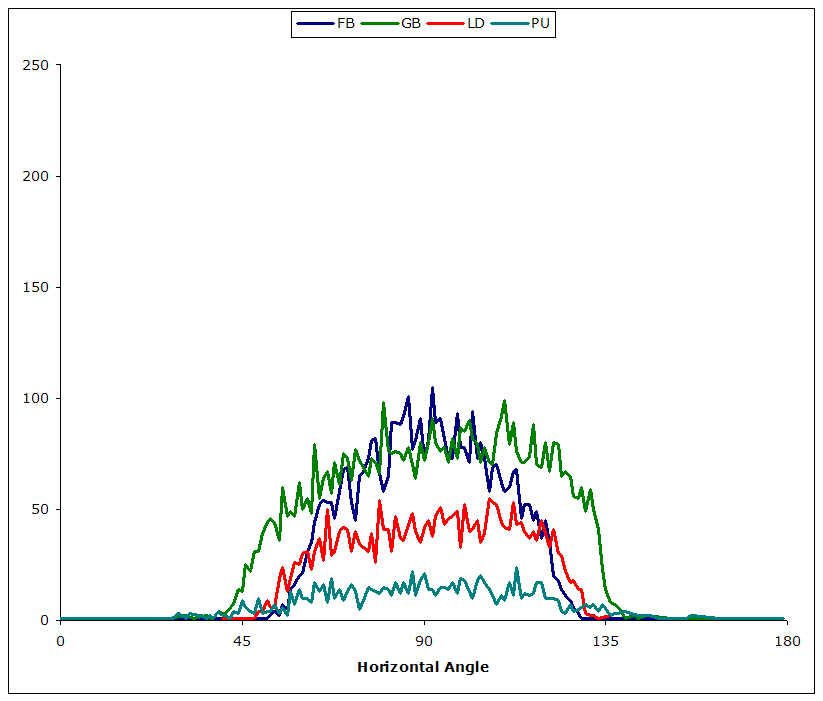
Horizontal launch angles
Using IHA this time, 90 degrees is straight up the middle, 45 is down the first base line, 135 is down the third base and 180 is straight back. Pop-ups are again included, as there looks to be a tiny drop zone behind first base and another, bigger one, beyond the left side of the infield. I’m assuming “beyond/behind”, no actual knowledge of landing spots in this analysis.


No real surprises. Ground balls become base hits when the fielder isn’t in the way; balls hit down the lines earn more bases.
What’s next
A lot.
This is just a start, so much more can be done with this data, well, it’s just silly. Max will have a field day (pun intended). I’m curious about swing styles, too. For example, Jim Thome crushes fly balls but hits some of the weakest grounders you can find.
References & Resources
More on the data and the Summit – you can register to gain access to the data.

How precise is the data for horizontal and vertical angles? Has the improved since this data was published?