Another Look at the Average Hall of Famer
Reader feedback led to a more well-rounded look at the average Hall of Famer.
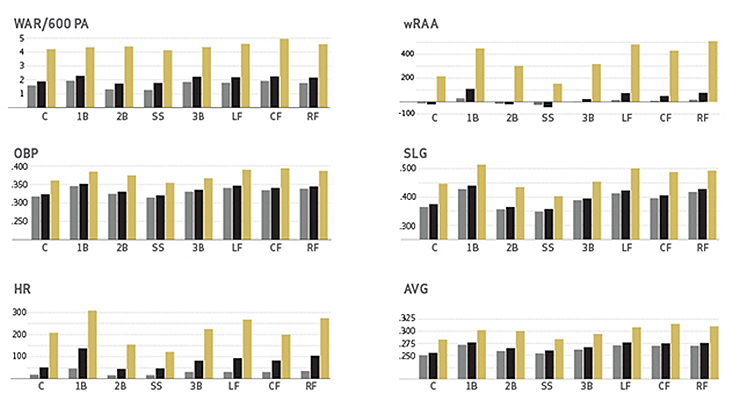
You asked! We listened! After releasing my infographic-driven post, “What the Average Hall of Famer Looks Like,” there were a few comments that begged further exploration of the topic. Commenter David recommended using WAR/600 plate appearances instead of career WAR. Commenter BD recommended using a baseline of 10 years experience in the majors for the non-Hall of Fame group, the same requirement made of Hall of Famers. These both made sense, and they led to an update of the infographic, which follows:

For the most part, the 10-year group made incremental improvement over the full group (both more and less than 10 years). However, a few categories really bear fruit and serve as meaningful fence posts on the way to the Hall of Fame.
- This progress is most notable in the counting stats, obviously. Specifically, for hitters, home runs (HR), baserunning (BsR), and defense (DEF) illustrate a wide gap between the average and the durable compared to the elite. Even players logging 10 years or more are no match for the Hall of Fame group. Hall of Famers still leave the yard two-and-a-half times more than their 10-year non-HOF counterparts, or more depending upon position. Positions that place a premium on speed and defense (second base, shortstop, catcher, right field, and occasionally left field) maintain a monstrous gap in career production, regardless of MLB time logged by the group in comparison.
- Interestingly enough, there’s an inverse relationship with some counting stats and time logged. Typically slow positions (catcher, first base, and third base) see their BsR drop the longer they play. And it gives more meaning to the players who managed to make the Hall of Fame at those positions because their BsR numbers are more in line with the full average. They see less drop in performance despite their lengthy term of service.
- The inverse relationship hits the corner positions in the defense category. Left fielders, right fielders, and first basemen all see their negative DEF increase the more they play. Third basemen are immune, though the position isn’t considered as much of a defensive end-of-the-line as first base, left field, and right field.
- The WAR/600 PA recommendation helps us piece together an average season from a Hall of Famer from the other two sample sets. The gap between the non-Hall of Fame group and the 10-year non-Hall of Fame group is consistent from position to position, as is the leap from the 10-year group to the elite/Hall of Fame group. Paired with the other graphs, we can see where standout players derive their value. The corner position Hall of Famers make hay in the power categories, most notably the slugging percentage and HR for first basemen, left fielders, and — to a lesser degree — right fielders. The defense-first positions — shortstop, second base, and catcher — reach elite status in the DEF category. Center field and second base represent a blend of enhanced power, defense, and baserunning value from the elite.
- Among pitchers, the gaps are comparable to the hitters. The 10-year group lies more in lock-step with the average group than the HOF crew, with a few anomalies. The one statistic where the HOF group distances itself is in home runer per nine innings, along with slight improvements in the other rate stats (hits per nine and walks per nine).
- For pitchers, these differences add up to approximately 1.5 base runners per nine innings and 0.2 fewer home runs per game. This is the fuel that, spread out over a career, can generate massive value above the average in wins, ERA and ERA-, FIP, and ultimately WAR per 200 innings.
- Expanding upon the WAR/600 PA idea from the comments section in the initial article, I applied a similar metric to pitchers, using 200 innings as a baseline. This produced significant results, with the Hall of Fame group netting almost twice the value of the average group and more than one win above replacement over even the 10-year group.
- Strangely enough, the 10-year group has a lower strikeouts-per-nine rate than the non-HOF/non-10-year group. However, they compensate with lower walk and homer rates. Despite the lower K/9, the K/BB rate for the 10-year group comes in higher than the full group. There’s a strong implication there that pitchers with high octane and an ugly walk rate won’t be able to last 10 years. Either way, both groups lag considerably behind the HOF group.
“Positions that place a premium on speed and defense (second base, shortstop, catcher, right field, and occasionally left field…”
Huh?
I noticed that HOF catchers have < career WAR than players at any other position. After examining it further, I found that was due to mainly two factors: 1) less playing time (thus the difference is reduced by using WAR/600 PA, but not completely, only about half, very roughly); 2) most catchers, later if not sooner, end up playing a lot at another position, usually first base, which as the worst positional adjustment. Thus though they may start their career as catchers, and go into the HOF at that position, their effective positional adjustment is not that of a catcher, but a much lower value that results from all the playing time at first base.
The upshot is that the WAR standard for HOF catchers is much lower than it is for players at other positions.
A third factor is that catchers—here I looked at the top 10—have the lowest number of fielding runs of any position—this metric ignores the positional adjustment. IOW, the best catchers tend to be poorer defensively at their position than the best players at other positions.
The complete argument can be found here:
http://www.baseball-fever.com/showthread.php?125146-WAR-by-position-Why-do-catchers-lag
I should add my study, though beginning with the observation that HOF catchers have less WAR than players at other positions, focussed on the top ten in WAR at each position. This is not exactly the HOF group, of course, though there is a strong correlation, and the same general relationships that exist there also exist in comparing HOF players.
I think in your WAR / 200 IP graphic your Hall of Famer group and non group are switched ie, I think the hall of fame group is grey, and the 10 yr group is yellow.
I keep clicking on these posts and hoping you’ll reveal who the most average HOFers are at each position.
Maybe I’m old or my computer isn’t up to snuff, but I can’t really read this chart.