Applying Asset Pricing Theory to MLB

Rick Hahn employs a version of CAPM when evaluating trades for the White Sox. (via Arturo Pardavila III)
Editor’s Note: This piece initially was given as a presentation at the marvelous 2017 Saberseminar.
Two weekends ago, I had the wonderful opportunity to speak at Saber Seminar, an annual baseball conference held in Boston hosted by Dan Brooks and Chuck Korb. While it was only my second year attending, it is clear what everyone says is true: Each year it gets better.
I was blown away by both the attendance and quality of speakers that ranged from Jean Afterman and Rick Hahn to a number of well-educated students presenting research across numerous disciplines. I was incredibly honored to be among the latter, presenting some independent research I began in this past spring semester.
Overview
This research is an application of Asset Pricing Theory–more specifically, the Capital Asset Pricing Model (CAPM)–to assess the value of a major league baseball player. The use of this model allows the financial concepts of systematic risk and return to be practically applied towards the evaluation of a player’s worth, both to the success of his team and the financial health of his organization.
CAPM hypothetically represents the behavior of financial markets and often is used to estimate companies’ cost of equity capital. This model was first developed by financial economist William Sharpe and was published in his book, Portfolio Theory and Capital Markets, in 1970, just four years before George W. Scully’s “Pay and Performance in Major League Baseball” article was published.
The model is simple, as often the best models are, but it has many sophisticated and highly complex modifications. CAPM relies on several assumptions, including the assumption that all investments carry risk.
Risk
The risk involved in investments is defined in financial theory as “the possibility that actual returns will deviate from expected returns, and the degree of potential fluctuation determines the degree of risk.” Investments carry this risk in two forms: systematic risk and unsystematic risk.
Systematic risks are inherent to the market and cannot be avoided or diversified away. An example of this type of risk in the financial environment is interest rates or recessions–conditions over which investors have no control. Alternatively, unsystematic risks are those specifically related to the individual investment. In more technical terms, this risk represents the component of a stock’s return that is not directly correlated with the movement of the market. These risks can be diversified away.

An investor could increase the number of stocks in his portfolio to protect against systematic risk. This method is not perfect, however, since even a portfolio containing every stock In the market still carries systematic risk. CAPM incorporates this systematic risk in a component called beta (β).
Formally, beta is the covariance of the return on a security and the market return divided by the variance in the market return. It gauges the tendency of the return of a security to move in parallel with the return of the stock market as a whole. A beta of 1.0 is average and is assumed to rise and fall at the same rate as the market.
CAPM
Overall, the CAPM is defined as:
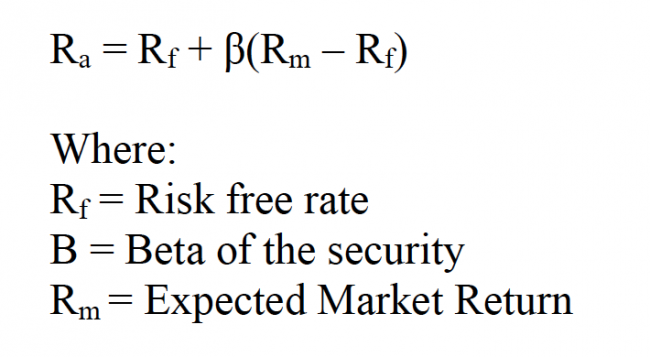
The risk-free rate is defined by a riskless investment such as a United States treasury bill. While this is arguably not a risk-free investment, as all investments carry some modicum of risk, a U.S. treasury bill is risk-free in theory, so it suffices. The relationship between the risk and expected return is called the security market line (SML).
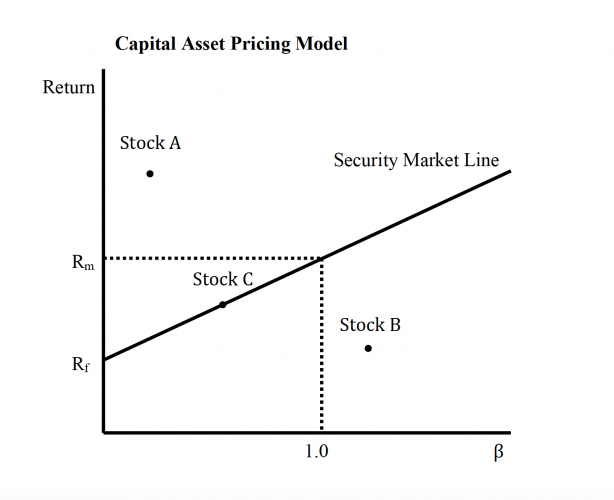
This model can be used to make investment decisions by considering a stock’s position relative to the security market line. Stock A is low-risk, high-return, so based on the CAPM, it is a stock worth buying. Stock B, on the other hand, falls below the SML. This stock is considered too risky for its return, and the CAPM would recommend selling Stock B. A stock that falls on the SML like Stock C would require a judgment call or more information regarding the security’s financial health.
Application
The application of CAPM in baseball is straightforward. Investing in a baseball player is strikingly similar to investing in a stock as far as risk is concerned. Just as with a security, the risk of a player can be defined as the possibility his actual performance will deviate from his expected performance, with the degree of potential fluctuation determining the degree of risk. The unpredictable fluctuation of value that necessitates calling common stocks risky is the same kind of fluctuation in performance that makes baseball players humans. The baseball market also carries both systematic and unsystematic risk.
Beta can be used to measure the systematic risk of a player just like it is used with a stock. Beta is the covariance of the player’s performance and the team’s performance divided by the variance of the team’s performance. This gauges the tendency of the player’s performance to move in parallel with the performance of the team as a whole. A beta of 1.0 is consistently average and is assumed to rise and fall at the same rate as the team. The team, rather than major league baseball as a whole, is analogous to the market because there is little to no correlation between a player’s performance and the performance of MLB.
Baseball CAPM
Overall, the CAPM in this application is defined as:
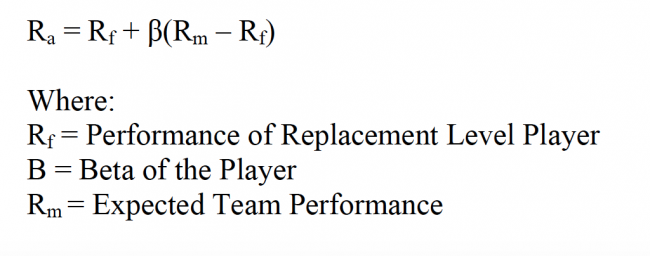
The relationship between the risk of a player and his expected performance (return) is the security market line in CAPM, which is called team replacement level (TRL) in this application.
A riskless player such as a replacement-level player defines the risk-free rate. This concept, discussed in detail in The Book: Playing the Percentages in Baseball, is a means of comparing players. The replacement-level player is theoretical, an easily accessible back-up for any MLB player, also defined as an AAAA, or Quadruple-A (Quad-A) player.

Though the Quad-A level does not exist, this explanation allows for a clearly conceptualized idea of a replacement player. He is “stuck” between the Triple-A and major league levels. His salary is assumed to be the league minimum of $535,000. The idea of a replacement-level player is used to mirror the risk-free rate because the theoretical replacement-level player carries no risk, even though in reality he may carry some risk.
Suppose, for example, he is expected to perform constantly at 86.7 percent of major league average. Since the percentage of league average can be calculated, so can the replacement level of any performance metric. The following example employs the hitting weighted runs created plus (wRC+), although this application can also pertain to pitchers.
This metric measures the value (performance) of a hitter, crediting him for total production rather than per each at-bat. Essentially, wRC+ measures how many runs a player contributed to his team with his hit tool. It is adjusted for comparison across leagues and parks (but not position) and is context neutral, so runners on base are ignored. League average wRC+ is always 100, so replacement level wRC+ is 86.7. Using team and player data for the Baltimore Orioles and the above replacement level wRC+ in an application of CAPM, the following graph illustrates the particular TRL.
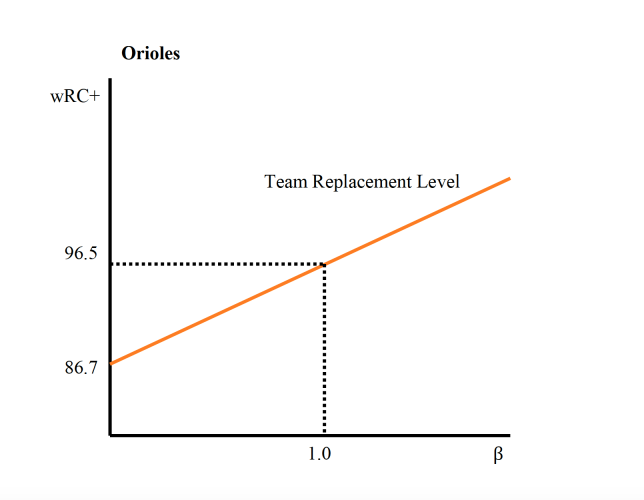
Any player whose beta falls below the TRL could be considered too risky for his return. Alternatively, players above TRL are worth the risk. This model is simple, however, and should not be used alone. A player’s overall performance and subjective worth to his team certainly should be considered when evaluating the implications of the Baseball CAPM.
Interpreting the Baseball CAPM
When using the Baseball CAPM, it becomes clear that each team has a different TRL. This replacement level is drastically different from what we consider replacement level now and suggests that even though a player is above replacement level, he may not be performing well enough relative to his risk to be worth it to his team.

Using the AL East as an example, there is evidence that each team is performing at a different standard, and thus there are varying levels of replacement. This idea could be useful in many situations, and the concept already exists since teams are all composed differently, with different focuses, strengths, weaknesses, and payrolls. The Baseball CAPM could be used, for example, to propose a trade if a player falls below one team’s replacement level but above another’s.
At Saber Seminar, Rick Hahn spoke about an imaginary line the White Sox must feel they are above in order to complete a deal. This model, once perfected, could be that line. In addition, this might be used to create a risk profile of a team based on the characteristics of their investments, whether they are interested in playing it safe or betting on high-risk players.
Conclusions
CAPM is not perfect. In fact, it is highly debated within the world of finance. Many empirical tests of the model exist. These empirical tests do not unequivocally validate CAPM, but they do support its main implications. In addition, this is the most basic form of CAPM. More complex offspring dealing with less rational markets could be better suited to baseball. A more fitting model should also include unsystematic risk, as a team does not hold enough players to eliminate unsystematic risk.
Baseball, like the “real” world, is very complex. This application is an introduction to the many possible uses of CAPM, especially in its more complex states. Even though it is imperfect, all current valuations of players are, and I am continuing to work toward finding a better and more practical model.
This research is currently just a means to look at the problem in a different, interesting way. With that said, the idea that different teams have different replacement levels is one that should be investigated further but presents an important consideration for major league teams.
Replacement level as it stands is a nice concept that allows players to be compared easily across positions, but it is not the reason teams are making decisions. A new standard of replacement could be crucial in team decision-making, for example, in instances of how many innings a player sees to how many dollars he is paid.
Teams are already operating in these terms, as each relies on its own criteria for contracting and trading players. It would be beneficial for organizations, writers, scientists, sabermetricians, and fans to have a team-specific standard to better understand how teams are making decisions and how the baseball market is moving in general.
References & Resources
- Box, George E. P.; Norman R. Draper (1987). Empirical Model-Building and Response Surfaces, p. 424, Wiley. ISBN 0471810339.
- Brown, Maury. “Breaking Down MLB’s New 2017-21 Collective Bargaining Agreement,” Forbes, 03 Dec. 2016. Web. 03 May 2017.
- Herz, Denise C., Joseph P. Ryan, and Shay Bilchik. “Challenges facing crossover youth: An examination of juvenile‐justice decision making and recidivism,” Family Court Review 48.2 (2010): 305-321.
- Kaufman, Samuel, and Matthew Tennenhouse. “Determining the Value of a Baseball Player,” Society of American Baseball Research (2012): n. pag. SABR. Web. 3, May 2017.
- Leetaru, Kalev. “Does More Data Really Lead To Better Decision Making?” Forbes, 14 June 2016. Web. 03 May 2017.
- Marshall E. Blume, Jean Crockett, and Irwin Friend, “Stock Ownership in the United States: Characteristics and Trends,” Survey of Current Business, November 1974, p. 16.
- Mullins, Jr. David W. “Does the Capital Asset Pricing Model Work?,” Harvard Business Review. Harvard Business Publishing, 01 Aug. 2014. Web. 03 May 2017.
- Slowinski, S. “wRC and wRC+,” FanGraphs Sabermetrics Library. FanGraphs, 03 May, 2017. Web. 03 May 2017.
- Tango, T. M., Lichtman, M. G., & Dolphin, A. E. (2007). The Book: Playing the Percentages in Baseball, Washington, D.C.: Potomac Books.
- Worrell, Stewart S., et al. “The Risk of Reinjury in Relation to Time Since First Injury: A Retrospective Population-Based Study.” Journal of Trauma and Acute Care Surgery 60.2 (2006): 379-384.
- Wu, Garrett. “Why More Data and Simple Algorithms Beat Complex Analytics Models,” Data Informed. Wellesley Information Services, 10 May 2016. Web. 03 May, 2017.
A good read, and I appreciate your very thorough list of resources & references. Always appreciate a good lit review.
My only regret is that I couldn’t make it up to Boston to see your presentation in person. Great job Rachel!
Rachel,
Fascinating application of real-world financial model to the National Pastime.
Several questions;
1) Would Rick Hahn’s use of this model influence the recent Sox trades which focused on obtaining higher-risk, high reward (low floor, high ceiling) players?
2) Are injuries a systemic or non-systemic risk?
My guess would be injuries are systematic. Even the most healthiest players historically can be injured (like Mike Trout this year).
Using stocks, even companies with the healthiest balance sheets in the market (let’s just use Apple) don’t just go up. They can miss the consensus estimates for earnings (something like expected performance – which further includes sector macro trends), and see their price fall. The “market” fully expected them to be healthy but they weren’t.
However company health is 100% non-systemic risk, and that’s why your portfolio should be 10+ positions as to effectively eliminate that non-systematic risk.
Typing all this, I’m a bit conflicted on which side to fall on here, but I think that injuries are inevitably just part of the game, so I could see the argument for systematic risk.
I think the more interesting application would be high floor, low ceiling prospects. Players who are in AAA baseball, or early in a MLB career, but are in the 29+ age bracket. They may be viewed as short lifetime, late bloomers, but can bring value to a ML club over a shorter period. Lately, a number of pitchers who can contribute useful innings fall into that category.
I guess I just don’t understand why a team should concern itself with whether a player’s performance moves in parallel with the team’s performance in the same way that a fund manager would care whether a stock is too risky for its expected return.
The GM and his advisors have to compare the cost of a free agent (generally set by a MLB wide concept of replacement level) to their specific benefit (the difference between that free agent and the player he’ll replace in their lineup). This benefit will vary widely from team to team. For some, the cost is then more than the benefit and they don’t participate.
Very neat. Thank you.
CAPM is, at best, strained when applied to baseball and probably irrelevant since we can discuss ROI’s on trades or free agent signings in $/WAR terms. I think the systemic and idiosyncratic risk Hahn may be referring to is a) systemic – average variation of all players’ performances from season-to-season and b) idiosyncratic – year-to-year variation specific types (eg, relievers have high variation) of players seem to have exhibited over MLB history. Thus, one would demand a higher return for and thus offer a lower salary to a reliever or to a hitter prone to strikeouts. If Hahn described the White Sox player-type “model”, then we’d have an interesting story. Even then, Cameron, Sullivan, et al seem to do this daily on Fangraphs anyway.
First off, really cool read, and a really interesting application of CAPM.
I would like to hear a more in depth explanation/justification of your use of the model, however. From what I remember from my finance classes, CAPM assumes that a stock holds an insignificant share of the market — in that the performance of the market can affect the performance of the stock but not the other way around. On a baseball team with 25 players, an individual performance will affect the team performance.
Also, player performance is not theoretically correlated with team performance, except for the causality I just discussed. I believe that it is a core tenant of sabermetrics that a player’s true talent is not affected in a significant way by the performances of his teammates. This is different than stocks, where market movements can have direct or inverse relationships with the movement of stocks. Think of how a good market would move with luxury car stocks, or used car stocks. I don’t think there is an equivalent theoretical idea in baseball. There are not players who are known to play better when their team plays better, or players who play better when their team plays worse.
This model is unnecessary. What you need to look at to put a value a given player for a given team is their win expectancy with an without the player. Different players will have different values depending on whether adding the player will not help a non-playoff-bound team make the playoffs, will help a non-playoff-bound make the playoffs, will help a mm alread-playoff-bound team to get a better seed in the playoffs, or will have no playoff effect on a team that will make the playoffs without him. Duh.
What is your formula for calculating a team’s replacement level (TRL)?
Remember when baseball used to be fun?
Love it! One of my favourite articles this year.
Hi! I loved this article, and did a bunch of reading about CAPM and Beta in finance to satisfy my curiosity.
A question: what’s the ideal way to go about choosing a good stat to measure beta? wRC+ and WAR seem like poor choices because they respond to “market conditions” on their own (average wRC+ is always 100, meaning covariance with a player’s wRC+ will always be zero).
I’m intrigued by the effort to apply the CAPM to baseball, but I think the author has make some large but unsubstantiated assumptions. For example, the assumption that individual players betas should be calculated relative to their team’s performance rather than the league’s performance is inconsistent with how the CAPM works in finance, and is not justified by any evidence that a “team factor” influences performance independently of park factors. Perhaps it’s true, and it should be easy enough to demonstrate if so, but that seems like a huge assumption to make.
Likewise, I’m skeptical of the idea tha “replacement level” is different for different teams. The whole notion of a replacement level player is based on the notion that there are always readily available “basically competent” AAAA-type players, and that teams should never need to pay a premium to acquire one. But if this is true, why should it be differently true for the Phillies versus the Yankees? Again, a huge assumption is made without justification. This doesn’t negate the conclusion that one team will be willing to trade for a marginal 2nd baseman because their incumbent is horrid, while another team that is strong at the position will demand more. But we didn’t need the CAPM to tell us that.
Still, this was an interesting article in need of greater elaboration and assumption testing. (As you quote him, Rick Hahn didn’t go into much detail either. As a White Sox fan, I hope that he was just being too cagey to publicly reveal his strategy.) I hope the author will crunch the numbers, see if her assumptions hold up, and share the results in a follow-up article.