Batter Patience as a Team Sport

The grip it and rip it philosophy has served Carlos Gomez and the Brewers well in 2014 (via Steven Paluch).
I suppose it is human nature to seek a reason for all things. In baseball, many similarly demand “a reason” for why a team is winning games, especially when its success is unexpected. And so it went for the Milwaukee Brewers early this year, as writers homed in on their impatience at the plate.
Tyler Kepner proclaimed that “Red-Hot Brewers Win by Swinging Freely, Always.” Tom Verducci proposed a script to a new movie called “Brewerball” in which the Brewers would use their hack-tastic plate approach to revolutionize baseball offense. Comparisons were made to other free-swinging clubs like Baltimore and Colorado, who contrast vividly to the Red Sox, 2013’s offensive champions, many of whom tended to take a large number of pitches during each plate appearance (P/PA).
Why would the Brewers try to be impatient at the plate? One explanation came from Lyle Overbay, who told Kepner that a free-swinging approach makes sense in today’s run-scoring environment:
When I came up in the league, ‘Moneyball’ was big, and I understood that, because the fifth-, sixth-inning guys were not that good,” Overbay said. “Now, the bottom of our bullpen—any bullpen—they all throw 95. I’d rather face the starter four times. So it’s changed. I don’t think it’s the same game.”
I froze when I read this the first time. A grizzled veteran inside the clubhouse, casually discussing the effect of the times-through-the-order (TTTO) penalty on a starter? That’s not only unexpected, but welcome.
Except . . . except . . . something is off here. Let’s start with Overbay’s comment and work backwards. It is certainly true that your average starter is easier to hit the third and fourth time through the order. It is also true that a reliever going through an opposing lineup the first time is generally more effective than a starter who has already been through it a few times.
But there’s nothing new about this as a concept; relievers did not suddenly become useful when the St. Louis Cardinals began to call up fireballers last year. The effectiveness of a fresh reliever, as compared to a third-time-through-the-order starter, was discussed at length in The Book several years ago, and was just as true 20 years ago as it is today. All other things being equal, relievers excel because they are fresh and comparatively unfamiliar to batters, not (just) because they can throw harder.
But the problem with this narrative goes deeper than that. In truth, there is little evidence of any ultimate connection between team plate patience and production, on either side of the ledger. So far this season, the Red Sox (4.02 P/PA), Mets (3.87 P/PA), and Phillies (3.87 P/PA) all have significantly above-average plate patience, and significantly below-average offensive production. The Blue Jays, Athletics, and Indians have significantly above-average plate patience with above-average offensive production.
If we plot P/PA versus Runs Scored for all teams from 2010 to 2013, this is what it looks like:
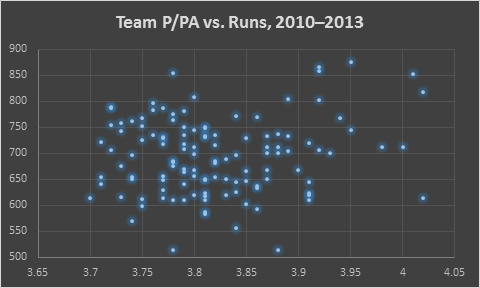
In sum, there is no significant relationship. (r=.14; p=.13). Some might say that “Runs Scored” is too far down the line to draw a connection and that we should look at offensive building blocks instead. Fine, let’s work backwards.
Here are team pitches per plate appearance correlated to team offense (wRC+) over the past four seasons:
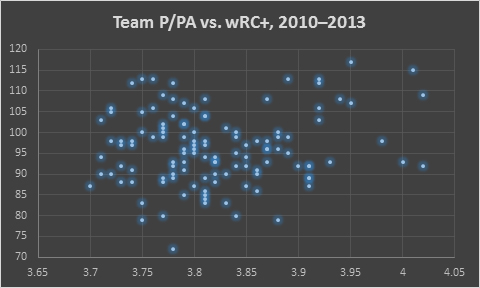
The correlation is basically the same as with runs. There’s really nothing there.
How about stolen bases? If you take more pitches, base runners should have more opportunities to steal a base, all other things being equal. Does that give us some demonstrated connection?
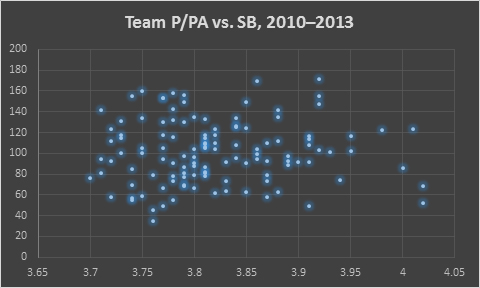
No, that’s even worse (r=.03; p=.73).

We can find some effect of plate patience if we step back to hits, strikeouts, and walks. Over this same time period, there is a significant (p<.05) but weak (r=.21) positive connection between team P/PA and hits, a highly significant (p<.001) and moderate (r=.4) positive connection between team P/PA and strikeouts, and a highly significant (p<.001) and rather strong (r=.56) positive connection between team P/PA and walks.
The connection between plate patience and walks/strikeouts at least makes sense: the more pitches you take, the more likely a hitter will get to strike three or ball four. But when you re-run any of the bottom-line metrics we care about, like wRC+ or Runs Scored—even controlling for walks and strikeouts—there still is no meaningful connection between team plate patience and team offensive success, at least over recent seasons.
Let’s try something else. If teams derive no overall offensive benefit from their patience at the dish, perhaps there is some situational benefit. Overbay, after all, didn’t claim impatience was useful for impatience’s sake; he claimed it was useful to give the lineup extra opportunities with a tired starter instead of a fresh reliever. That sounds like a worthwhile objective. But on a team-wide level, does it actually work?
It makes sense that teams with shorter at-bats get more plate appearances against opposing starters. From 2010 through 2013, team pitches per plate appearance were moderately positively correlated (r=.33, p<.001) with the number of plate appearances teams obtained against starters the third time through the order, and even more so (r=.41, p<.001) against starters the fourth time through the order. But that’s not as useful as you might think.
This is because the total difference in the number of pitches these teams see isn’t all that much, and the resulting opportunities created tend to be at the bottom of the lineup, where they arguably would confer the least probable benefit.
From 2010 to 2013, the average team P/PA was 3.82. The most patient teams (+2.0 standard deviations) check in around 3.96 P/PA, and the free-swinging teams (-2.0 SD) still muster 3.68 P/PA.
Over the last 10 years, both the average and median number of starter pitches thrown per game is 95. Even rounding up all values to the next batter in the lineup, this is the maximum average lineup effect that an impatient team will generate against typical opposing starter:
| Average Lineup Effect, Patient vs. Impatient Teams, 2004-2013 | |||
|---|---|---|---|
| Dist. | P/PA | Batters | Final Batter Faced |
| +2 SD | 3.96 | 24.01 | # 7 |
| +1 SD | 3.89 | 24.46 | # 7 |
| MEAN | 3.82 | 24.91 | # 7 |
| -1 SD | 3.75 | 25.39 | # 8 |
| -2 SD | 3.68 | 25.88 | # 8 |
Instead of having the opposing starter finish up against your lineup’s No. 7 hitter, you get to the eighth spot, which should be the second-worst hitter on your team. Whoopty doo.
Even if we apply this finding to 2013 qualified starters, who tended to throw a few more pitches (99 average/median) during each outing, the result isn’t much different:
| Average Lineup Effect, Patient vs. Impatient Teams, 2013 Qual. SP | |||
|---|---|---|---|
| Dist. | P/PA | Batters | Final Batter Faced |
| +2 SD | 3.96 | 25.05 | # 8 |
| +1 SD | 3.89 | 25.51 | # 8 |
| MEAN | 3.82 | 25.99 | # 8 |
| -1 SD | 3.75 | 26.49 | # 9 |
| -2 SD | 3.68 | 27.00 | # 9 |
Against a qualified full-season starter in 2013, the lineup reward for the most impatient teams was an additional at-bat for their worst hitter against the opposing starter. In the National League, that worst hitter is probably the pitcher or a pinch-hitter facing the inherent disadvantages of that role.
Not surprisingly, over the past four years, the addition (or loss) of a potential at-bat at the bottom of the lineup has resulted in no meaningful impact. (r=.05; p=.58). And this is probably why, at the end of the day, the overall correlation between team P/PA and opposing starter effectiveness (by OPS+) from 2010–2013 looks like this:
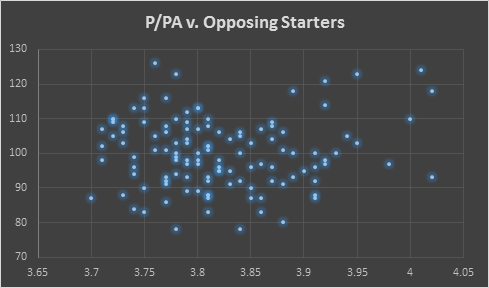
Which is to say, there is no meaningful connection at all.
I suspect this is because the concept of an overall team “approach” to plate patience is probably a myth. The idea that all players on a team would share the same plate approach conflates the stars with the scrubs, the top of the lineup with the bottom, and the starters with the inevitable replacements.
In truth, teams seem to be random collections of individuals; not random in the sense of being picked out of a hat, but random in that becoming a major league hitter is so difficult—and difficult to forecast—that each hitter ultimately works out his own combination of patience, preferred pitches, and preferred hitting zones, regardless of what his general manager prefers. It would be a tall—and probably impossible—order for any hitting coach to remold this varying collection of hitting philosophies, and it’s not like every hitting coach can be Dale Sveum.
Hitter patience, then, seems to come back to the individual. Both patient and impatient hitters tend to insist that their approach stems from a desire to look for the right pitch. For the impatient hitter, it’s about not letting a good first pitch go by. For the patient hitter, it’s about not swinging at a pitch until you see something you like. And on many teams generally viewed as patient or impatient, you probably will find hitters who exemplify both philosophies.
And what of the seemingly sage words of Overbay? Well, they actually make a great deal of sense for Lyle Overbay. He is at the end of his career, batting at the bottom of the Brewers lineup, and usually only when he has a platoon advantage. Of course Overbay would welcome the chance to take on the tired starter whom the opposing manager foolishly refuses to remove. But what makes sense for Overbay does not seem to translate to the league as a whole, regardless of whether patience or impatience is your preferred batting philosophy.
This article, and its conclusions, seems to be dependent on how the author chooses to define ‘patience’. IMO, P/PA is a rather poor way to do it. Actually, the term ‘patience’ itself is a very incomplete way to describe the act of ‘PA management’. Taking pitches, in and of itself, is neither good nor bad. It depends on the ‘hittability’ of the pitch, and the batter’s ability to put it into play when he does swing. It pretty much comes down to how many balls the batter gets (=ball 1, ball 2, ball three , ball 4, and HBP) versus how many strikes he gets (= strike 1, strike 2, and strike three). That is different than just BB and K. And more goes into it than simply taking more pitches, or having a higher P/PA. I mean, you can be average in everything else, such as OSwing% and ZSwing% and have a high P/PA simply because you have trouble making contact.
So you suggest seeing the correlation between Team Z-Swing% and the other stats? I could get behind that, but I doubt there would be much difference.
I agree. Tony Gwynn, Don Mattingly, and George Brett early in his career didn’t walk much, hardly ever struck out, and yet they rarely swung at bad pitches. But they all had such extraordinary hand-eye coordination – even when compared to the Gods of the baseball world – that when they swung at pitches, they hit the ball hard and put it into play, rather than fouling off pitch after pitch. Gwynn, Mattingly and Brett were all patient hitters, but their patience cannot be measured by P/PA or BB rate.
Hitability of a pitch. Now there is a word and quite a concept. How would you define it exactly? I’ll start with any pitch legitimately in the 9 box pitch track strike zone. When an ump calls a strike that is clearly NOT part of the 9 box strike zone, well I would nix these ‘strikes.’ Next, you can nix all those truly legitimate strikes in the strike zone where they are really +++ pitches, like a fricking breaking ball, either back or front door, that hits the corner after a batter has been jelly legged and totally gave up on it because it had 6-10 inches of break (or whatever standard of cut you want to set) However, a fastball at the knees on the corners I would still consider a hitable pitch. Where do we go from here? Wherever we go, Joey Votto better get a real batting eye, because I consider up in zone corners or down at the knee corner fastballs legit pitches that CAN be hit for extra bases, doubles in the gaps or down the line. This only swing at down the middle stuff, and you would get penalized by me for passing up certain other corner pitches, as too narrow minded, especially when there is a whole field in front of you. You can hit opposite field ya know, good hitters do that.
The a’s have good eyes for the zone they take a lot of pitches while being first in walks and near the bottom in K’s, they also seem to have a good philosophy for this, in the sense that they usually push starters out early, and get to face those juicy mediocre 5-6th inning guys instead of only starters and the 8-9th dudes.
Just a thought, I know Beane initially looked at P/PA several years ago as a means to get some value on the margins from dirt cheap players. Perhaps the grip-it-and-rip-it teams achieve their productivity through more home runs, while patient teams produce via aggregate station-to-station approaches. So, it’s not that Beane was “right” or “wrong,” but it was efficient for him because grip and rip guys were (and are) out of his price range so he found the RIGHT high p/pa guys.
Also, the three successfully patient offensive teams (Oak, Tor, snd Cle) are three of the most analytical teams, which leads me to believe they know something(s) that this basic simple linear regression doesn’t.
Except the A’s are in the top 5 in HR the last 3 seasons in MLB…
True. Which is why a simple linear regression here is stupid. Does this author think Beane and his staff of Ivy League assistants sit around and run a serious of simple regressions? Hahaha
Series*. Sorry, typo.
I imagine if you ran several multiple regressions you can isolate the cause of where P/PA has value and where it may not. The fact this crap article is gaining steam cracks me up. I hope people buy into patience being random. That would be awesome.
Try this: Look at outcomes for the very first batter a reliever faces.
Batters get impatient waiting, and it’s probably a visual selection effect, but I see a lot of first pitch outs after the pitching team has run thru some stalls before the reliever walks in.