Brewers TV Statistician Mike Falkner and the Evolution of Baseball Broadcasts
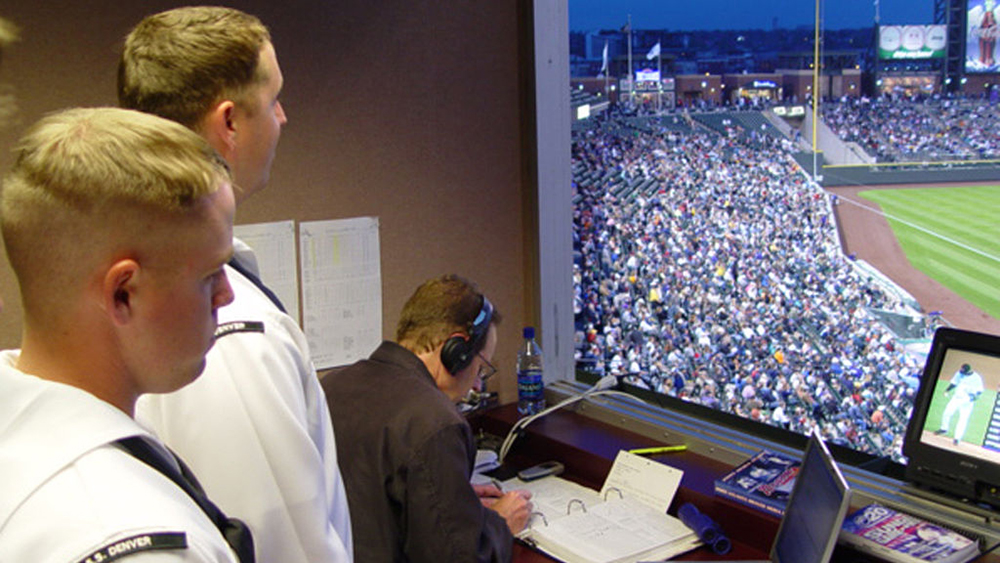
It’s going to take time for TV broadcasts to fully embrace advance statistics for its audience. (via US Navy)
Wisconsin native Mike Falkner has a job any sports fan would love to have. He has the pleasure of sitting in the TV booth next to Brian Anderson and Bill Schroeder for the Brewers broadcasts and providing them with on-the-spot statistics related to what is going on on the field in any given moment. In addition to Brewers broadcasts, he currently does Milwaukee Bucks broadcasts, and he has spent time in the booth with the Green Bay Packers and Marquette Golden Eagles men’s basketball team.
Falkner has been with the Brewers for about 12 years and has been covering the Bucks for about 30. He is one of the most knowledgeable people out there when it comes to the past and present of Wisconsin sports. And while working in the industry over those many years, he has seen the evolution of television broadcasting and in-game analysis.
Technology, as we have seen throughout the years, has been evolving both in and out of sports. Today, anybody can go onto FanGraphs or Baseball Prospectus and find the stats they want, whereas if you wanted to know something about a player decades ago, you had to search the back of his baseball card or look it up in the newspaper.
What Falkner said has changed the most in terms of technology in sports is just how much more can be done inside the production truck. His job used to be about 50 percent with the announcers and 50 percent with the TV production truck, but today much of what he used to help with inside the production truck is now automated with programs. What Falkner does now, in the booth with Anderson and Schroeder, is sort through the information taken from these databases to find the relevant statistics and have it ready to use when the situation in the game arises.
For example, before the game Falkner would do research on various pitchers, and if he were to notice a player is 6-for-8 with a couple home runs against a certain pitcher, he would have that stat queued up for the TV announcers to say on the TV broadcast. This kind of information quickly can be sorted through in the TV production truck outside, but to have that information be communicated to the announcers within seconds is the reason Falkner is important to the broadcasting team and why he is in the TV booth full time and no longer in the production trucks. As a result of spending countless hours next to Anderson and Schroeder, he has picked up on what makes each of them unique. For example, by observing Anderson for a handful of seasons, he notes how impressive he is at multitasking.
“Brian is the king of multitasking,” Falkner says. “He’s got his phone going, his iPad going, and people in his ears talking.” Falkner is a contributor along with both announcers in doing pre-game and in-game research. While the announcer’s main jobs are to inform the viewers about what goes on during the game, Falkner is able to take much of the research burden off them.
The in-game graphics both on TV and in the play-by-play have come a long way in the past few years. In baseball, there is a push to educate the common baseball viewer about sabermetric stats. In Miller Park for instance, no longer is batting average displayed next to the batter’s name, but instead, it lists OPS. Baseball is trying to draw a fine line between keeping the old-school fans happy with traditional stats and those fans who are transitioning into more sabermetrics. To get a feel of where the average Brewers fan may be when it comes to more advanced metrics, here are the results of a Facebook poll in which 177 Brewers fans responded to whether they preferred batting average or OPS next to the hitters’ name on the jumbotron:
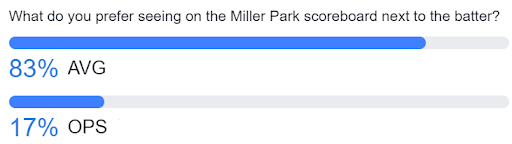
An overwhelming majority continue to prefer batting average. Falkner explains, “I think a lot of the [sabermetric stats] are interesting, but I also think for the average fan that it’s almost too much.” He goes on to say that for the average fan, knowing the stat is one thing, but to interpret it is another. It takes work to learn what the numbers indicate about a certain player if you only watch baseball a couple time a year.
Falkner noted that throughout the years, the information he gives the announcers has remained nearly the same. A striking similarity when it comes to broadcasters in any sport now is that one usually is more pro-sabermetrics while the other is not. As an example, Falkner shared that for the Milwaukee Bucks, there is a difference in how the announcers broadcast the game.
“Jon McGlocklin is more old-school,” Falkner said, “while Marques Johnson is more new-age when it comes to the latest NBA stats.” He said it is similar for the Brewers, where Anderson is more into the newer stats whereas Schroeder is not so much. Therefore, the importance of a guy like Falkner is to stay within the average fan boundary. If the broadcast were to go too stat-driven, an entire market would disappear. On the other hand, many of the newer fans are drawn into the game via the more analytical approach.
Much has changed throughout the years, but today most broadcasts continue to have similar graphics to those used in the 1980s. Let’s examine what they looked like starting in 1989 and progressing through the end of last season:
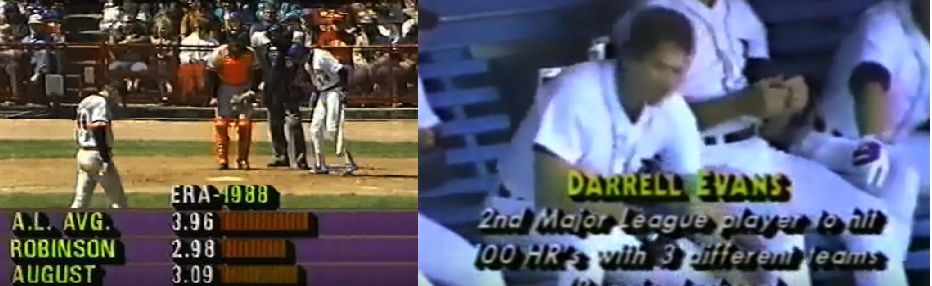
This Tigers vs. Brewers broadcast from 1989 had a nice idea of putting the league-average ERA followed by the pitcher’s ERA for comparison. They also add in the current month to illustrate current performance. The downfall here is that they only display ERA. The kind of fact listed in the image on the right is similar to what Falkner researches and has on hand for today’s TV broadcasts. Those kind of facts never lose style, as they are the “fun facts” fans always will be interested in. Clearly, a lot of progress happened between 1989 and 2018. Here is a look at a 2003 Red Sox/Yankees game:
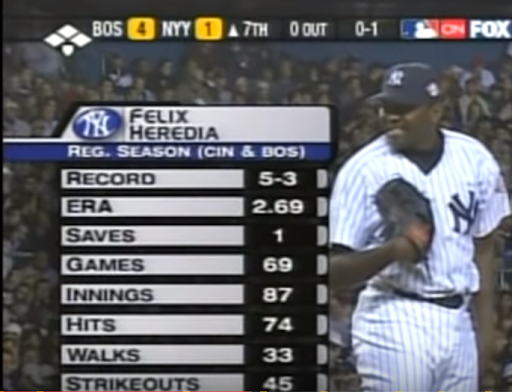
While ERA remains a staple, here we see many more fields have been added. Record was added, which may not be popular for followers of Brian Kenny. Hits, walks, and strikeouts are good additions given that innings pitched was also included for reference.
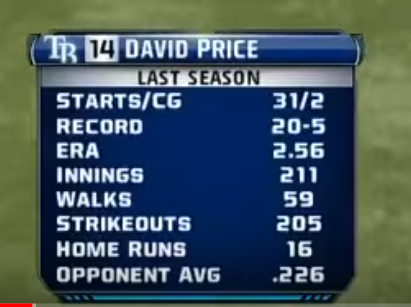
Here is the graphic the Rays broadcast put up in 2013. From 2003 to 2013, not much has changed in terms of pitcher metrics. The new addition is opponent average. Adding opponent average was the first of the “advanced” stats to be broadcast. Announcers love to bring this up on TV, as it gives an indication of how hard the pitcher has been to hit thus far. Now here is the current format:

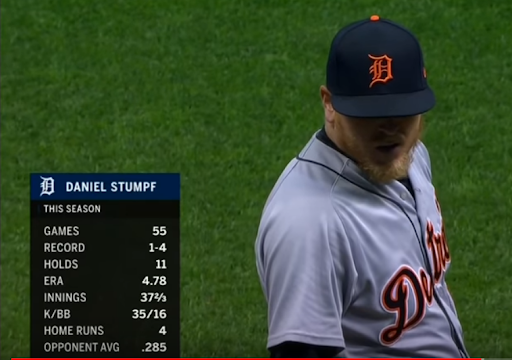
This is very similar again, as ERA, innings, home runs, and opponent average are still listed. They still have strikeout and walks, but they are listed differently in a K/BB format. Being a middle reliever, they started listing holds to parallel closers and saves.
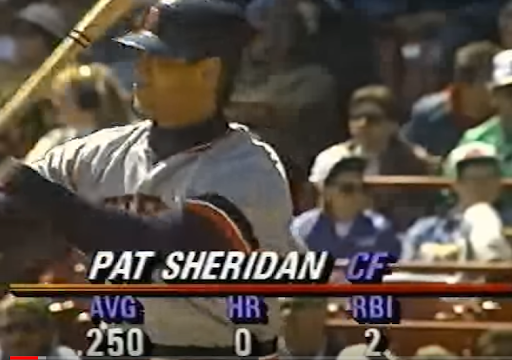
As for hitting, here is the difference between 1989:
and 2018:
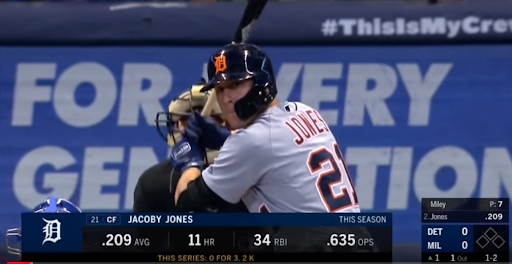
Not much has changed over the course of 30 years. The Triple Crown stats still are headlined, except in 2018 the broadcast included OPS. While more advanced stats could be used to better evaluate a player, as mentioned previously, there may be fear of scaring away the old-school baseball fans who have no interest in trying to interpret a whole new set of numbers.
To experiment with this, in the 2018 Wild Card broadcast, ESPN2 debuted a Statcast broadcast. In this production, they would use wRC+, FIP, sprint speed, and other metrics when it made sense to use them.
MLB Network regularly uses Statcast during their broadcasts or in-game look-ins. However, anyone watching MLB Network is most likely more of a baseball fan who has been exposed to these advanced metrics, unlike the casual fan. The key was for the announcers to clearly define when and how the stats are used. Mark Simon of Sports Info Solutions gives a great reason for the success of the broadcast.
One of the reasons I think this @statcast broadcast works is you have the ideal combo of stat researcher/writer & former player.
Each has their expertise and the play-by-play guy steers them well. A good crew on ESPN2 tonight
— Mark Simon (@MarkASimonSays) October 3, 2018
While the Statcast broadcast for the Wild Card game was a one-time experiment, this could lead to more local broadcasts exercising the usage of Statcast into production. In Milwaukee, this is the direction the broadcasts may begin to move towards. As Falkner mentioned, Anderson is constantly researching throughout the game, while Schroeder can speak to the on-the-field play from the reference of a former player. As a result, the combination of the announcers is important given the way the broadcasts hope to convey information. Finding announcers who get along and appear to naturally interact with each other on the same wavelength is an often-overlooked aspect to successful TV broadcasts.
When it comes to the TV broadcasts, chemistry cannot be overlooked. For those who regularly watch the Brewers on TV, the dynamic in the booth with Anderson and Schroeder seems so natural, as if they are genuine friends just discussing a baseball game. The chemistry always has appeared to be spot-on between those two. When asked what it is like sitting next to them, Falkner said:
It’s one of the blessings of my job working with the people I do. The chemistry they have is not fake. They really do enjoy working with each other. They are the perfect combination for partners. Bill is just easy to work with and a good guy, and Brian is so good at what he does. They feed off of each other very very well. They are both elites in what they do, and I feel blessed to be able to work with them every night, and you become such good friends.”
As many regular baseball viewers may know, the games are not necessarily non-stop action. The lulls in the game can drive viewers away. What make guys like Anderson and Schroeder so special is the way they can interact with the viewers by sharing personal stories they have with the player, or in the case of Schroeder and other former players, share experiences they had while playing.
Today there are a multitude of former player announcers including John Kruk, John Smoltz, and Ron Darling, all of whom speak of their playing days during broadcasts. On the other hand, many of them come off as being anti-sabermetrics, speaking out against some of the methods used in today’s game. The benefit of having two announcers, one that is pro-sabermetrics and one that is not so much, is to please both sides. What people do not want are ex-players taking the persona of grumpy old men on baseball broadcasts.
Popularized by Moneyball, baseball has become the sport that people look to when they think of a data-driven sport. This is also the case regarding TV broadcasts. Baseball is headlining a stat-driven broadcasting movement throughout all professional sports. As a viewer, when you can understand more in-depth what makes a certain player special, whether it be speed, reaction, power, or anything else, it can make watching the game on TV much more exciting.
In the 2019 NHL Skills Competition, they experimented with tracking devices on the players measuring speed. A few years ago, the NFL began using a Statcast equivalent, NextGen Stats, and incorporating it into their broadcasts. Today, viewers are able to see the total distance run on a route, acceleration, throwing velocity, and much more.
In an interview given for an NFL NextGen Stats special, CBS coordinating producer Ross Malloy said, “The way we integrate NextGen Stats into the broadcasts is basically by following along the storylines of the game.” In this statement, Malloy emphasizes the importance of making sure not to bog the viewers down with unnecessary information. For example, in the MLB Statcast broadcast, there would be a negative response if, randomly in the middle of an at-bat, they started talking about the defensive metrics of the utility player who will not see the field on that given day.
Falkner, having the role of being a statistician for both basketball and baseball, notes there is a big difference in the style of information he provides between the two sports. “With the Bucks and basketball being fast-paced, it’s mostly keeping score, keeping track of [scoring], and on-going stuff. In baseball, it’s different information given situations that may arise or might happen.” In both roles, he is providing information as it relates to the current state of the game.
Baseball broadcasts are progressing slowly but surely. One can only imagine what they might look like 10 years from now. Might FIP replace ERA? Could OPS replace AVG, followed by wRC+, hard-hit rate, and other deeper hitting metrics? While the Statcast broadcast trial went well last fall, it still may be a long way off from every local broadcast looking like that. As for Milwaukee broadcasts, Falkner will continue to work closely with Anderson and Schroeder doing what he has been doing for the past decade and a half, relating to the fans by providing relevant information people will find interesting regardless of old-school or new-school fans.
References & Resources
- BigTMLB. “April 2, 2013 – Baltimore Orioles vs. Tampa Bay Rays.” YouTube, 25 Dec. 2013
- Flabuck. “2018 09 29 Detroit Tigers at Milwaukee Brewers – 1080p HD.” YouTube, 3 Oct. 2018
- Interview with Mike Falkner 3/8/2019
- MLBClassics. “2003 ALCS, Game 7: Red Sox at Yankees.” YouTube, 14 Sept. 2010
- NFL. “The Future of Next Gen Stats | NFL NEXT.” YouTube, 30 Nov. 2015
- Nowlin, Mark. “Detroit Tigers at Milwaukee Brewers, April 23, 1989 Pt 1.” YouTube, 6 Dec. 2014
Nice post. For me if a broadcast is able to integrate analytics that’s a nice bonus, but there are a ton of things way more important to creating an enjoyable broadcast. As long as the announcers aren’t actively hostile to analytics then I’ve made my peace with the prevalence of traditional stats that still dominates. The biggest things I look for in announcers are that they’re paying attention to the game that’s going on rather than always rambling off-topic, and keeping the cliches to a low roar.
Small note, but I’m willing to bet “August” in the 1989 graphic refers to Milwaukee pitcher Don August, not the month of August.
I also had the same thought that “August” didn’t refer to the month, but the Milwaukee pitcher. I looked at the game logs and found this April game between the Tigers and Brewers:
https://www.baseball-reference.com/boxes/MIL/MIL198904230.shtml
This game is consistent with the screen-grab above, which features Milwaukee hosting the game at County Stadium. Jeff Robinson of the Tigers was the starting pitcher vs. Don August of the Brewers. You’ll notice the Brewers are wearing their home uniforms, while the Tigers have on their road grays. The players shown are wearing long sleeves under their uniforms, which would make more sense for an April game in Wisconsin, rather than a game in the month of August, which even for Milwaukee should still be short sleeves weather.
Thank you for reading! I did not realize the potential of an August confusion until you mentioned it haha.
That was subtle and could happen to anyone. Normally when you have a fact failure you write oops we saw it and corrected it, but this case would have required a small rewrite which would not be worth it. No error on a bad hop. Go get ’em next time, champ! Loved the article!
Great article, thanks. Here is my current take, as a season ticket holder and life-long baseball fan who certainly appreciates analytics when reading articles or reviewing statistical charts and such, maybe not so much on TV or at the stadium.
Batting average is the number of hits divided by the number of at bats. Period. You can compute it for a player for a game, a week, a year, a career; you can compare it to any other player in any other era. Is it perfect? Not on your life… Look up OPS – a really quick look shows we have OPS, OPS+ and wOBA which, they say, is OPS modified more. You can’t compare much of this across eras, even across stadiums and such. So you see “OPS” on the scoreboard or TV screen for a player – what does that mean? Which OPS? The announcers aren’t going to explain, or the public address system.
Maybe one day the new baseball analytics will be stabilized to the point where simple explanations of the statistics and simple comparisons between players can be done, and maybe then the great majority of baseball fans will understand them enough to find value in them. But, I’m afraid, when that time comes there will be a whole new group of stat-heads (or maybe by then robotic stat-heads) with a whole new set of metrics based on God knows what, and they will be saying “OPS? We really need to replace this with K*hrt77zip” – which requires a super-computer to compute!
I mean, OPS is OPS, it’s not like WAR where there’s more than one version.
Personally I’d just like to see triple slash lines utilized more. AVG OBP and SLG are all traditional stats and presenting them together tells you way more about a hitter than counting stats like HR and RBI.
Thank you for reading! It will be interesting to see what will happen when a new generation of fans are more prevalent.
Nice write up.
I like that broadcasts are incorporating more advanced stats.. I mean why not?? Sure you don’t want some graphic to pop up that takes up the entire screen, or feature so many statistics that no one can read them all. It’s all about picking the most appropriate ones for each situation.
Here’s what I’d like to see:
(When hitters come to the plate): Obviously their name, position and their H/AB for that current game; but I’d like to see their triple slash (BA/OBP/SLG) and next to it their wRC+. I like OPS, but without the entire slash line it’s hard to know which the player is excelling/struggling in.. is it their OB% or their SLG%?.
wRC+ is extremely easy to determine if it’s good/bad on the fly. If it’s above 100 than it’s above-avg and if it’s below 100 than it’s below avg. Simple. Just with those stats alone (with HR/RBI/R/SB) you can pretty much tell how the player is doing for the season, and you’re not getting into anything too complicated.
K% and BB% would be nice as well sometimes. For players with smaller sample sizes it would properly put their walks and K’s in perspective.
Thank you! Yes, I agree with wRC+ being a great metric that can be easy enough to teach the casual fan and provides better insight into a players offensive production.
I like the idea of having people engage between sabermetrics and traditional stats, which Brian Kenney does to some extent on MLB Network. Let the announcers debate why wins is or is not a valuable stat. But I hate when you have one of those guys like Joe Morgan was who simply says “so-and-so knows how to win.” I do believe that more and more of the on-air people, even most of the ex-players are becoming more comfortable or at least less hostile to sabermetrics. On the other hand, I don’t like some analysts (e.g., Keith Law although he’s not on TV) who simply want to do away with the traditional stats . I think there is a place for discussion of the non-quantifiable aspects of baseball-which I think inheres in every human activity-without simply dismissing it as old-school.