Coming in Cold 2: Lifting the Pinch-Hitter’s Penalty
Mark Sweeney made a career of being a pinch-hitter. (via Loreal Reid)
Last month, I indulged myself in some looks at the more notable pinch-hitters in baseball since the 1960s. While I was concentrating on individual performances, I did pick up a hint of more general trends, including something that could upend recent received wisdom. When I thought I was finishing with my pinch-hitting research, I was instead moving into a second phase.
Familiar to modern followers of sabermetrics is the “pinch-hitting penalty.” Unearthed by the trio of Tango, Lichtman and Dolphin in the famed The Book, it states that players hit worse when pinch-hitting, and to a lesser extent as designated hitters, than they do when starting a game in the field. The penalty comes to about 10 percent of a player’s wOBA (five percent as DH).
When I looked up the most prolific pinch-hitters in baseball history, those with 300 or more opportunities, a PH penalty did show up, but less than one might expect. Their tOPS+, comparing pinch-hitting performance to overall career production, was around 91, against an average of 100. Since OPS+ drops about two points for each percentage point of wOBA lost, this shows a penalty closer to five percent than 10.
This got me thinking that more frequent pinch-hitters might see a smaller penalty than occasional ones, for a variety of possible reasons. So I decided to look closer at the numbers, for both the occasional and frequent bench bats.
Practice Makes Average
I took samples of pinch-hitters from the 2005 to 2014 seasons. I chose five groups in each season: players with one pinch-hitting plate appearance in that season, with five, 10, between 20 and 25, and 50 or more. I thought that would give me a good spread, revealing any patterns that emerged as PH chances rose.
I measured the average tOPS+ for pinch-hitting in each group. In the two high groups, this involved weighting the tOPS+ numbers so a player with 75 PAs would count half again as much as one with 50. In essence, this produces a mean average for the PAs rather than the players.
(There were instances where players did not generate a tOPS+ number. Either their pinch-hitting produced no official at-bats due to walks, sacrifices, and such, or their overall batting produced a zero OBP or SLG and calculating tOPS+ would thus have required dividing by zero. I left these out of my averages. With the small samples generally necessary for such anomalies, I hope this does not seriously skew the numbers.)
I was hoping for a rising line, with pinch-hitting tOPS+ breaking above the presumed average of 80 as frequency of opportunities rose. One spike notwithstanding, I was not disappointed.
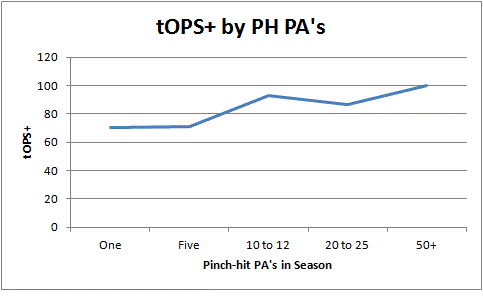
tOPS+ by Season Pinch-Hit Plate Appearances 2005-2014
| PH PAs per Player | One | Five | 10 | 20-25 | 50+ |
| tOPS+ | 70.2 | 71.2 | 94.4 | 86.5 | 100.2 |
| Ttl. PAs in Sample | 967 | 1725 | 1580 | 6215 | 7304 |
The infrequent pinch-hitters showed a combined tOPS+ just above 70, but those getting 50 or more opportunities hit in them just as well as in the rest of their plate appearances. As for the 10-PA cohort, there seemed a mundane explanation for their big numbers.
Take the one and five-PA players as a group, which their similar scores make plausible, and the 10s are the smallest sample. I originally went straight from 10 to 50-plus, and inserted the 20-to-25 group to get a good intermediate sample. Doing that produced a more satisfactory trend line, but I hoped for something better.
I expanded the 10-PA sample into 10-to-12, thinking to bring the outlier back into line. It did … a little. Enlarging the sample from 1,580 PAs to 4,831 pulled the tOPS+ down from 94.4, but only to 93.1, still well above the 20-to-25 sample. The outlier remains, now with a stronger statistical base.
Looking at the numbers from a different perspective changes the shape somewhat, but not the direction. The sOPS+ metric measures, in this case, the pinch-hitting of each group against all league pinch-hitting rather than the player’s overall batting. Measured against their own types, the pinch-hitters start with a deeper deficit against average, but clear it (as mathematically they must) fairly early—with the same nuisance of an early peak.
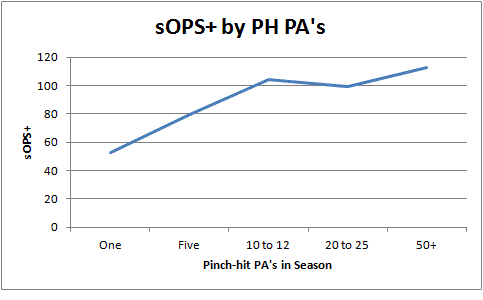
I am puzzled to offer an explanation why pinch-hitting performance should quickly reach that peak, fall back with further repetitions, then catch a second wind and rise to parity with overall batting. With some reservation, I will chalk it up to happenstance and concentrate instead on the general upward trend.
We need to be cautious in drawing conclusions here. The obvious, reflexive one is that players do better at pinch-hitting the more they pinch-hit. One could suggest that managers pick out the players who do well in this role and give them increased opportunities, thus producing the effect by selection rather than practice. It’s hard to see them managing this by the necessarily small sample sizes, so if it happens it may be instead due to seeing good processes at the plate during these chances.
The numbers, though, aren’t quite saying that players improve at pinch-hitting with practice. They say they improve, relative to their overall batting. Part of the narrowing of the PH penalty may well come from being less effective in standard batting situations. Perhaps this is due to fewer regular batting chances, by the same mechanism that makes them more often eligible to pinch-hit. Perhaps it’s less generally effective batters getting put frequently in a PH role because they aren’t starting.
Side-Trips
I had hopes of teasing some overall player batting numbers out of the intersection of tOPS+ and sOPS+ scores, rather than grinding through close to 2,000 player-seasons directly. By comparing tOPS+, based on a personal baseline, with sOPS+, based on a league baseline, I could reconstruct how players did in all their batting chances, within an acceptable fuzzy range. That could show whether players get more PH chances with rising batting lines, or get drawn off into regular play and leave the pinch-hitting to lesser bats.
I did get some numbers out of this, but nothing stunning. Single-PA pinch-hitters were way below the other categories in season batting. That could be either the small sample, or the cup-of-coffee guys pulling down the average (you’ll see a bit more on them in a couple paragraphs). For the other cohorts, overall batting improved with rising pinch-hit PAs, but the difference from “Five” to “50-plus” works out to less than five points of OPS+. It’s simply not a strong effect.
The loss of regular hitting opportunities as one’s PH plate appearances rise is confirmed by the 2005-2014 statistics.
Season Plate Appearances by Pinch-Hit PAs 2005-2014
| PH PAs | One | Five | 10-12 | 20-25 | 50+ |
| Non-PH PAs Avg. | 229.0 | 294.4 | 265.8 | 245.3 | 141.9 |
| All PAs Avg. | 230.0 | 299.4 | 276.8 | 267.6 | 203.8 |
The “One” category is pulled down by a thick leavening of short-time players, September call-ups and the like. For example, 19 of the 104 batters in 2014 with one pinch-hit plate appearance had nine or fewer PAs overall. This helped counter the 21 players who had at least 600 PAs, but pinch-hit just once, on a rare day off. (The full-timers’ average tOPS+ for their one-shot attempts was an awful 5.1. More amusing than probative, but I still note it.)
For the rest, more pinch-hitting means less regular batting and less overall batting. Those in the highest category were doing a full 30 percent of their hitting coming cold off the bench. The theory of reduced non-PH batting closing the performance remains viable, though not proven.
I note with interest that the top cohort does as well in the 30 percent of its plate appearances that are pinch-hitting as in the 70 percent that are more regular times up. If it was just differences in experience closing the gap, with extra repetitions always improving performance, we’d only reach parity at 50/50. There is more at work.
Two obvious differences in pinch-hitting environment that could affect the split numbers work at cross-purposes. Pinch-hitting generally comes late in the game, greatly raising the likelihood of facing the bullpen, which performs better than starters. (By 3.60 FIP to 3.81 in 2014.) Contrarily, there is a better chance of a favorable platoon match-up for a pinch-hitter, for obvious reasons.
Fine-tuning the numbers with relief and platoon effects is beyond the scope of this article. (Translation: Egad, that’s a lot of work that might not add up to anything useful.) It may affect where pinch-hitting parity is reached, but it doesn’t impinge on the overall upward trend toward that parity. I’m content to de-emphasize position for momentum, and that’s quite enough quantum physics for today.*
* Except to say that, until you open the box, the cat is a switch-hitter.
I stumbled across another possible indication that added repetitions improve relative pinch-hitting success. I collected complete league pinch-hitting totals for four spaced-out years, every third season from 2005 to 2014. Originally I was seeking evidence that pinch-hitting was fading out as rosters grew constricted by the proliferation of relief pitchers. I’ll discuss what I found there a bit later.
What I also found were league tOPS+ pinch-hitting figures rising and falling with the total number of PH plate appearances in the majors. It was only for four separated years, though, and the magnitude of tOPS+ movement was greater than the relatively slim changes in PAs seemed to warrant.
When in doubt, get more data. I filled out the entire 2005-2014 decade.
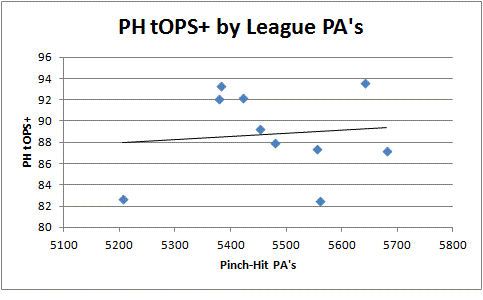
And the mirage vanished. tOPS+ does still rise a bit with increasing PAs, as the trend line shows, but with an R-squared of 0.0122 it proves nothing. I tested it again, charting tOPS+ against how many pinch-hitting PAs each batter who served as a pinch-hitter had. (That average ran between 8.7 and 10.0.) Again, a slight rise, but the R-squared was barely any bigger, so no relationship was established. I won’t clutter the page with a graph that looks just like the previous one.
As for how much pinch-batting is being done, results are firmer there. Measuring either by total plate appearances or PAs per hitter, pinch-hitting has been fading recently. Over the last decade, the trend lines say raw plate appearancs are sinking by half a percent per year, and PAs per pinch-hitter are falling three-quarters of a percent per season. The R-squared for each is around 0.35, showing a correlation that is moderate shading toward strong.


Opportunities for a player to act as a pinch-hitting specialist have contracted faster in recent years. In the seasons leading up to 2010, there were never fewer than 11 players who got at least 50 PH plate appearances. From 2011 on, there have never been more than 10.
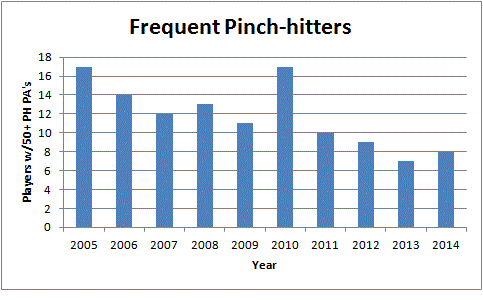
The assertion that the growing bullpen is squeezing pinch-hitting thus receives support from a couple of directions. It’s misleading to call it proof without a clear chain of cause and effect, but the numbers do back what common sense suggests.
Conclusion, with Opinionated Coda
I have not overthrown the pinch-hitting penalty as a tenet of baseball strategy, but I have found reason to modify it into something less rigid and more responsive to performance experience. The PH penalty fades as players get more repetitions in the role, to the point of parity with their other hitting once one surpasses 50 PH plate appearances in a season.
There is some irony, therefore, that the demands of modern roster construction are eroding opportunities to gain the benefits of pinch-hitting experience. Specialization is increasingly the watchword in baseball, and nowhere more clearly than in the bullpen. Rising numbers of relievers are deployed in narrowing roles to wring every drop of leverage advantage out of the game.
This ends up strait-jacketing the bench, resulting in the decline of pinch-hitting opportunities I have noted. One brand of specialization chokes out another. Plus, if dwindling opportunity leads to the decline in effectiveness that I’ve found, managers will use the strategy less often even when they have the flexibility to do so. The decline of pinch-hitting could become a vicious cycle.
I will also note that pinch-hitting could receive a very serious blow if, as is increasingly being called for, the National League implements the designated hitter. The NL has more than twice as much pinch-hitting as the AL, 3,824 plate appearances to 1,655 last season. Dropping the NL to a DH level of pinch-hitting would take about 40 percent of the pinch-hitting out of baseball.
Of course, this may be fine with you. It might be a price you’re willing to pay to get .053 hitters out of the batter’s box. For my part, I’d consider it a pity. Not only would it take some strategic variety out of the game, it would reduce the role of pinch-hitting just when we’re starting to understand it better. Good luck convincing me that taking the smarts out of baseball improves the game.
Almost any time you look at performance and number of opportunities, you tend to get a positive correlation from selection bias. Players that have some pinch hit PA and do well tend to be called on again to PH and players who are not initially successful are not. That is likely the cause for most or all of the effect you find, my guess would be.
Did you look to see if there was a positive correlation between a pinch hitters OPS+ and their number of plate appearances? By your theory, as an individual pinch hitters plate appearances increase, so should their OPS+. As an example: Perhaps, when total pinch hit appearances equal 1, the penalty is 10%. However, with more experience and additional pinch hit at bats, the penalty approaches 0%. I think this correlation would help to better your argument.
Nice post, Shane. I loved your sideways reference to quantum physics with a switch-hitting cat. No doubt you have to factor in the defense with the opposing team having a dog at SS. Seriously (yeah, I get serious once in a while), now do some historical crunching for the pre-DH era. You would get more PH specialists, the vet with a good bat and bad wheels and the good ol’ iron glove, both of whom would be DH if anything today and signing as an FA in the AL to do it. But here I go being a lazy bum and suggesting work for someone else to do.
Not only did you reference Schroedinger’s cat, you used the word “coda” and made it seem natural. Impressive.