Daily Graphing: Juan Padilla
A few days ago, Dave Studeman wrote about the statistic LOB% (percent of baserunners left on base). While he stated LOB% isn’t necessarily a “luck” statistic, I’m going to use it today as if it were one with some discretion, of course. I was thinking that for pitchers there are currently three statistics that are considered to be in some sense a measure of luck. There is batting average on balls in play (BABIP), percentage of fly balls that are home runs (HR/FB), and the already mentioned LOB%.
I wanted to find the “luckiest” pitcher in 2005, so I decided to combine the three “luck” statistics in a crude attempt to create a “Luck Factor” for pitchers. I used the formula (BABIP + (3 * (HR/FB)) + (1-LOB%)). While I’m sure there are a few problems with this formula that I quickly threw together, it will definitely point you in the direction of some of the biggest luck offenders. I couldn’t help but laugh when, at the very top of the list, I saw Juan Padilla. Oh great, another Mets reliever! So without further adieu, let’s see what made Padilla so “lucky” in 2005.
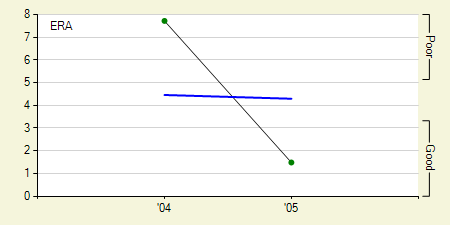
Starting off with ERA, his first trip around the majors was pretty awful. In 2004 he had an insanely high ERA of 7.71, which plummeted to an incredibly low ERA of 1.49 in 2005. With such a steep decline, I’d expect some sort of drastic change in his strikeouts or walks. This was not the case.
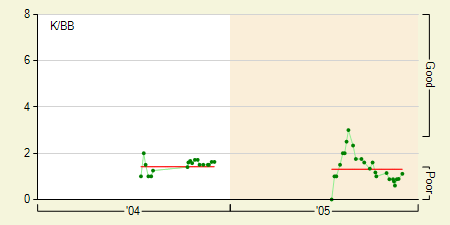
In 2005 his strikeout to walk ratio (K/BB) was slightly worse than it was in 2004. His strikeouts per 9 innings (K/9) was a poor 4.21 and his walks per 9 innings (BB/9) was a pretty average 3.22 bringing his K/BB to a poor 1.31. His minor league numbers definitely deviated from his major league numbers where he managed a pretty healthy K/9 of 8.22 the past two seasons in AAA.
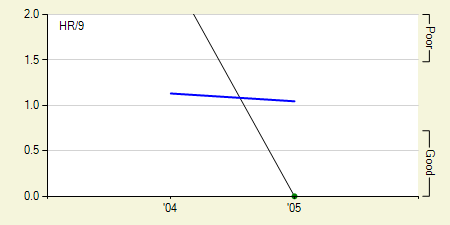
Moving on to the part which made him the “luckiest” pitcher in all of baseball, he gave up zero home runs last season. I don’t care who you are, things like that generally don’t happen more than once. To go with his zero home runs, he had an extremely low BABIP of .219 and a pretty high LOB% of 81%. Combine all three of these and he had the best single season “Luck Factor” in the past four years! Pitchers with a K/9 under 7 that have displayed similar luck have seen, on average, a 2 point rise in ERA the following year. Here are those same pitchers that had an ERA under 2 and what their ERA did the following season.
Name		Year1	Year2	Dif
Buddy Groom 	1.60	5.36	3.76
Paul Quantrill 	1.75	4.72	2.97
S. Hasegawa 	1.48	5.16	3.68
Steve Kline 	1.79	4.28	2.49
While I’m not saying Padilla won’t improve his strikeouts or walks (mainly strikeouts) in the major leagues and become a quality pitcher at some point, I think there is little to no chance he’ll do nearly as well as he did last year. If there’s no improvement in his strikeout rate, I’m pretty sure you’ll see a pitcher next season that none will be too thrilled with.