Do The Splits

One big reason the Mets brought Jeurys Familia back is because of his success against the NL East. (via slgckgc)
There were 1,379 players who played at least one major league game last season, but hundreds of them will be playing for a different team this year. A player could have been traded or signed as a free agent. However he was acquired, the team must have had some reason to sign him. Correct me if I’m wrong, but I have never heard of a GM signing a player, then immediately saying, “Yeah, we already regret this. We think [insert player here] is going to be terrible for our organization.” Even John Mozeliak said Greg Holland would make the Cardinals stronger–oops.
There are so many reasons why one team may pick one player versus the next. Money, age, position, and skill level are all factors in determining whether to pick the player that could be the best fit for the team. The Cubs, for example, could have signed DJ LeMahieu in the offseason, a player who originally was in the Cubs system before going to Colorado. Instead, they went with Daniel Descalso, who signed for $5 million versus LeMahieu’s $24 million. Nobody can predict the future of how well a new player can impact the team, but data on the players sure help!
For a lot of these teams, it is all about filling in the holes that made them fail to make the playoffs or win a World Series. I have identified five players and five splits to try to explain at least one reason why this team signed or traded for that player, from the biggest free agent signings to players you may have not even realized were on your favorite team. There are a lot of ways these players will help their teams this season; these splits could be among them.
Manny Machado: First-Inning Hitting
I likely don’t need to explain to you how the Padres signing Manny Machado will make the team better. There are so many ways we could demonstrate how he can help in San Diego. For instance, he could be the first Padre to hit 40 homers and drive in 100 runs in a season since Phil Nevin…in 2001!
The Padres’ offense last season had many notable flaws, but what struck me the most was the fact that they rarely jumped out to a lead at the start of the game. They created 72 runs in the first inning, which was tied for the sixth fewest in baseball, 57 runs behind one of their division foes (and the league leader), the Diamondbacks (129). The reason? Well, the hitters either struck out or grounded out. When the Padres allowed the first run of the game, they went 22-70. The dearth of comeback wins led to 96 losses.
| Stat | Rank |
|---|---|
| Runs | 72 (T-24th) |
| OBP | .287 (29th) |
| SLG | .377 (26th) |
| Strikeouts | 172 (4th Most) |
| GB% | 49.5% (2nd Highest) |
What people may not have realized is that Machado torched up hitting at the start of games last season. Manny slashed .312/.377/.582–that .582 slugging was the sixth highest in baseball (minimum 100 plate appearances). He hit as many home runs (10) in the first inning as the entire Miami Marlins roster did. The only other inning in which he had a higher OPS than in the first was in the seventh, where he had a crazy 1.487 OPS, albeit was in just 63 plate appearances, compared to his 159 in the first.
This basically boils down to him hitting in the third spot in the Padres lineup. Whether San Diego elects to hit him third or put him in the cleanup spot, it will be a lot better than last year. In 2018, the Padres’ three and four hitters combined for a .734 OPS (27th in MLB) and collected 150 RBI (29th). They also struck out an NL-leading 351 times. Machado’s strikeout rate of 16 percent over that time is below league average.
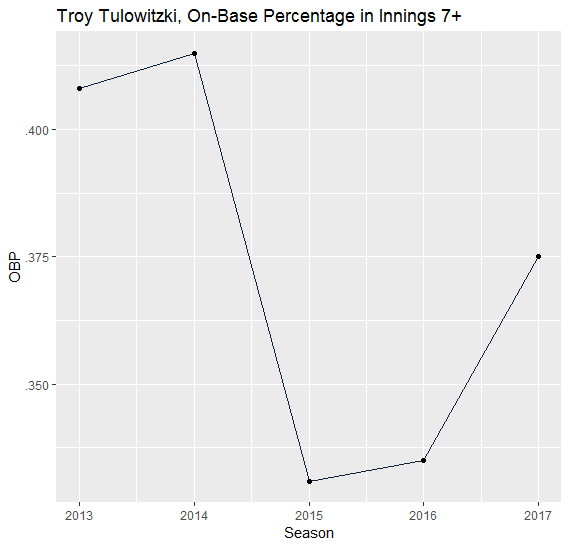
Troy Tulowitzki: Hitting Late In The Game
Troy Tulowitzki may be one of the most intriguing hitters in baseball. Will he go back to hitting like he did in Colorado? Probably not (insert Coors excuse here). Will he be better than he was in Toronto? I sure hope so.
Tulo, who posted a .970 OPS in spring training, had some interesting splits when he last played.
| Inning | Slash Line |
|---|---|
| Innings 1-6 | .213/.262/.356 |
| Innings 7 and later | .321/.375/.420 |
It is still early, but Tulo has already hit in the later innings this season, including this home run.
His two hits this season have come in the eighth and ninth innings.
Tulo goes from one of the worst hitters in MLB in the first six innings to at least a solid contact hitter later in the game. Yes, a .420 slugging percentage is still not great, but that OBP shows he could at least get on base late in games.
Were the Yankees bad at getting on base after the sixth inning last season? Not really, no. Overall, the team got on base at a .327 clip in the seventh inning and later, which was good for 10th best in baseball. The biggest concern appeared to come in the postseason. In the Wild Card game and in the ALDS, the Yankees slashed .170/.310/.362 after the sixth inning. Luke Voit, Giancarlo Stanton, Gleyber Torres, and Gary Sanchez combined to go 3-for-23 (.130) from the seventh inning onward last postseason. Not great, Bob.
Honestly, it’s unclear what Tulowitzki can bring to the table. He officially hit the injured list on Thursday; his exact timeline for return is unclear. He did not play a single game in 2018, and he posted a measly .678 OPS and .303 wOBA in 2017. That is why I think he is such an interesting addition. There must have been some numbers in the Yankees’ data that showed he would be a useful offensive addition for a team that hit the most home runs in a season in major league history. But even if he does not start, the Yankees could use him off the bench later in games. As he showed in 2017, he might be a more viable option late in the games than at the start.
Daniel Murphy: Two-Strike Hitting
Colorado’s ability to hit with two strikes has declined over the years. However, this issue is more concerning for all 30 teams, not just the Rockies. Since we started tracking pitch-by-pitch statistics in 1988, the league’s batting average is at a historic low with two strikes.
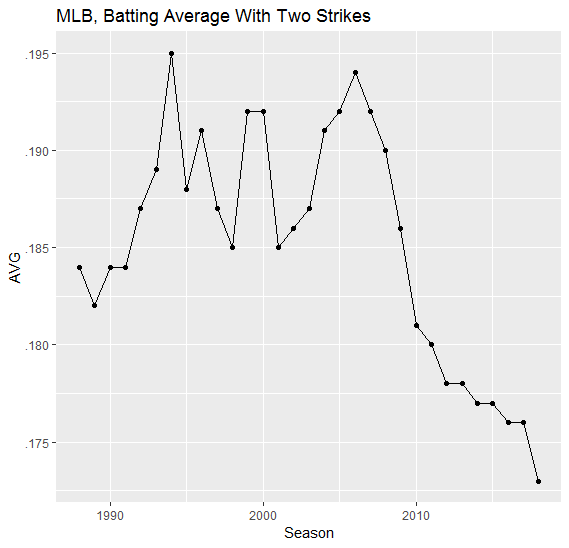
One explanation for this fact is that more pitchers are using breaking pitches to wipe out batters. Batters striking out more often is a clear trend, not only in 2018 but over the past few seasons, but what is more important is that pitchers appear to be tailoring their approaches to achieve more strikeouts. Hence, we see more breaking pitches being used later on in the count.
This brings us Daniel Murphy. Unfortunately, we may have to wait a month before seeing how he will do, as a fractured finger has put him on the 10-Day injured list. At one point in his career, it looked like he could hit any two-strike pitch that was given to him. His numbers back him up last season, not just in 2016.
| Year | BA (Rank) |
|---|---|
| 2016 | .280 (2nd) |
| 2017 | .227 (38th) |
| 2018 | .264 (6th) |
Obviously, the Rockies’ offensive numbers, no matter the count, will be altered by Coors Field, but their on-base percentage with two strikes was still below league average last season. What’s even more intriguing is the fact that they got on base with two strikes at a much greater rate in 2016 after struggling in 2015 but took a step back in 2017 and 2018.
| Year | (OBP) Rank |
|---|---|
| 2015 | .227 (29th) |
| 2016 | .261 (4th) |
| 2017 | .249 (16th) |
| 2018 | .241 (22nd) |
How does a team struggle in any offensive category in Coors? Great question! Perhaps one way to explain this is through LeMahieu: His on-base percentage with two strikes from 2015 through 2018 was .278, .366, .317, and .249, respectively. Perhaps the fact that LeMahieu took a step backward with two strikes in 2018 can help explain why Colorado did not extend him. With LeMahieu out, Murphy now steps in. Can the Rockies get the same two-strike production from him as they did with LeMahieu two seasons ago?
Alex Wood: Nobody on Base
Alex Wood has started at Great American Ballpark three times. The first two outings were great, as he combined to go 13.2 innings, allowing two runs and eight hits. In his most recent start in Cincinnati, he did not get out of the fourth inning, allowing seven runs and eight hits. His work in the Reds’ ballpark is pretty inconclusive. But his ERA and FIP have been under 4.00 for three straight years, which can bring down the team’s numbers in both metrics.
Cincinnati’s starting rotation has been, well, bad. In each of the last two seasons, the starting ERA has been over 5.00, and playing in such a hitter’s park does not help. The Reds’ 4.74 FIP at home was the third worst in MLB and way behind any other NL park (the Nationals were second at 4.25). One of the big factors was that they allowed too much damage with nobody on base. Hey, at least that’s better than allowing damage with runners on, right? True, but now that the Reds are trying to field a competitive team in the NL Central, it is even more important to limit opponents’ scoring.
The Reds’ opponent OPS last season was .755, which was actually better than in 2017 (.768), but it still ranked 26th in the majors. They allowed 135 solo homers, second most in baseball, behind another team in a hitter-friendly ballpark, the Rangers (137). What’s important to notice is they walked only 257 batters without runners on, a huge improvement after allowing a free pass to 348 batters with nobody on in 2017. There have been improvements, but not enough to become a competitive team.
Wood can help with this. He allowed a .617 OPS with no runners on in 2018 compared to .730 with at least one runner on, while also improving in that category after allowing a .684 OPS with no baserunners in 2017. For a reference, the MLB average with no runners on was .710 in 2018, so Wood’s opponent OPS was almost 100 points lower than average. Of the 366 batters he faced with nobody on, he struck out 81 and walked 21. Not bad at all.
Adding Yasiel Puig and Matt Kemp from the Dodgers may get more attention (or at least cost more in salary), but the addition of Wood, Sonny Gray, and Tanner Roark makes this a completely revamped pitching staff. Wood, who is currently dealing with back stiffness, could return as early as the end of the month to add yet another piece in what is an interesting Reds’ starting rotation.
Jeurys Familia: Success versus the NL East
Ahh, a good ol’ reunion. One reason why the Mets re-signed Jeurys Famlia could simply be that they are…FAMILIAr…with him. But that pun didn’t not stop me from researching his numbers.
The Mets were actually decent against their own division last season–a combined 3.89 ERA was their lowest against any other division last season, and their 3.86 FIP was just slightly behind their FIP against the NL Central (3.78). But it was mostly the starters that had their success against the East, not the relievers. From April through July last season, Jacob deGrom went 1-2 against his own division…in 11 starts! In those starts, his team scored an average of 3.53 runs. A lack of run support clearly was evident for the Mets, but bullpen struggles can be to blame as well.
| ERS | Opponent OPS | K/BB | |
|---|---|---|---|
| Starters | 3.28 | .661 | 3.4 |
| Relievers | 4.92 | .769 | 2.3 |
Yes, the bullpen allowing 18 runs to the Nationals added many of those runs, but if we take out that game, the bullpen’s ERA is still far above the starters’. But when Familia was on the team (he was traded on July 21), the Mets’ bullpen against the NL East posted a 4.40 ERA. That’s not great, but it’s still a lot better than the 5.56 ERA against the NL East after that!
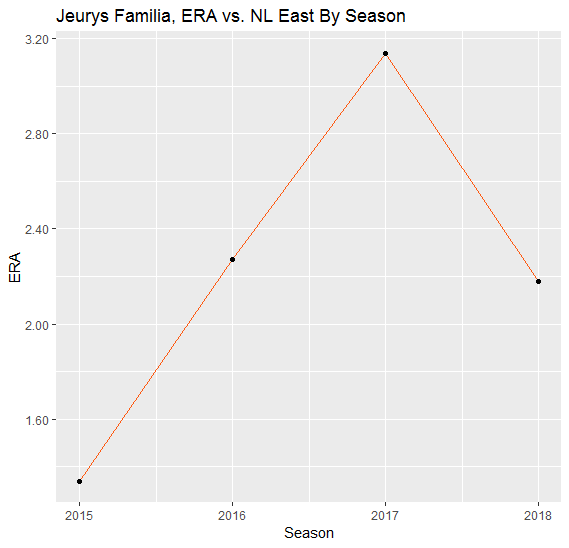
Sure, it was in a half-season sample, but Familia’s 2.18 ERA last season against the NL East was his lowest since his tremendous 2015. Of all the pitchers who have thrown at least 100 innings against the NL East since 2015, Familia’s 2.03 ERA is the lowest!
Edwin Diaz was a significant addition to this bullpen, no doubt. But he has only appeared in eight career games against the NL East. Bringing back Familia isn’t just a move to bring back a familiar face; the Mets need someone late in games to handle their dynamic home division. Bringing in Familia’s experience could be that answer. At the very least, he has to be better than the Mets’ options last season.
Evan Boyd is a research analyst at STATS LLC. You can follow his baseball and college basketball analysis at @EvanBoydSTATS. Any views and opinions expressed are his own.
Elephant in the room: how repeatable do you figure each of these splits are, on a scale of “platoon splits” to ” batting average on Tuesdays”?