Does Mixing Speeds of a Single Pitch Help Pitchers?

An article by Evan Longoria has us wondering how effective changing speeds on one pitch is.
(via Arturo Pardavila III)
If you haven’t read The Players’ Tribune, the athlete-point-of-view magazine started by Derek Jeter after his retirement, you’re missing out. The site has hosted such notable stories as Gary Sheffield as acting commissioner, Jorge Posada talking to his younger self, and Matt Shoemaker describing getting hitting in the head with a fastball.
One theme the site likes to run with is “five toughest,” as in Christian Yelich discussing the five toughest pitchers to face in the NL East. In late June, Evan Longoria chimed in with his own list: The five toughest pitchers he faces in the AL East. Number one? None other than Chris Sale, who is thriving in his new Boston home after an offseason trade from the Chicago White Sox.
In the article, Longoria opines as to why Sale is so tough to face:
[H]e’s really unpredictable. He has the ability to mix his pitches and throw them all for strikes, but he also mixes velocities within those pitches, which is something that you don’t see a lot of guys do with very much success.
Every now and then you’ll see a guy who can throw a slider from 82 to 88 mph, or who has an 87-mph change-up that he can drop down to 82 mph when he wants to bury it. Sale has the ability to vary speed like that with all of his pitches — especially his fastball, which he can throw anywhere from 89 to 99 mph.
Longoria then describes a plate appearance against Sale that featured a variety of same-pitch speeds and resulted in Longoria striking out. I read this section and I wondered: How important is varying the release speed of individual pitches? Do pitchers who vary these speeds have more success than others? Longoria implies that this skill is part of what makes Chris Sale successful.
To find out, I looked at starting pitchers from 2015 through this year who’d thrown at least 300 of a distinct pitch. I then computed the median absolute deviation (MAD) within each pitch type. A higher MAD indicates more variety in speeds for a single pitch.
First: is Sale truly is the master speed-mixer Longoria makes him out to be?
| Season | Pitch Type | MAD Release Speed (MPH) | MLB Rank* |
|---|---|---|---|
| 2015 | CH | 2.1 | 100.0 |
| 2015 | FT | 2.1 | 97.6 |
| 2015 | SL | 2.5 | 94.2 |
| 2016 | CH | 2.2 | 96.6 |
| 2016 | FT | 2.2 | 100.0 |
| 2016 | SL | 2.4 | 92.6 |
| 2017 | CH | 1.6 | 94.4 |
| 2017 | FF | 2.1 | 99.1 |
| 2017 | FT | 2.7 | 100.0 |
| 2017 | SL | 2.2 | 97.8 |
Longoria’s correct. Since 2015 Sale’s varied his pitch speeds more than most other starters. What does this mean for Sale’s effectiveness? I looked at all starting pitchers and compared their pitches’ MAD to their normalized K-BB% (K-BB+) for that year to see if mixing pitch speeds relates to on-field dominance.
The findings are not encouraging:
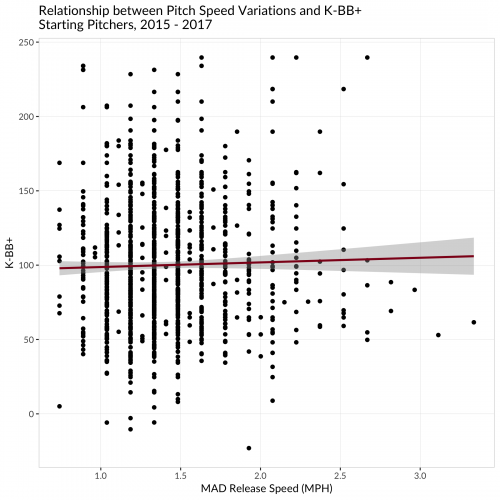
Each x-axis mark represents a single pitch type, pitcher, and season. To Longoria’s credit, we do see a positive relationship. Pitchers who vary the speeds of distinct pitches do enjoy a slight advantage in K-BB%. But the emphasis is on “slight”: r is 0.0007, barely worth mentioning.
The graph above is a bit messy though. Sale has four primary pitches in 2017 and thus four points on the x-axis, but he has only one K-BB+ rate and so only one point on the y-axis. You can glean only so much by examining individual pitch types, because a pitcher’s success is based on his entire arsenal, but we can at least dig in a bit and see if varying the speed of any one pitch is more effective than another.
To do this I graphed each pitch type separately:
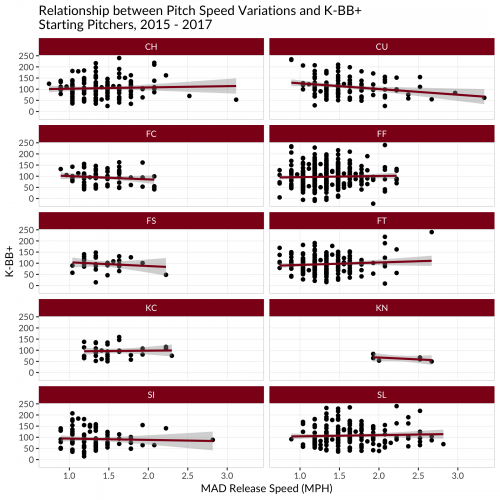
That’s a bit more informative, but not by much. The relationships appear weak in all cases, and when they do exist, they’re negative for most pitches. The handful of positive relationships (change-up, two-seam fastball, slider) aren’t that strong.
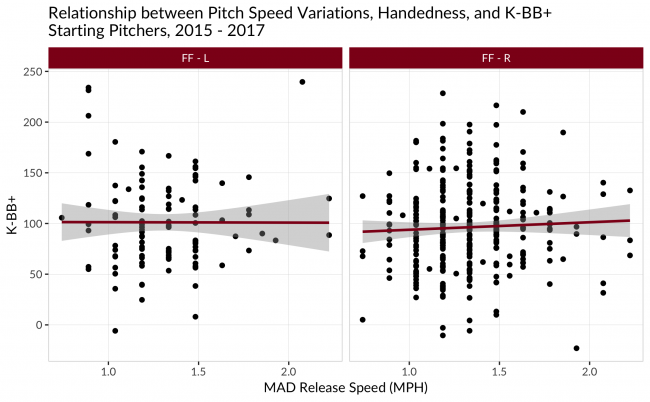
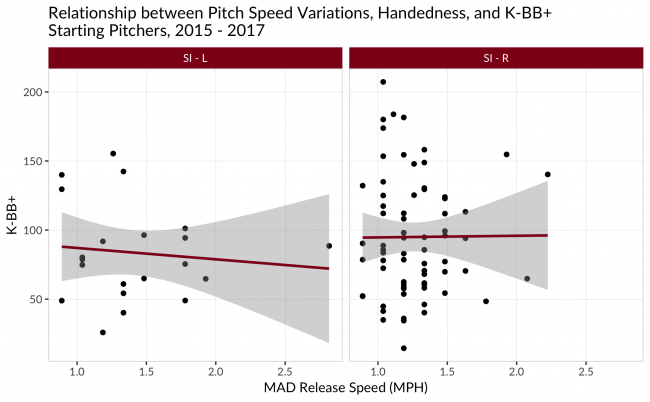
Let’s explore another dimension: pitcher handedness. Maybe Sale’s sinister nature differs somehow from his right-handed counterparts?
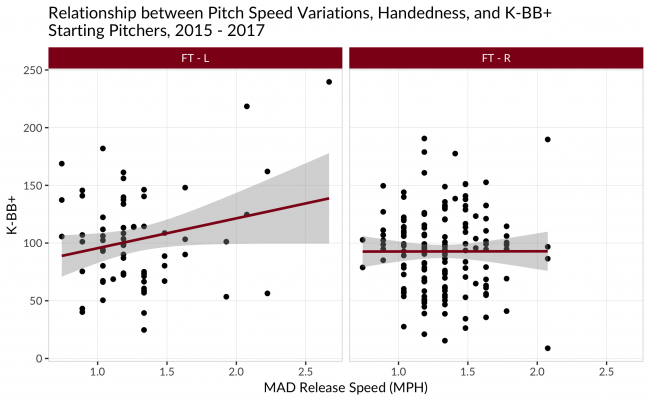
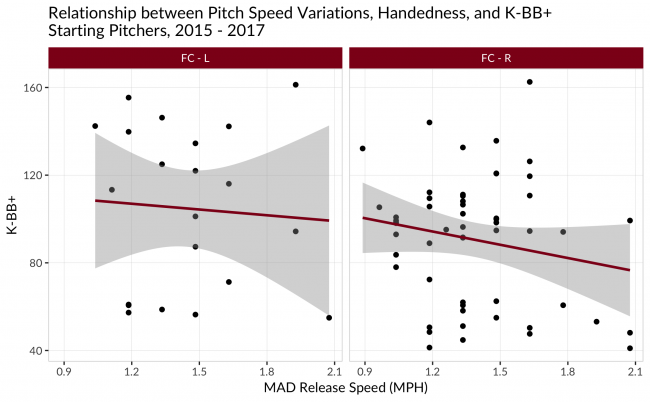
Here are the relationships for fastballs:
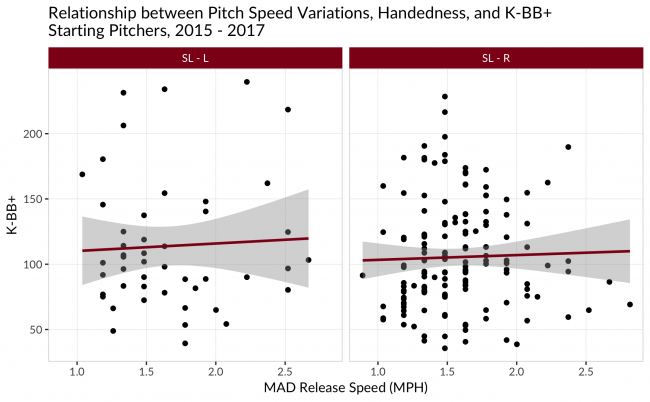
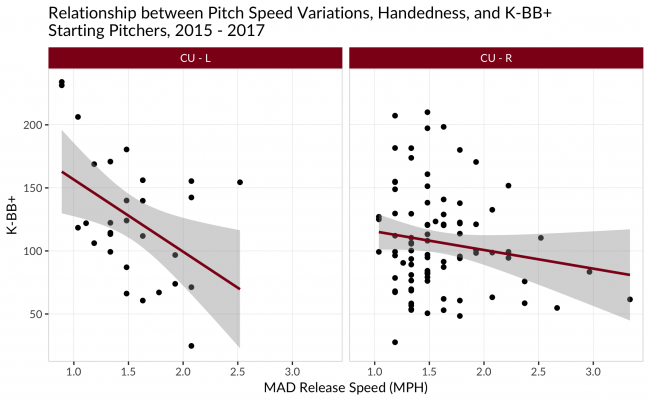
Breaking pitches:
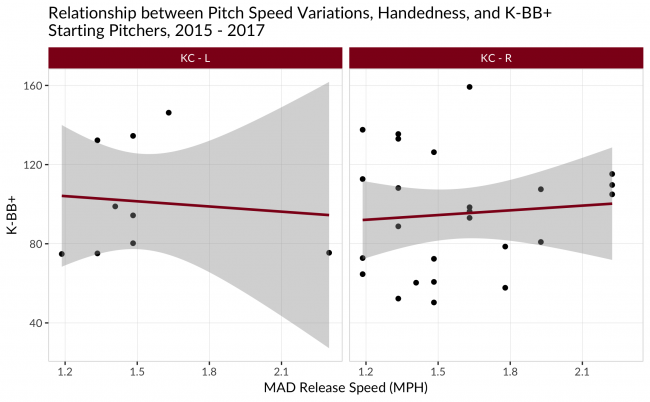
And offspeed:

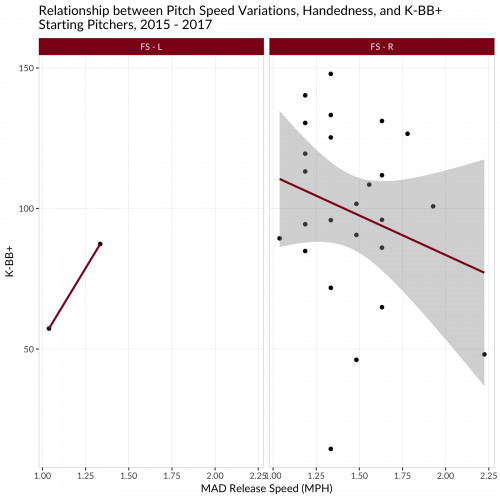
The following table summarizes these relationships:
| Pitch Type | r (LHP) | r (RHP) | Difference |
|---|---|---|---|
| FF | 0.003 | 0.047 | 0.044 |
| FT | 0.023 | 0.001 | -0.022 |
| SI | -0.107 | 0.007 | 0.114 |
| FC | -0.067 | -0.192 | -0.125 |
| SL | 0.049 | 0.031 | -0.018 |
| CU | -0.457 | -0.155 | 0.302 |
| KC | -0.009 | 0.087 | 0.096 |
| CH | 0.282 | -0.063 | -0.345 |
| FS | – | -0.239 | – |
We see a few distinctions when throwing the same pitch from different sides of the rubber:
- Varying pitch speeds isn’t always good for the pitcher. I can think of a few reasons why:
- Perhaps hitters can pick up slower/faster pitches of certain types, like curveballs, more easily. Note the sharp drop in K-BB rate for southpaws who vary the speeds of their curveballs. Perhaps the slower the curve, the easier it is to pick up and guess where it will cross the zone.
- Conversely, perhaps pitchers have trouble controlling a pitch at a wide variety of speeds. Maybe a slower curveball is more likely to not only be out of the zone, but also taken for a ball.
- Perhaps some umpires have trouble perceiving mixed pitch speeds and seeing whether they crossed the zone and so might call the pitch a ball if they didn’t really see it.
- Perhaps some catchers have trouble handling mixed pitch speeds and framing them for strikes.
- Southpaws differ noticeably from their right-handed brethren when it comes to curveballs and change-ups. Sinkers and cutters also behave differently for each kind of pitcher.
- Varying the speeds of sinkers and knuckle-curves seems to be bad for lefties but good for righties. Conversely, varying the speed of a change-up is bad for righties but good for lefties. Varying the speeds of four pitch types benefits lefties, whereas righties benefit from varying the speeds of five pitch types.
Here’s the nail in the coffin. The following graph shows that except for curveballs and knuckle-curves, pitchers with above-average K-BB rates (a rating of 5, colored dark red) vary distinct pitch speeds roughly the same as pitchers with below-average K-BB rates (a rating of 1, colored light pink):
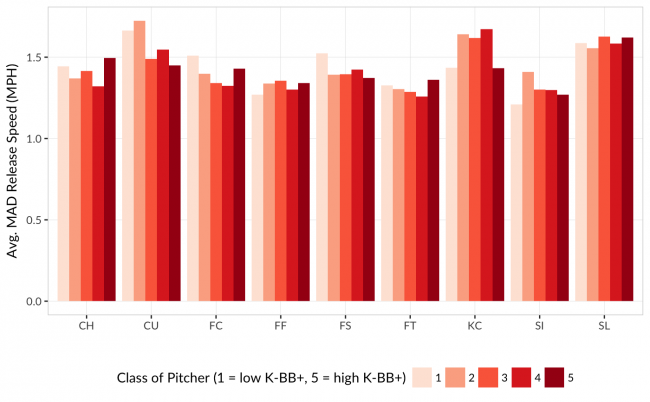
Except for the curveball varieties, the differences (when present) are minor.
Longoria’s right about Sale being one of the best in the game at mixing speeds of individual pitch types. And Sale is a lefty who features the four pitch types where varying speeds actually helps: four-seam, two-seam, slider, and change-up. But the evidence says that varying speeds of individual pitches has little to do with how successful you are as a pitcher.
While Sale himself may understand how to wield these weapons effectively, the wider population of starting pitchers, from elite to scrub, behave similarly to one another. Those with above-average K-BB rates, like Sale, vary individual pitch speeds about the same as those with awful K-BB rates (like Bronson Arroyo) do.
This doesn’t mean Longoria was wrong about that one particular plate appearance against Sale or about facing Sale in general. I’m sure Sale did indeed mix up his fastball speeds in that plate appearance, and we know Longoria did strike out. But I think Longoria’s K had more to do with him expecting a 92-93 mph fastball and getting one at 95. He implies as much when, earlier in the article, he remembers an earlier appearance against Sale:
Earlier this season when I faced him, he threw me a couple of 92–93 mph fastballs early in the count, and then he dialed up back-to-back sliders in the 78–80 mph range.
Reflecting on the 95 mph fastball that put him away, Longoria says:
If that pitch comes in at 92–93 mph, maybe I foul it off and stay alive.
To me, the fact that he mentions the 92-93 mph range twice implies he was expecting just such a fastball. And while Longoria is a top-shelf athlete with years of baseball experience at the major league level, an extra two mph of mustard on a fastball is sometimes all it takes to get a strikeout.
And this may be the true secret to pitching dominance: throw what hitters don’t expect and can’t react to quickly.
I would think that there are other advantages for pitchers to changing speeds of a pitch than just K/bb. One only has to look at the success of Bartolo Colon into his early 40s and pitching with just the fastball.
Great point, it’s exactly what I came to the comments to say. If you want to know if changing speeds within a pitch is somehow beneficial, increasing Ks and/or decreasing BBs is only one way it may help. It just as plausibly, perhaps more plausibly, would help by encouraging weaker contact.
The quality(or elite) pitchers can do things like mix speeds successfully, because they have the location or timing right of when they throw these pitches. Unpredictability can be an element of success. When Dwight Gooden looked like a future hall of fame pitcher, his curveball was absolutely devastating. The slower pitch was a huge problem for batters.
The converse of this topic would be the hitter who seems to have poor plate discipline, but is successful anyways. In his case, the unpredictability of where he swings is an asset. This type of hitter may not draw many walks, but is still productive.
You probably need to be clear that the “MLB RANK” column is a percentile value.
Another way of looking into the effectiveness of variation in speed might be taking the mean or median of each pitch type per pitcher and do we see the swing and miss rate increase as the MPH moves farther away from the mean/median. Could be a sign that they are effective in varying the speed.
Since starting pitchers generally lose velocity as the game progresses, wouldn’t this mean a different methodology is required. After all, there’s potentially a big difference between a pitcher offering a 97 mph, 97, mph 94 mph, 93 all in one at bat versus tossing a 97 mph in the 2nd and those others scattered across a game.
This is what I was going to say. I’d be interested in what would happen if we restricted this to just velo differences in, say, the first two innings.
Rather than K-BB, I’d look at indexed swinging strike rates. In other words, how does Sale’s velocity variation for a certain pitch correlate with its effectiveness (as defined by its swinging strike rate) relative to all others of that type? I’d guess that individual pitch effects/effectiveness would wash out in K-BB when aggregated.
I think your attempt to break this question down for analysis is self-defeating. Longoria notes that not many pitchers can vary more than one of their pitch types by speed, if that. In effect, a four-type pitcher has five pitches, if he can change speed on one of them reliably. In those terms, Sale has eight pitch types that he can throw reliably, any time in the count! This is also effectively two types of uncertainty for the batter, since the two speed versions of each type will look the same coming out of his hand. It’s like every pitch type is a “change up” of it’s own type. You not only have to guess “slider” but then pick up if it’s the fast one or the slower one. He’s simply made pitch sequencing geometrically more complex for the batter to parse.
Since Sale amplifies this advantage by working more quickly than any pitcher in the game, batters have very little time even to figure out what to expect. They barely even have time to guess, & the results show it. QED—no statistics required!
Well said. Sometimes the answer is obviously simple
Buddy, Thanks for sharing this nice information here. Glad to see this.