Exit Speed and Home Runs

Home runs totals across the majors are up so far in 2016. (via Erik Drost)
Back in March, prior to the start of the 2016 season, an article entitled “A Baseball Mystery: The Home Run Is Back, And No One Knows Why,” by Rob Arthur and Ben Lindbergh, noted that the number of home runs per batted ball during the 2015 season was significantly larger post-All Star Game than pre-All Star Game. They observed that the increase was accompanied by, and perhaps caused by, a small ~1 mph increase in the mean exit speed. The authors speculated about various reasons that might explain the increase.
Inspired by their article, I decided to do a bit of research on my own, comparing home runs and exit speeds for the months of June and August. I was particularly intrigued by how a small increase in exit speed could lead to a relatively larger 13 percent increase in home runs. I wrote a brief article, Home Runs and Exit Speed, and posted it on my website, explaining how this can happen without speculating on why there was an increase in exit speed.
Since then, the topic has remained of great interest. Home runs are always front and center, and have been so this season more than in most. Commissioner Rob Manfred even addressed the increase in home runs at his annual press briefing during All-Star week. So I decided to roll up the sleeves again and dig into some additional analysis, using the publicly available Statcast data for the 2015 and 2016 season, courtesy of Baseball Savant.
Specifically, I set out to compare 2015 pre-All-Star Game to 2016 pre-All-Star Game data, with no consideration of the 2015 post-All-Star data. Only three parameters were considered: exit speed v, vertical launch angle θ, and outcome (i.e., home run or not). In particular, I wanted to determine the extent to which changes in home run production can be attributed to changes in the distributions of v and θ.
First, let’s look at the raw numbers below. The last column shows the number of home runs per batted ball, normalized to be 1 for 2015. We see a whopping increase in 2016 of 24.3 percent.
| Year (Pre-ASG) | Batted Balls | Home Runs | Relative Home Runs |
| 2015 | 61873 | 2439 | 1 |
| 2016 | 61707 | 3023 | 1.243 |
So we see a huge increase in 2016, and we will now have to drill down in our attempt to pinpoint the reason for the increase. It is by now well known that the “sweet zone” for hitting a home run is for the exit speed to be high and for the launch angle to be in the range 250-300. So my next step was to investigate batted balls in that sweet zone. This next table examines balls hit in the θ range 250-300 with v>95 mph, while the one immediately following it examines balls hit in the same θ range with no restriction on v. Both tables, taken together, suggest that the primary reason for the home run increase in 2016 is more hard-hit balls as opposed to more balls hit in the sweet launch angular zone. Let me explain.
| Year (Pre-ASG) | Batted Balls | Relative Batted Balls | Home Runs | Relative Home Runs |
| 2015 | 1564 | 1 | 808 | 1 |
| 2016 | 1988 | 1.271 | 1031 | 1.004 |
| Year (Pre-ASG) | Batted Balls | Relative Batted Balls | Home Runs | Relative Home Runs |
| 2015 | 4043 | 1 | 840 | 1 |
| 2016 | 4345 | 1.075 | 1069 | 1.184 |
In the first of the two tables, we see that despite there being 27.1 percent more balls hit in the combined sweet zone in 2016, the relative number of home runs—home runs per batted ball in that zone—is identical. That seems to rule out differences due to atmospheric effects, since the probability of a ball in the sweet zone ending up as a home run is the same in both years.
In the second of the two tables, we see 27.3 percent more home runs in the angular sweet zone in 2016 (1069) than in 2015 (840). Part of the increase can be accounted for by the 7.5 percent increase in the number of balls hit in the angular sweet zone in 2016. But most of the increase comes from the higher probability that a ball hit in the angular sweet zone will result in a home run. As given in the last column, there was 18.4 percent increase in the probability that a ball hit with θ=250-300 results in a home run. Given the narrow angular range and the fact that we have ruled out atmospheric effects, that leaves exit speed as the explanation.
I repeated this analysis for other definitions of sweet zone, an example of which is shown in the next two tables. The numbers come out just a little different but the qualitative result remains: The overwhelming factor leading to the increase in home runs comes from more hard-hit balls rather than from more balls hit in the desired angular range or a change in atmospheric effects.
| Year (Pre-ASG) | Batted Balls | Relative Batted Balls | Home Runs | Relative Home Runs |
| 2015 | 3746 | 1 | 1862 | 1 |
| 2016 | 4796 | 1.28 | 2403 | 1.008 |
| Year (Pre-ASG) | Batted Balls | Relative Batted Balls | Home Runs | Relative Home Runs |
| 2015 | 12033 | 1 | 2043 | 1 |
| 2016 | 12556 | 1.043 | 2598 | 1.219 |
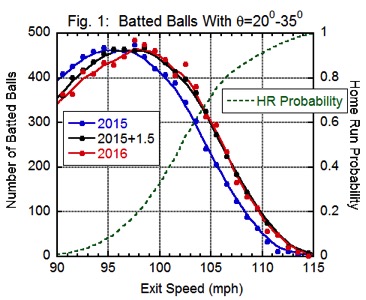
To investigate this further, I will follow the analysis from my previous article, using the angular range θ=250-300. The relevant information is presented in Figs. 1 and 2. Fig. 1 shows the distribution of exit speeds falling into the angular range, normalized to the same total number of batted balls in that range in order to facilitate comparison of the two distributions. Shown are the actual data as well as a smooth curve through the data. Also shown is the probability density as a function of exit speed that a ball hit in that angular range will be a home run, taken directly from the data but smoothed. The slight shift to higher speeds of the 2016 data is very evident for speeds exceeding 100 mph. Also shown is the 2015 data shifted upward by 1.5 mph, which overlaps almost perfectly with the 2016 curve for v>100 mph. The probability curve shows that it is precisely balls hit over 100 mph that are most likely to result in home runs.

This is further apparent by the curves in Fig. 2, which were obtained by multiplying the exit speed distributions by the home run probability for each 1 mph bucket of exit speed. The resulting curves are the probability density as a function of exit speed for balls hit for a home run. The area under each curve is the expected number of home runs, labeled “Calculated Home Runs” in Table 6. While the calculation falls short of the data by about 5 percent, the excess in 2016 is evident, both in the data and in the plot. Also shown in the figure and table are the results of shifting the 2015 data by +1.5 mph, producing a curve that overlaps essentially perfectly with the 2016 curve and results in the approximately the same number of home runs.
| Year (Pre-ASG) | Actual Home Runs (normalized) | Calculated Home Runs (normalized) |
| 2015 | 2043 | 1940 |
| 2015-shifted 1.5 mph | 2437 | |
| 2016 | 2490 | 2419 |
Let’s review what we have done. By simply looking at the numbers in the second through fifth tables, we learn that the principal factor accounting for the large increase in home runs in 2016 is likely due to exit speed. Figure 1 shows that there is indeed a change in the exit speed distribution for 2016, which is shifted to higher values relative to 2015 by about 1.5 mph. Figure 2 and Table 6 show that if the 2015 data are artificially shifted upward by 1.5 mph, the resulting home run probability for balls hit in the angular sweet zone is essentially identical to that of 2016.
Aside from this important conclusion, it is very interesting that a small 1.5 mph change in exit speed leads to a large change in home run probability, 21.9 percent from Table 5. The essential point is that the exit speed distribution falls off rapidly just in the region where the home run probability is rapidly rising. As a result, a tiny change in exit speed can lead to much larger changes in the number of home runs. A similar conclusion was reached in an analysis I did a few years ago about the possible effect of steroids on home run production.
Now comes the part that has been the topic of much speculation: Is the increase in home runs an indication that the baseball is “juiced”? Arthur and Lindbergh speculated about that in their 538 article, even going so far as to employ the Sport Sciences Laboratory at Washington State to measure the so-called Coefficient of Restitution (COR) of some baseballs. At impact speeds of about 100 mph, the COR of a major league baseball is about 0.450. In their limited sample of a dozen baseballs each from 2014 and from the 2015 postseason, they found the latter sample had a COR about 0.003 higher, which is barely at the level of statistical significance.
For those of you who like to play around with numbers, the change in exit speed is about equal to 0.8 times the change in COR times the total impact speed. The 0.8 factor is a number that is bat-dependent but is expected to be typical for major league batters. The impact speed is the sum of pitch and swing speeds. For a pitch moving at 85 mph as it crosses home plate, a bat speed of about 77 mph is needed to obtain an exit speed of 103 mph, which is about the mean value for home runs. So the impact speed is 85+77=162 mph. So to obtain a change in exit speed by 1.5 mph would require a change of COR of 0.012. Such a change would easily be observed in laboratory measurements. The preceding numerical exercise should only be considered as “intelligent estimates,” not hard cold facts. Nevertheless, they are useful when considering the juiced ball issue.
Finally, I would like to remark that a more granular analysis could be done, looking at other factors leading to an increase in home runs (and exit speeds), such as batter, pitcher, ballpark, etc. It was not my goal to do such an analysis here.
In summary, there is a significant increase in pre-All-Star Game home runs in 2016 relative to 2015. The dominant factor leading to the increase is the increase in exit speed in 2016 for balls hit in the angular range most relevant for home runs.
Editor’s Note: This addendum was added at ~4 pm ET on July 18, 2016. The References & Resources section remains the same as originally published.
Addendum
Usually when I complete an analysis and write an article, I put it to bed and move on to something else. However, I can’t seem to shake loose of this one, especially given the high current interest in the topic. There are lots of readers out there who would like to attribute the increase in home runs to a “juiced baseball,” especially since it seems to be highly correlated with an increase in exit speed. So I decided to take one more look at the data this morning and prepared the plot shown below.
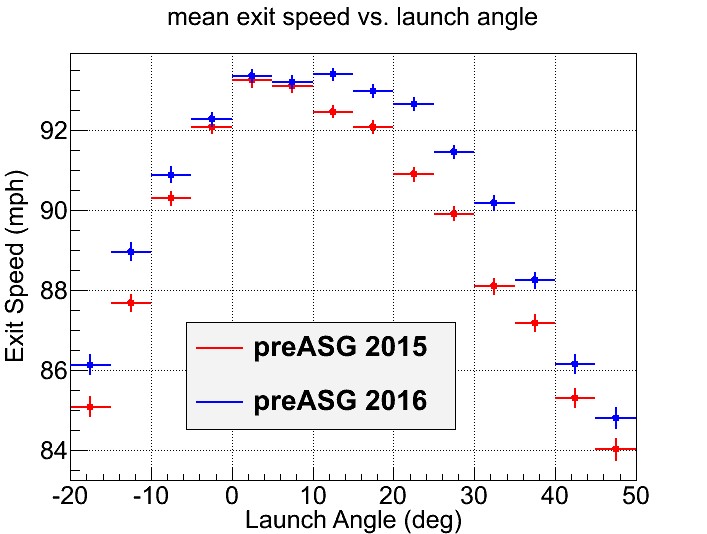
I divided up the launch angle into 50 buckets, then found the mean exit speed for each of those buckets, for both 2015 and 2016, pre ASG. And I have to admit that I am very puzzled by this plot. While there is a clear increase in mean exit speed for launch angles in the home run sweet spot, 200-350, the mean exit speeds are essentially identical for line-drive type angles, 00 to 100. This is not what I would expect to find if the ball were indeed juiced. If anything, I would expect the coefficient of restitution to have a greater effect on the line drives, which are generally more “squared up” than fly balls, as one can see from the higher average exit speed. This does not bode well for the juiced ball theory.
My conclusion that the higher exit speeds account for most of the increase in home runs still stands. However, as much as I hate to admit it, the exit speed versus launch angle plot really puzzles me. Sometimes it happens that the answers are not as clean and crisp as we would like; this seems to be one of those times. Looks like I’ll be spending more time on this one.
References & Resources
- Baseball Savant
- Rob Arthur & Ben Lindbergh, FiveThirtyEight, “A Baseball Mystery: The Home Run Is Back, And No One Knows Why”
- Alan Nathan, The Physics of Baseball, “Exit Speed and Home Runs”
- Rob Arthur, FiveThirtyEight, “The New Science Of Hitting”
- Alan Nathan, The Physics of Baseball, “The Possible Effect of Steroids on Home-Run Production”
Great read!
I have seen the theory thrown around that players which produce higher exit velocities are being selected for and that swinging harder is being emphasized in MLB orgs.
I’d be curious to see a comparison of average exit velocities for players with a threshold # BIP in both early 2015 and early 2016 to see if the average exit velocity of that cohort has gone up.
If it does that would point toward more external factors. If it does not perhaps we are just seeing the nature of the population shift with an influx of higher than average exit velocity bats while some slap hitters have been weeded out?
I hate to bring up conspiracy theories but I don’t see another Explanation than the ball. of course it could be that the scouting now emphazises power more and last year there actually was a big class of powerfull rookies but such a Change would be expected to be more gradual and especially not Happening mid season.
on the other Hand somebody should have noticed it and talked about it if the ball was hotter, I doubt they get the whole league to remain silent and cover it up. very strange.
Scott, I agree that Teams Scout more for Exit Velo (and tolerate more Ks as a tradeoff), all the Showcases now do include Exit Speed off a Tee but that still doesn’t explain the large jump within the 2015 season. in the first half the power Level was basically like it was before and then it exploded.
If it was an effect of scouting I would expect a 3-4 year curve showing that trend since not all slap hitters are weeded out in half a season.
Great perspective as usual Alan.
My theory re: improved exit velocity is as follows. Cracking down on steroids took the primary methodology for athletes to boost performance outside of regular training. This led to a lull where it took a while for alternatives to crop up. Given that the market forces behind increasing power are tremendous (HUGE incentives for power hitters) there is a tremendous secondary market of individuals searching, researching and developing the next wave of performance enhancers (hopefully benign and legal). We are likely seeing the beginning of this wave and would indicate it will be sustained.
Or it’s just random ebbs and flows.
Superb read.
Imagine that it’s about the ball. But there’s a trade-off.
It looks like speed acts together with spin here. Linedrives have little spin, and we see that ball speed do not benefit from frontal impact. Is it possible to make a ball COR dependable on angle of attack? I think it is since ball is not solid.
Another way to look at it is to decrease duration of collision. I think it is possible to make a ball which is firmer (more resistant) to tangential hits, and therefore will lose less energy during collision.
Assuming that this is possible, do we have an easy way to statistically or experimentally check this reasoning?
mcuni: Let me respond to what I think you are asking. The exit speed has two components: The “normal” and “transverse” parts, which are discussed in another article I wrote last year: http://www.hardballtimes.com/optimizing-the-swing/. The normal part has to do with the head-on part of the collision. It is generally the larger of the two and depends on the COR of the ball. The transverse part has to do with the frictional force that the bat exerts on the ball as it slides on the surface, which happens for oblique collisions. I think what you are asking is whether the exit speed depends on how oblique the collision is. The answer is, yes. However, for collisions that are not “too oblique” (i.e., for those resulting in a hard-hit ball at horizontal and vertical angles not too extreme), the effect is not too large. For me, the next step in investigating this subject is to try to quantify the “not too large”.
i’m still confused as to how/why you can rule out atmospherics as a potential reason. i (think) i get your point that the relative HR rates when you look at balls hit hard and in the sweet spot vs just balls hit in the sweet spot suggests that exit velocity is the key… but wouldn’t atmospherics (hotter/dryer air) effect exist velocity (less drag/resistance). or is that a non-factor because exist velocity is measured at the time of impact with the bat?
also, would atmopsherics affect pitched ball velocity enough to increase exit velocity (i.e. the ball reaches the bat with more velocity because it loses less after leaving the pitchers hand…)?
p.s. i’m a lawyer; i hope my understanding (or lack thereof) of physics, baseball, and math doesn’t embarrass those of my profession.
Nate: The exit speed is measured at or close to impact, so it is not directly affected by atmospheric conditions. While the latter do affect the pitch speed (at impact), the resulting effect on exit speed is insgnificant. Of course, the atmosphere does affect the carry of a fly ball after it leaves the bat. I presented an argument that this is not the primary reason for the increase in home runs.
thank you professor.
The weather could affect the CoR of the ball though…
Maybe dumb question, but any chance they changed the aerodynamics of the ball, either via the laces or ball surface itself? Could that explain a change in apparent velo without changing the COR?
Ryan: The laces (and other surface effects) can affect the carry of a fly ball but not the COR. A change in laces would therefore not account for the increase in exit speed.
Is it possible that some of the difference between 2015 and 2016 in the graph in the addendum could be from an aggregate change in hitters’ approach?
If hitters are choosing to lay off on the GB-producing pitches at the bottom of the zone and setting up to hit pitches say 3 to 6 inches higher, that should increase the average attack angle on balls they square up. That would mean that balls squared up with a 93mph exit speed at a 5 degree launch angle would be replaced by balls squared up at 93mph and, say, a 15 degree launch angle.
tz: You raise an interesting point that is worth looking into further. There is some evidence for larger launch angles (for >95 mph exit speed) in 2016 but only by about 1.5 degrees. As a result, there are more balls hit in the angular range that results in HR. But as the data in my tables show, that effect is probably small compared to the higher exit speeds. But lots of people (including me) are still working on this and I suspect there is more to be discovered.
Does your second table not simply that in 2016 a higher proportion of flyballs went for HRs in the VLA 25-30 & V<95 MPH range?
Why are these softer fly balls leaving more frequently? Are there a whole bunch of 90-94 mph sweet angle shots that are wall scraping? Or maybe these balls are more frequently being hit down the line for a HR instead of to CF for a double or fly out?
I think the 2nd table shows that the fraction of balls hit 25-35 deg and >95 mph that result in HR is the same for 2015 and 2016 (column 5). There were more HR in that range in 2016 because there were more batted balls in that range.
Why is the CoR of the ball treated like the only factor in ball performance? Research I’ve looked at + my own relatively extensive softball experience points to compression (ie “ball hardness”) is more of a factor.
http://www.bomani.com/BSRI2010/BSRI_2010_Members/softball_articles/BSRI-17_PQI_COR_BBS.html
Hardness is only a factor for hollow non-wood bats, which is what bomani is talking about. A harder ball results in a greater trampoline effect from non-wood bats. But the ball hardness has no relevance for solid wood bats.
Maybe it’s just an anomaly?
Otherwise, how do you explain the jump of 600 HRs in 96 and 87? Was the ball juiced that year?
Here is what happened 86-88, total HRs/year
3813 4458 3180
95-97
4081 4962 4640
It aids not exclusive in enhancing the form perceptibility direct but also straight impacts the call memory measure.
Maybe then we may get some true answers as to who Sara really is.
When you delapidate a movie T-shirt, you are basically informative separate fill what typewrite of
movies you like and what types of movies you often timepiece.
As part of its Summer 2017 lineup, the adidas Ultra Boost 3.0 will be available in a new Triple Grey theme that will follow the bronze boost and trace khaki versions.