Fastball, slider, change-up, curveball—an analysis
Fastball, slider, curveball, change-up—these are the tools of the
pitcher’s trade. The weapons he takes with him to the thousand
yearly battles with opposing hitters. Much of my
recent work has been devoted to trying to understand the different
characteristics of these pitches: how they move, how fast they are
thrown, who throws them, and so on. In this article, I want to explore
how these different pitches are used, which situations call for
which pitch, and which pitches get the desired results most often.
The first hurdle to overcome for a study like this is classifying a
large number of pitches. The pitch data that I work with, provided by
the Pitch f/x system, does not identify the pitch. However, there is
enough information on pitch speed and movement to enable us to do a pretty
good job of classifying pitches. Thus far, I’ve managed to classify
around 90% of the 310,000 pitches recorded by Pitch f/x in 2007. See
the Resources section below for details on pitch
classification.
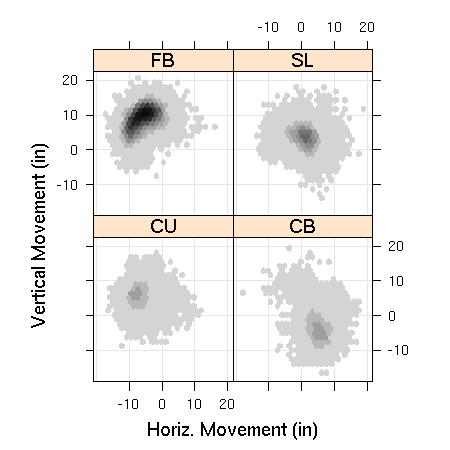
Let’s remind ourselves of the basics of these pitches. The
graphic on the right shows the horizontal and vertical movement for
the four pitch types. By the way, here is the key to the pitch type
labels:
FB: fastball
SL: slider
CU: change-up
CB: curveball
As always, the movement variables are defined relative to a hypothetical
pitch without spin and the viewpoint is that of the catcher. The
darker zones show the typical movement of the pitch. These plots are
for right-handers only. For a left-hander, the plots would look like
these reflected in a mirror.
Here’s a table showing the average movement and speed values, in
inches and mph, respectively, for the
four pitch types:
+-----------+--------+-------+-------+------+
| PitchType | NP     | speed | horiz | vert |
+-----------+--------+-------+-------+------+
| FB        | 164816 |   91  |  -6.2 |  8.9 |
| SL        |  48190 |   84  |   0.7 |  3.7 |
| CB        |  34274 |   77  |   5.2 | -3.3 |
| CU        |  30831 |   82  |  -7.4 |  6.0 |
+-----------+--------+-------+-------+------+
This table includes both right- and left-handed pitchers. I’ve
reversed the sign of the horizontal movement for lefties, making it
possible to average all pitchers together.
As we knew, the fastball is thrown hardest and most frequently,
followed, in both categories, by the slider. Change-ups and sliders are
actually thrown with similar speeds, although the change-up tends to
run into a right-handed batter, while the slider moves (slightly)
away.
When to throw what
Now that we have a sizable sample of each pitch type, we can
investigate a bit how each type was used. For example, let’s look at
how pitchers varied their selection depending on the handedness of the
batter:
+------+------+------+------+------+
| L/R  | FB%  | SL%  | CB%  | CU%  |
+------+------+------+------+------+
| Opp  | 0.59 | 0.14 | 0.11 | 0.16 |
| Same | 0.59 | 0.21 | 0.13 | 0.05 |
+------+------+------+------+------+
| All  | 0.59 | 0.17 | 0.12 | 0.11 |
+------+------+------+------+------+
Opp—batter platoon advantage
Same—pitcher platoon advantage
These numbers confirm (and quantify) what we already knew: pitchers
tend to throw more sliders and curves and fewer change-ups, when they
have the platoon advantage (pitcher and hitter of the same hand). In
any case, pitchers throw a majority of fastballs (59% of pitches
thrown) no matter what side of the plate the batter is standing on.
We can also look at how pitch selection varies depending on the
count:
+------+------+------+------+------+
| Cnt  | FB%  | SL%  | CB%  | CU%  |
+------+------+------+------+------+
| 3-0  | 0.84 | 0.05 | 0.03 | 0.08 |
| 3-1  | 0.80 | 0.10 | 0.03 | 0.07 |
| 2-0  | 0.75 | 0.11 | 0.04 | 0.10 |
| 3-2  | 0.66 | 0.17 | 0.08 | 0.09 |
| 1-0  | 0.63 | 0.15 | 0.08 | 0.13 |
| 2-1  | 0.64 | 0.16 | 0.08 | 0.13 |
| 0-0  | 0.63 | 0.15 | 0.12 | 0.09 |
| 1-1  | 0.53 | 0.19 | 0.13 | 0.14 |
| 0-1  | 0.52 | 0.20 | 0.15 | 0.12 |
| 2-2  | 0.51 | 0.21 | 0.16 | 0.12 |
| 1-2  | 0.48 | 0.22 | 0.19 | 0.11 |
| 0-2  | 0.51 | 0.21 | 0.18 | 0.09 |
+------+------+------+------+------+
I’ve placed the rows in this table in order of how advantageous the
count is for the hitter, 3-0 being the best hitter’s count and 0-2
being the worst. Now look at the fastball percentage: there is an
almost perfect progression from lots of fastballs (84% on 3-0) down to
about 50% fastballs on the worst hitter’s counts.
What’s clearly happening is that when behind in the count pitchers
will try to throw a strike to move the count in their
favor. Presumably, the fastball is the easiest pitch to control, so
that’s the pitch they choose. When they are ahead in the count, the
cost of throwing a ball is reduced, so they can try the fancy stuff.
A possible exception may be given by the 0-2 count, where the fastball
percentage goes back up a tick, instead of continuing downward. I
wonder if pitchers are employing a little game theory here: throwing a
few more fastballs than expected in order to confound the batter.
Performance by pitch type
Now that we have some idea about pitch selection,
let’s have a look at what happens to these different pitches. The
following table shows how often a particular kind of pitch resulted in
a ball, called strike, foul ball, swinging strike or ball in play.
+-----------+-------+---------+-------+-----------+---------+
| PitchType | Ball% | Called% | Foul% | Swinging% | InPlay% |
+-----------+-------+---------+-------+-----------+---------+
| FB        |  0.36 |    0.19 |  0.19 |      0.06 |    0.19 |
| SL        |  0.36 |    0.14 |  0.17 |      0.13 |    0.20 |
| CB        |  0.40 |    0.19 |  0.13 |      0.11 |    0.16 |
| CU        |  0.40 |    0.11 |  0.14 |      0.13 |    0.21 |
+-----------+-------+---------+-------+-----------+---------+
| All       |  0.37 |    0.17 |  0.17 |      0.09 |    0.19 |
+-----------+-------+---------+-------+-----------+---------+
InPlay - includes home runs
There’s lots of interesting information to be gleaned from these
numbers, so let’s take it one step at a time. First of all, looking at
Ball%, we see that the slider is about as easy to throw for a strike
as the fastball, so perhaps pitchers should go to the slider a bit
more often when down in the count. Obviously, these are general
trends and each particular pitcher will weigh his own strengths and
weaknesses (and those of the batter) when making his pitch selection.
Perhaps the biggest surprise in these numbers, at least for me, is the
low percentage of swinging strikes on fastballs. The image of the
mightly slugger swinging through a blazing fastball goes all the way back to
Ernest Thayer’s
“Casey at the Bat”, written over a century ago. But
what we see above tells a different story — if you want to get a
swinging strike, the fastball (on average) is the worst pitch for the
job. Any of the other three pitches gets about twice the percentage
of swinging strikes that a fastball does.

You might be wondering about 3-0 counts—as we saw above, 3-0
counts lead to a lot of fastballs, and since many batters will take the
3-0 pitch, that will reduce the swinging strike percentage for
fastballs. This is true, but the effect is very small, due to the
small number of pitches thrown on 3-0. I’ve made the above table
excluding 3-0 counts and there is no material difference.
It’s interesting to note the fraction of pitches taken, given by the
sum of Ball% and Called%. The curveball is taken most often (59%),
while the slider is taken least often (50%). The InPlay% is highest
for the change-up and lowest for the curve, with a fairly large
difference between the two.
I’m not offering reasons for these differences, because I don’t have
any. I thought the numbers were interesting, though. I will offer a
plausible reason for the Foul% numbers that we see: my hypothesis is
the faster the pitch, the greater the chance of fouling it off.
But what happens to the balls in play? Are particular pitches more
susceptible to the home run? (Mr. Fastball, I’m looking at you.) What
about hits in general? Does batting average on balls in play (BABIP)
depend on pitch type? Let’s have a look:
+-----------+-------+-------+-------+-------+-------+
| PitchType | NP    | AVG   | BABIP | SLG   | HR%   |
+-----------+-------+-------+-------+-------+-------+
| FB        | 31704 | 0.330 | 0.304 | 0.521 | 0.037 |
| SL        |  9433 | 0.310 | 0.286 | 0.481 | 0.033 |
| CB        |  5577 | 0.310 | 0.290 | 0.471 | 0.029 |
| CU        |  6594 | 0.319 | 0.295 | 0.502 | 0.035 |
+-----------+-------+-------+-------+-------+-------+
| All       | 53308 | 0.323 | 0.298 | 0.506 | 0.035 |
+-----------+-------+-------+-------+-------+-------+
These are now only pitches where the ball was put into play. It’s
interesting that the worst numbers across the board belong to the most
frequently thrown pitch: the fastball. Overall, the balls put into
play off the curveball seem to do the least damage of the four.
As I suspected, the highest home run rate comes against the fastball—after all, the fastball has relative rise, which should result
in more fly balls and, hence, more home runs.
What about BABIP, or batting average on balls in play (excluding home
runs)? As you may know, there is an ongoing debate in the saber world
about how much control a pitcher has over BABIP. I believe that
pitchers do have some measure of control, but less than is commonly
believed, maybe. What we don’t know is what gives some pitchers the
ability to limit BABIP. Might it be related to the type of pitches he
throws?
From the above table, it looks like fastball pitchers would have a
higher-than-average BABIP, while pitchers who throw lots of breaking
stuff might show lower BABIP values. However, we also know that BABIP
will depend on the flyball tendencies of the pitcher, which, in turn
will depend somewhat on pitch selection.
In other words, this is a complicated business, one that I will
perhaps tackle at a later date. But, there may be an important link
between BABIP and pitch type.
What about grounders and fly balls? Do certain pitch types
preferentially induce particular batted ball trajectories? The answer
is, yes, to some degree. The following table tells the story:
+-----------+-------+-------+-------+-------+-------+
| PitchType | NP    | G     | L     | F     | P     |
+-----------+-------+-------+-------+-------+-------+
| FB        | 31732 | 0.428 | 0.194 | 0.289 | 0.077 |
| SL        |  9593 | 0.446 | 0.186 | 0.269 | 0.084 |
| CB        |  5633 | 0.481 | 0.185 | 0.252 | 0.068 |
| CU        |  6547 | 0.479 | 0.185 | 0.255 | 0.068 |
+-----------+-------+-------+-------+-------+-------+
G - ground ball
L - line drive
F - fly ball
P - pop up
As we might expect, we get more fly balls and fewer grounders on
fastballs, which tend to have a large upward movement (relative to the
hypothetical spinless pitch, remember). Actually, the
best pitch to induce a ground ball when one is needed is the sinking
fastball. Noted ground ball artists such as Brandon Webb, Derek Lowe
and Chien-Ming Wang all specialize in the sinking fastball.
Now, distinguishing the sinking fastball from a normal rising fastball
using the Pitch f/x data is a bit tricky. But we can do a reasonable
job simply by calling any fastball with a vertical movement less than
six inches a sinking fastball. Here now is the above table showing
batted ball types for each pitch, including now the sinking fastball
(sFB):
+-----------+-------+-------+-------+-------+-------+
| PitchType | NP    | G     | L     | F     | P     |
+-----------+-------+-------+-------+-------+-------+
| FB        | 25377 | 0.388 | 0.199 | 0.315 | 0.087 |
| sFB       |  6355 | 0.591 | 0.173 | 0.185 | 0.036 |
| SL        |  9593 | 0.446 | 0.186 | 0.269 | 0.084 |
| CB        |  5633 | 0.481 | 0.185 | 0.252 | 0.068 |
| CU        |  6547 | 0.479 | 0.185 | 0.255 | 0.068 |
+-----------+-------+-------+-------+-------+-------+
Look at how the sinking and rising fastballs have such different
batted-ball outcomes now: the groundball percentage of the sinker is
59%, higher than any other kind of pitch (not surprisingly). And the
rising fastballs are at the other extreme: only 39% ground balls,
lowest of any pitch type.
We see the same tendencies with the line drive as well, although the
differences are not as stark. Curious.
What have we learned?
I don’t know about you, but I’ve learned a lot researching this
article. I didn’t realize the averge fastball was thrown comfortably
above 90 mph. I can remember, not all that long ago, when 90 mph was
considered throwing hard; now it’s below average.
The change-up, despite was you sometimes read, is not the slowest pitch
thrown (the curveball is). I read recently a claim that somebody’s
change-up was 20 mph slower than his fastball—no way! The
average difference between fastball and change-up is 9 mph. I haven’t
checked, but I’m confident that nobody has a 20 mph difference between
the two pitches.
Pitchers throw the change-up three times more often when facing an
opposite-hand batter, but throw the fastball equally as often,
regardless of the handedness of the batter. This is not a good
stategy, as you will see when you read my article on platoon splits
for different pitch types in the
Hardball Times Basebll Annual 2008 (plug!).
Fastballs appear to have the worst BABIP and sliders the best,
although a rigorous link between BABIP and pitch type needs more
study. A quick look at batted-ball types, though, reveals that a
larger proportion of line drives come off rising fastballs.
I could go on, but this seems like a good place to pause. There is
plenty more to think about, now that we have lots of pitches
classified by pitch type. Keep an eye out for more of this stuff as
the offseason progresses.
References & Resources
Classifying Pitches
There are two distinct tasks involved in classifying pitches: 1) for each
pitcher, separate his pitches into clusters of distinct pitch types;
2) determine the pitch type for each cluster. The first part is
accomplished using a standard clustering algorithm known as
k-means. The algorithm uses three Pitch f/x quantities — speed,
horizontal movement and vertical movement — to divide the
pitches into different clusters. The only “intelligent” input that I
must give is the number of pitches that any given pitcher has.
I determined the number of pitches that any pitcher has by visual
inspection of movement/speed plots for about 400 pitchers. That sounds
like a lot of work, but in only took me a couple of hours once I had
written a program to flash a series of plots on my screen, allowing me
to quickly judge how many pitchers a particular guy throws.
Once the pitches have been clustered into distinct groups, we now
have to determine what kind of pitch each cluster is. The first step
is to find the average speed, horizontal and vertical movement for all
pitches in each cluster. Next, I call the pitch with the highest speed
the fastball.
I assume the remaining pitches are slider, curveball or
change-up. Splitters actually work like change-ups and are usually
labeled change-up. Fastball variations (2-seamer, cutter) usually are
labeled fastball. As we gain more experience with the Pitch f/x data,
I expect we’ll be come up with more sophisticated classification
techniques.
Once the fastball is identified, I know generally where to look, in
terms of speed and movement, for the other pitcher types. For example,
I know that on average a change-up is about 10% slower, has around 30%
more horizontal movement and 35% less vertical movement than the
fastball. I have determined similar profiles for sliders and
change-ups.
Of course, each pitcher is different and nobody will have pitches that
match up exactly with the average pitch profile. So, for each pitch I calculate
a
number that tells me how close it matches each of the three possible
pitch types. I then simply classify the pitch according to the best
match.
I liked the article, but your % are all wrong in that format — you wrote them as “0.53%”, for example. This number, as a true per cent, should have been 53%. What you wrote is equal to a mere fraction of 1% — 0.53.