FIP and the Long Ball
At the beginning of the 2005 season, I made an attempt to predict the future by looking at the difference between Earned Run Average (ERA) and Fielding-Independent Pitching (FIP) for a bunch of individual pitchers. Actually, the article was originally about line drives, but as we’ve shown in the Hardball Times Annual, line drive rates aren’t really predictable from year to year.
Strikeout rates and walk rates are predictable, which is what makes FIP a very useful stat. FIP is based on strikeouts, walks and home runs, and it’s a better indicator of a pitcher’s future performance than ERA is, believe it or not.
For instance, here is the list of pitchers I thought were most likely to have better ERAs in 2005, based on the difference between their 2004 ERA and 2004 FIP. I’ve also added each pitcher’s actual 2005 ERA, with a +/- sign to show which ones went up and which ones went down:
Player            IP      ERA    FIP    Diff    2005 ERA
Fassero J.       111.0    5.51  4.35    1.16      4.05     -
Millwood K.      141.0    4.85  3.82    1.03      2.86     -
Obermueller W.   118.0    5.80  4.86    0.93      5.26     -
Acevedo J.       157.7    5.94  5.01    0.93      6.47     +
Vogelsong R.     133.0    6.50  5.57    0.93      4.43     -
Lowe D.          182.7    5.42  4.50    0.92      3.61     -
Van Poppel T     115.3    6.09  5.21    0.88      DNP     DNP
Fossum C.        142.0    6.65  5.80    0.86      4.92     -
Sparks S.        120.7    6.04  5.30    0.74      DNP     DNP
Benoit J.        103.0    5.68  4.97    0.70      3.72     -
Johnson J.       196.7    5.13  4.46    0.67      4.54     -
Wood M.          100.0    5.94  5.31    0.63      4.46     -
Santos V.        154.0    4.97  4.34    0.63      4.57     -
Ponson S.        215.7    5.30  4.68    0.62      6.21     +
Benson K.        132.3    4.22  3.63    0.58      4.13     -
Davis J.         114.3    5.51  4.95    0.56      4.69     -
Prior M.         118.7    4.02  3.55    0.47      3.67     -
Burnett A.       120.0    3.68  3.21    0.47      3.44     -
Alvarez W.       120.7    4.03  3.56    0.46      4.63     +
Lidle C.         149.0    5.32  4.90    0.42      4.53     -
Hermanson D.     131.0    4.53  4.12    0.41      2.04     -
Mussina M.       164.7    4.59  4.18    0.41      4.41     -
Jennings J.      201.0    5.51  5.10    0.41      5.02     -
Redding T.       100.7    5.72  5.32    0.40      9.10     +

AVERAGE                   5.29  4.61              4.58    18
As you can see, ERA improved for 18 out of the 22 pitchers (82%) who played in 2005, and the group’s 2005 ERA was almost equal to its 2004 FIP (4.58 vs. 4.61). I’m not going to brag too much about this, because anytime you take a list of guys with ERAs over 5.00, you can be sure that they’ll have lower ERAs the following year. It’s called regression to the mean.
Well, maybe I’ll brag a little.
Anyway, I also made a list of the pitchers most likely to have higher ERAs in 2005. For some reason, I listed 30 instead of 24. (Note to self: bigger lists result in more bad predictions.) Here is my original list, along with each pitcher’s 2005 results:
Player                IP     ERA      FIP     Diff     2005 ERA
Leiter A.           173.7    3.21    4.78    -1.57      6.13    +
Elarton S.          117.3    4.53    5.87    -1.34      4.61    +
Zambrano V.         128.0    4.43    5.53    -1.10      4.17    -
Lima J.             170.3    4.07    5.11    -1.04      6.99    +
Villone R.          117.0    4.08    5.10    -1.02      4.21    +
Vargas C.           118.3    5.25    6.22    -0.97      5.24    -
Greinke Z.          145.0    3.97    4.94    -0.97      5.80    +
Perez O.            196.3    3.25    4.20    -0.95      4.56    +
Westbrook J.        215.7    3.38    4.27    -0.89      4.49    +
Peavy J.            166.3    2.27    3.16    -0.88      2.88    +
Lopez R.            170.7    3.59    4.45    -0.87      4.90    +
Marquis J.          201.3    3.71    4.57    -0.86      4.13    +
Zambrano C.         209.7    2.75    3.59    -0.84      3.26    +
Webb B.             208.0    3.59    4.43    -0.84      3.54    -
Trachsel S.         202.7    4.00    4.82    -0.82      4.14    +
Day Z.              116.7    3.93    4.73    -0.80      6.85    +
Moyer J.            202.0    5.21    5.98    -0.77      4.28    -
Kennedy J.          162.3    3.66    4.37    -0.71      6.01    +
Bell R.             123.0    4.46    5.17    -0.71      8.28    +
Ortiz R.            204.7    4.13    4.82    -0.68      6.89    +
Lilly T.            197.3    4.06    4.74    -0.68      5.56    +
Glavine T.          212.3    3.60    4.25    -0.65      3.53    -
Milton E.           201.0    4.75    5.38    -0.63      6.47    +
Suppan J.           188.0    4.16    4.79    -0.63      3.57    -
Redman M.           191.0    4.71    5.29    -0.57      4.90    +
Ishii K.            172.0    4.71    5.28    -0.57      5.14    +
Pavano C.           222.3    3.00    3.56    -0.57      4.77    +
Franklin R.         200.3    4.90    5.45    -0.56      5.10    +
Santana J.          228.0    2.61    3.16    -0.55      2.87    +
Buehrle M.          245.3    3.89    4.41    -0.52      3.12    -

Average                      3.93    4.75               4.88    23
Once again, the group’s 2004 FIP nicely matched their 2005 ERA (4.75 to 4.88), and ERA rose for 23 of the 30 pitchers (76%). However, there were some notable exceptions to the trend, including Brandon Webb, Jamie Moyer, Tom Glavine, Jeff Suppan and Mark Buehrle. To get a better feel for what happened with those five guys, I calculated their 2004 and 2005 strikeout and walk rates (per batter faced) and home run rates (per outfield fly, adjusted for ballpark) to see if one of their FIP elements changed between 2004 and 2005. Here were the major differences for each guy:
                    2004    2005
Webb's Walk Rate     14%      7%
Moyer's HR Rate      19%     10%
Glavine's HR Rate    11%      7%
Suppan"s Dunno       ???     ???
Buehrle's HR Rate    13%      8%
Brandon Webb was crazy-wild in 2004 and his improvement in 2005 was a direct result of getting that sinker of his in the strike zone. I can’t figure out what’s up with Jeff Suppan—that might be a column for another day—but the deal with Moyer, Glavine and Buehrle was pretty straightforward. Their home run rates went down.
A pitcher’s strikeout rate and walk rate don’t tend to change much, particularly once he’s established in the major leagues. However, home run rates can vary quite a big for even long-time veterans. Tom Meagher reviewed this subject in an article last March, and most of his predictions also came true. (Please ignore the Danny Graves fiasco. Nothing to see here, folks. Just move on).
To show you how much home run rates can vary, take a look at this chart of Mark Buerhle’s home run rate per nine innings pitched for the last four years (with in-season trends included):
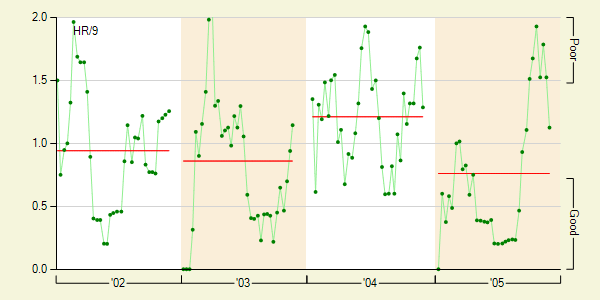
(courtesy of fangraphs)
As you can see, Buerhle really kept the ball in the park the first half of the year. However, his 2006 home run performance is more likely to represent his 2002-2004 levels, and I won’t be surprised to see his ERA around 4.00 next year. Despite what David Cameron says.
But Buerhle isn’t the only pitcher in this camp. To determine the pitchers most likely to yield more home runs next year, I compared how many home runs each pitcher allowed in 2005 to how many he would have been expected to allow given his outfield fly rate and ballpark. I’ve listed the “over/under” for each one, and here are the top “unders:”
Name                   Total
   Rogers, Kenny        -12
   Buehrle, Mark        -11
   Young, Chris         -11
   Willis, Dontrelle    -11
   Glavine, Tom         -10
   Arroyo, Bronson      -10
   Clemens, Roger        -9
   Byrd, Paul            -8
   Kazmir, Scott E       -8
   Majewski, Gary W      -7
   Lackey, John          -7
   Oswalt, Roy           -7
   Martinez, Pedro       -7
In other words, Kenny Rogers allowed 12 fewer home runs than a league-average pitcher would have. That won’t happen again next year, and the Rangers better have lowered expectations for Rogers and Chris Young. As you can see, both Buerhle and Glavine are also likely see a few more clear the fence in 2006.
Here’s the reverse idea, pitchers who allowed more home runs than expected and are likely to improve next year:
   Vazquez, Javier       12
   Lowe, Derek           12
   Ortiz, Ramon          11
   Ramirez, Horacio      11
   Myers, Brett          10
   Perez, Oliver          9
   Maroth, Mike           9
   Robertson, Nate        8
   Chen, Bruce            8
   Astacio, Ezequiel      8
   Marquis, Jason         8
   Lieber, Jon            8
   Webb, Brandon          8
Most of these guys will do better next year, particularly the ones at the top of the list. So who’s going to pick up Javier Vazquez?

References & Resources
By the way, I would write an article using FIP to predict next year’s ERA, but you can actually look that up yourself on our stats pages, where Jeff Suppan is listed as fourth-most-likely to have a higher ERA next year.