Forecasting Pitcher Platoon Splits
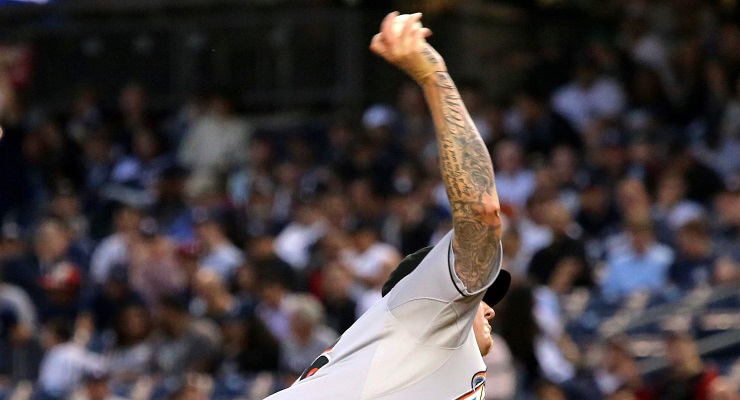
Mat Latos has the highest arm angle (most over-the-top) in baseball this season. (via Arturo Pardavila III)
In The Book, Tom Tango, Mitchel Lichtman and Andrew Dolphin found that pitchers’ platoon splits are considerably more variable than hitters’ splits. In fact, they found that pitchers with true reverse splits, meaning pitchers who are actually less effective against same-handed hitters, are not exceedingly rare. The Book reports that (p. 165):
Among the pitchers with large platoon splits, we find that about three quarters rely largely on a slider or a non-overhand curve. Pitchers with ¾-arm or lower (e.g., Fossum, Bradford and Reed) deliveries also tend to be found on the high-platoon split list. This also suggests that one can estimate pitcher platoon splits even better if one knows the types of pitches being thrown and the arm angle and then divides pitchers accordingly, rather than merely by handedness. Unfortunately, our data do not include pitch types, so we must proceed without exploiting this fact.”
In the 2008 Hardball Times Annual, John Walsh went back further in time and using Retrosheet data and the Neyer/James Guide to Pitchers found that pitchers from 1957 to 2006 with extreme platoon splits were often side-armers and, as a group, threw more sliders than curves. Pitchers with small or reverse platoon splits tended to throw more change-ups and curveballs and fewer sliders. He also noted that low-platoon-split pitchers were often noted as throwing a screwball. Walsh quantified his findings in the following table where a pitcher’s first pitch (according to Neyer/James) was awarded five usage points, his second pitch three points and his third pitch one point.
| John Walsh’s Pitch Usage Points | Pitch Usage Points | |||
|---|---|---|---|---|
| Extremum | # of Pitchers | Slider | Curveball | Changeup |
| High-Split | 22 | 53 | 21 | 10 |
| Low-Split | 29 | 22 | 62 | 42 |
Walsh also took advantage of the then-new PITCHf/x data along with pitch level results to determine the average platoon difference, in runs per 100 pitches of fastballs, curves, change-ups and sliders. True to the historical study, he found that fastballs and sliders produced large splits while change-ups and curves led to smaller splits.
In 2010, Max Marchi classified pitch types into 14 categories and calculated platoon splits (like Walsh, in runs per 100 pitches) and likewise found that fastballs (particularly sinkers), sliders and cutters had large splits while change-ups and curves had small splits, with roundhouse curves and straight changes even showing large reverse splits.
We now have considerably more PITCHf/x data and, thanks to Brooks Baseball and Pitch Info, accurate pitch types, and, I hope to show, reasonable ways of inferring pitchers’ arm angles. Here’s one attempt at putting this all together and estimating pitcher platoon splits.
Estimating Arm Angles: An Excruciating Detour
Feel free to skip ahead to the section on platoon splits. Seriously, I won’t even know.
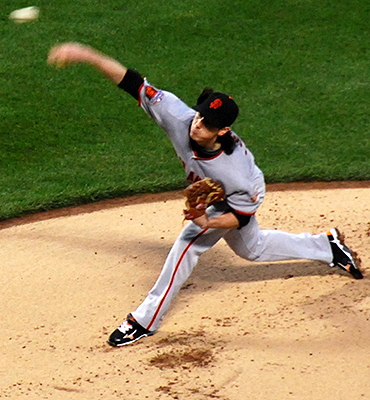
Tim Lincecum (via slgckgc)
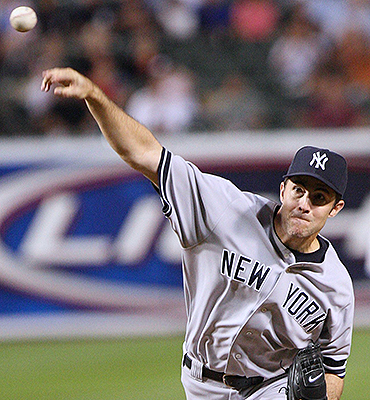
Mike Mussina (via Keith Allison)
Brooks Baseball estimates the height and left-right deflection of each pitch when it is 55 feet from the plate. Mike Fast noted that even though pitchers may well release the ball from nearer or farther than 55 feet from the plate, these provide accurate two-dimensional estimates of pitcher release points. Fast then used changes in release point to identify changes in arm angle and showed that pitchers with wandering release points walked more batters. My goal here is somewhat different, with the aim of comparing arm angles between pitchers rather than comparing the same pitcher one month to the next, and in this case using release points as a stand-in for arm angles—even adjusted for a pitcher’s height—may leave something to be desired. For instance, even though Mike Mussina is four inches taller than Tim Lincecum, and thus releases the ball 10 inches higher, it is Lincecum who has the higher arm angle, as you can see in the photos at the right.
To address this methodological shortcoming, I looked for a second approach to estimating a pitcher’s arm angles. In Baseball Prospectus 2015, in an article entitled “Delivery Angles Determines Pitch Movement,” Dan Brooks, Glen Fleisig and Harry Pavlidis noted one such method. Using Brooks Baseball data along with arm angle measurements of 25 pitchers provided by ASMI, they found a correlation of .75 between four-seam fastball angle and arm angle and a correlation of .79 between two-seam fastball (sinker) movement and arm angle.
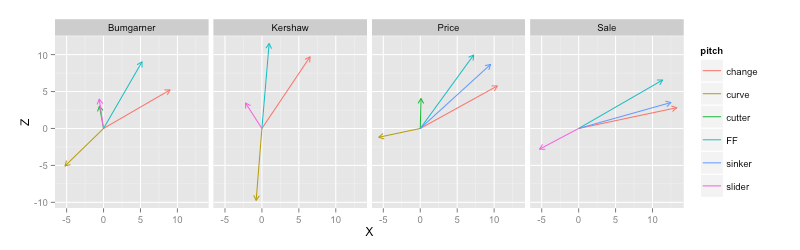
The following chart showing the pitch movements of four familiar left-handed pitchers as seen by the catcher gives a sense of how we can use pitch movements to estimate arm angles. Clayton Kershaw’s four-seam fastball (denoted FF and shown in turquoise) moves nearly straight up, while Chris Sale’s four-seam fastball has arm-side run. Madison Bumgarner’s and David Price’s fastballs lie somewhere in between. But also note what these four pitchers have in common—the angle between each pitcher’s four-seam fastball and his change-up is roughly the same—in other words, four-seam fastball angles and change-up angles are correlated.
The following graph (based on Brooks Baseball data from 2008 through mid 2015) shows the correlations between a pitcher’s vertical release points as a percentage of his height (rel_height_percentage) and the movements of each of his pitches. We see that fastball movement and change-up movement are correlated to release height as well as to each other. What’s the common factor driving these correlation? I’m positing that it is the pitcher’s arm angle. For the technically inclined, I’m suggesting that the first principal component of fastball movement, change-up movement and release point could be well described as arm angle.
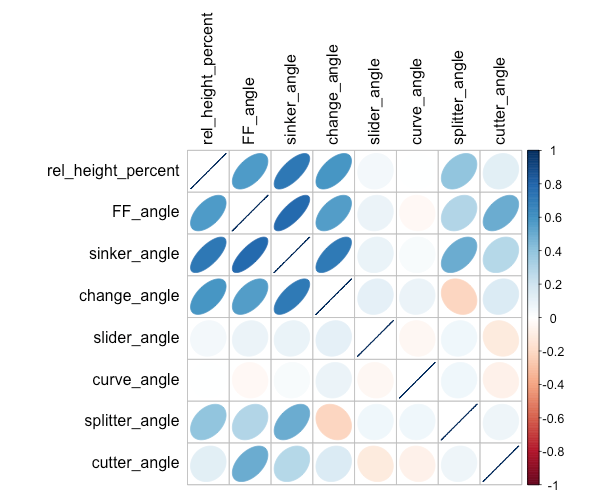
While my first inclination was, in fact, to compute the first principal component of pitch movements and release points, in practice this proved quite similar to simply standardizing four variables (the movement of four-seam fastballs, sinkers and change-ups along with the height-adjusted vertical release point) and averaging them to produce an arm angle score. Opting for simplicity, at least for the moment, I chose this path.
I did, however, feel the need to make three adjustments, lest this be too simple. First, I realized that there were two ways for a pitcher’s arm angle estimate to change from one year to the next. Most obviously, his arm angle estimate will change if one or more of the four variables it depends on changes. It could also change, however if a pitcher adds (or subtracts) a pitch that suggests a different arm angle than his other pitches, thus moving the average. This latter type of change wouldn’t suggest that his arm angle had actually changed so much as that the estimate based on fewer pitches may be wrong. To address this, I estimated each pitcher’s mean career arm angle based on the averages of each pitch movement along with his adjusted release point over his entire career and then adjusted his seasonal arm angle estimates up or down based on how his pitch movements and release point that season differed from his career averages.
Second, I realized that pitch angles were more volatile for pitches with less total movement and decided to weigh pitch angles by absolute pitch movement when computing arm angle scores. Third, I decided that Samuel Deduno’s arm angle should be estimated based on his release point alone since I simply can’t believe that what he claims is a four-seam fastball really is one.
Finally, I converted arm angle z-scores (representing the number of standard deviations a pitcher’s arm angle is above or below the mean arm angle of all pitchers) to a scale that looks more like actual arm angles—calibrating these scores so that, on average, a pitcher’s estimated arm angle falls halfway between his four-seam fastball angle and his sinker angle.
| Highest Arm Angles, 2015 |
|---|
| Pitcher | Arm Angle (Degrees) |
| Mat Latos | 81 |
| Josh Collmenter | 79 |
| Tim Lincecum | 79 |
| Preston Guilmet | 75 |
| Kendry Flores | 73 |
| Christian Friedrich | 70 |
| Greg Holland | 68 |
| Javy Guerra | 68 |
| Junior Guerra | 68 |
| Chris Young | 68 |
| Lowest Arm Angles, 2015 |
|---|
| Pitcher | Arm Angle (Degrees) |
| Brad Ziegler | -33 |
| Joe Smith | -10 |
| Randy Choate | -9 |
| Darren O’Day | -8 |
| Joe Thatcher | 0 |
| Steve Cishek | 2 |
| Mychal Givens | 4 |
| Alex Claudio | 6 |
| Kyle Crockett | 15 |
| Justin Masterson | 15 |
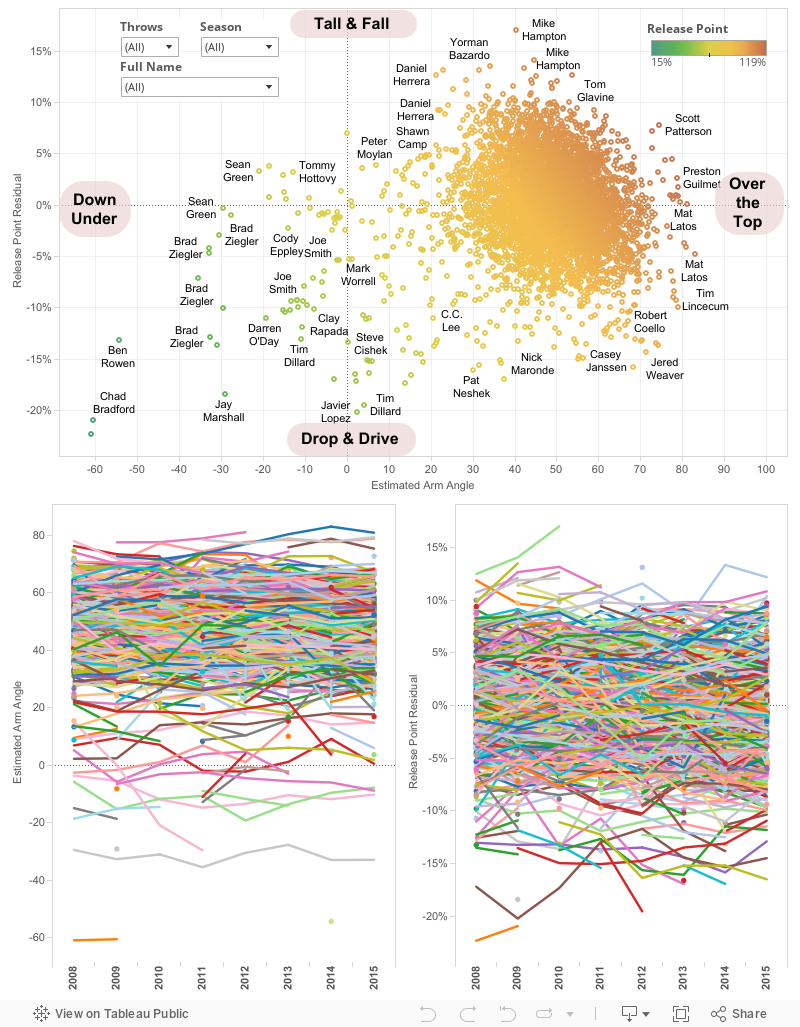
Since we now have a way of estimating arm angles that relies not only on release height, it may also be interesting to look at pitchers whose release heights differ from what we would expect based on their estimated arm angle. In the graph below, these differences (labeled “release point residuals”) are plotted against estimated arm angle. If you select a pitcher on the upper plot you can see his career trends in arm angles and release point residuals on the graphs below.
Arm Angle Dashboard
A full table of arm angle estimates by can be found here.
Splits by Arm Angle Group
With arm angles now in hand, I computed pitchers’ splits within arm angle groups, eliminating plate appearances by pitchers and pinch hitters. In the tables below positive differences refer to higher rates against left-handed batters and negative numbers refer to higher rates against right-handed batters. Sidearming righties (with arm angles less 20 degrees) strike out 21.9 percent of right-handed batters and only 15.5 percent of left-handed batters, a difference of 6.4 percent. The table below shows a difference of 6.3 percent, which is adjusted for the batters they faced (based on preseason projections). For pitchers with arm angles greater than 60 degrees, the difference in strikeout percentage was only 0.1 percent. Sidewinders also had a whopping 76-point wOBA split (again, adjusted for the quality of the batters), considerably larger than the wOBA split for other arm angle groups with the wOBA split falling all the way down to six points for pitchers with an arm angle higher than 60 degrees.
Note that these sidearmers are almost entirely relief pitchers and that while 30 percent of the batters faced by the < 20 degrees group were faced by a starter, that’s entirely the work of Justin Masterson, whose 73 point wOBA split is right in line with what his sidearming reliever peers have accomplished. Both starters and relievers show very small wOBA splits among pitchers with high arm angles.
| Right-Handed Pitcher Platoon Splits by Arm Angle Group | |||||||||
|---|---|---|---|---|---|---|---|---|---|
| Adjusted Splits | |||||||||
| Arm Angle Group | % PA v LHB | Distinct Pitchers | Total PA | % SP | SO% | UBB% | wOBA | wOBA SP | wOBA RP |
| < 20 | 44% | 21 | 16,000 | 30 | -6.3 | 1.8 | 0.076 | 0.073* | 0.076 |
| 20 to 40 | 47% | 183 | 120,200 | 55 | -3.3 | 2.1 | 0.028 | 0.021 | 0.034 |
| 40 to 45 | 48% | 212 | 118,800 | 62 | -1.3 | 2.1 | 0.021 | 0.024 | 0.021 |
| 45 to 50 | 50% | 303 | 188,300 | 71 | -1.2 | 2.0 | 0.016 | 0.014 | 0.017 |
| 50 to 55 | 49% | 322 | 191,100 | 72 | -0.5 | 1.8 | 0.011 | 0.012 | 0.001 |
| 55 to 60 | 49% | 241 | 158,400 | 68 | -0.6 | 1.9 | 0.010 | 0.010 | 0.010 |
| > 60 | 50% | 163 | 134,600 | 70 | -0.1 | 1.6 | 0.006 | 0.003 | 0.007 |
* Justin Masterson
We see a similar trend among left-handed pitchers with a whopping 110-point wOBA split for sidearm pitchers. Here, however, the trend toward smaller splits with higher arm angles appears to be weak once sidearm pitchers are excluded.
| Left-Handed Pitcher Platoon Splits by Arm Angle Group | |||||||||
|---|---|---|---|---|---|---|---|---|---|
| Adjusted Splits | |||||||||
| Arm Angle Group | % PA v LHB | Distinct P’s | Total PA | % SP | SO% | UBB% | wOBA | wOBA SP | wOBA RP |
| < 20 | 55% | 12 | 5,100 | 0 | 11.0 | -2.1 | -0.110 | NA | -0.110 |
| 20 to 40 | 37% | 80 | 36,400 | 41 | 5.2 | -1.7 | -0.049 | -0.048 | -0.048 |
| 40 to 45 | 29% | 110 | 64,500 | 74 | 4.1 | -1.3 | -0.042 | -0.037 | -0.049 |
| 45 to 50 | 28% | 136 | 94,300 | 80 | 3.9 | -1.4 | -0.043 | -0.043 | -0.039 |
| 50 to 55 | 29% | 119 | 70,200 | 73 | 2.4 | -1.0 | -0.029 | -0.032 | -0.025 |
| 55 to 60 | 29% | 82 | 58,700 | 76 | 2.4 | -1.3 | -0.030 | -0.024 | -0.040 |
| > 60 | 29% | 41 | 30,700 | 73 | 4.9 | -1.1 | -0.035 | -0.024 | -0.047 |
I was also curious to see what effect pitcher arm angles have on batted balls. Here are tables showing batted ball splits by arm angle group for right- and left-handed pitchers with soft, medium and hard contact numbers from Baseball Info Solutions (BIS). In both tables we see that opposite-handed hitters make harder contact for pitchers with low arm angles and that this difference fades to nearly zero for pitchers with high arm angles. While sidearmers have decidedly larger BABIP splits, these BABIP splits are nearly constant across other arm angle groups. There are trends toward lower HR/FB splits with higher arm angles and, again, these splits are considerable larger for sidearm pitchers.
| Right-Handed Pitcher Batted Ball Splits by Arm Angle Group | |||||||||
|---|---|---|---|---|---|---|---|---|---|
| BABIP | HR/FB% | Soft/Medium/Hard Contact | |||||||
| Arm Angle Group | LHB | RHB | Adjusted Diff | LHB | RHB | Diff | v. LHB | v. RHB | Diff |
| < 20 | 0.320 | 0.280 | 0.039 | 11.2 | 7.9 | 3.3 | 14 / 56 / 30 | 19 / 56 / 25 | -5 / 0 / 6 |
| 20 to 40 | 0.306 | 0.297 | 0.007 | 10.5 | 10.1 | 0.3 | 15 / 54 / 31 | 17 / 54 / 29 | -3 / 1 / 2 |
| 40 to 45 | 0.304 | 0.296 | 0.006 | 11.0 | 10.5 | 0.3 | 15 / 54 / 32 | 17 / 54 / 29 | -2 / 0 / 2 |
| 45 to 50 | 0.300 | 0.295 | 0.003 | 10.3 | 10.0 | 0.3 | 15 / 53 / 31 | 17 / 53 / 30 | -1 / 0 / 1 |
| 50 to 55 | 0.304 | 0.298 | 0.004 | 10.4 | 10.4 | -0.1 | 15 / 54 / 31 | 16 / 53 / 30 | -1 / 0 / 1 |
| 55 to 60 | 0.304 | 0.295 | 0.007 | 10.0 | 10.3 | -0.3 | 16 / 53 / 31 | 16 / 53 / 31 | 0 / 0 / 0 |
| > 60 | 0.295 | 0.289 | 0.004 | 10.0 | 10.1 | -0.2 | 16 / 53 / 31 | 16 / 53 / 31 | 0 / 0 / -1 |
| Left-Handed Pitcher Batted Ball Splits by Arm Angle Group | |||||||||
|---|---|---|---|---|---|---|---|---|---|
| BABIP | HR/FB% | Soft/Medium/Hard Contact | |||||||
| Arm Angle Group | LHB | RHB | Adjusted Diff | LHB | RHB | Diff | v. LHB | v. RHB | Diff |
| < 20 | 0.269 | 0.337 | -0.071 | 7.6 | 11.5 | -4.3 | 22 / 57 / 21 | 16 / 55 / 29 | 7 / 2 / -8 |
| 20 to 40 | 0.300 | 0.306 | -0.010 | 8.9 | 10.7 | -1.5 | 20 / 55 / 25 | 15 / 54 / 30 | 4 / 1 / -5 |
| 40 to 45 | 0.297 | 0.300 | -0.010 | 9.3 | 10.8 | -1.3 | 19 / 54 / 27 | 15 / 54 / 31 | 3 / 0 / -4 |
| 45 to 50 | 0.300 | 0.302 | -0.008 | 9.1 | 10.5 | -1.2 | 18 / 55 / 27 | 15 / 53 / 31 | 3 / 2 / -4 |
| 50 to 55 | 0.299 | 0.305 | -0.011 | 10.1 | 10.0 | 0.4 | 18 / 53 / 29 | 16 / 53 / 31 | 1 / 1 / -2 |
| 55 to 60 | 0.296 | 0.292 | -0.002 | 9.4 | 10.0 | -0.5 | 18 / 53 / 29 | 17 / 52 / 31 | 1 / 1 / -2 |
| > 60 | 0.297 | 0.308 | -0.016 | 9.9 | 9.8 | 0.2 | 17 / 53 / 30 | 18 / 52 / 31 | 0 / 1 / -1 |
Modeling Platoon Splits
I tested four types of models (linear regression, ridge regression, a general additive model and a random forest model) to see how well they would predict wOBA splits using arm angles and pitch frequencies. Ridge regression is much like linear regression except that it “shrinks” or regresses the regression coefficients toward zero. Sabermeticians often slice player data into samples and look at the quality of cross-sample consistency in order to determine how much to regress player stats when forming projections. We can apply the sample principle to regression coefficients—and this is essentially what ridge regression does.
A general additive model has the flexibility to produce smooth but non-linear relationships between predictors and what you’re trying predict. In this case, I wondered if there might be a non-linear relationship between arm angle and wOBA splits (maybe 10 degrees up or down matters more for lower arm angles, for instance) and used a general additive model to address this possibility.
A random forest model builds a forest out of, of course, trees. Here we’re referring to decision trees, splitting pitchers into branches and sub-branches while choosing the forks that produce the biggest differences between branches with some randomness imposed on the decision process so that these trees are not all alike. The resulting model is the average of all of the trees. Random forest models are (I imagine, I don’t really know) like the player similarity component of PECOTA where player similarity scores tell us how frequently any two players appear on the same branch. Random forest models don’t extrapolate beyond the range of the data, and this can be either a feature or a bug. If we were trying to predict starter’s strikeout rates based on fastball velocity, among other things, a random forest would most often place Noah Syndergaard on branches with the other hardest throwing starters in baseball, but it would not give Syndergaard extra credit for throwing even harder than his fireballing peers. Likewise, when predicting platoon splits it would see that Chad Bradford as most like other side-armers, but it wouldn’t project his platoon split to be even more extreme than these peers because his arm angle is even lower.
To test these models, I partitioned pitchers who have pitched from 2008 to the present into 20 roughly equal slices, built models based on 19 of these slices, and used those models to predict wOBA splits in the 20th slice. I then repeated this 19 more times, leaving out a different slice when building the models each time. The advantage of this method is that all of the predictions are “out-of-sample” and each model is still built on 95 percent of the data.
| Weighted Root Mean Square Error in Predicted wOBA Split ( >= 800 Harmonic PA) |
|---|
| Model | RHP | LHP |
| Ridge Regression | 0.0213 | 0.0321 |
| Linear Regression | 0.0214 | 0.0325 |
| General Additive Model | 0.0214 | 0.0330 |
| Random Forest | 0.0219 | 0.0332 |
| Know Nothing | 0.0240 | 0.0342 |
| God | 0.0177 | 0.0196 |
The ridge regression models slightly outperformed the linear regression and general additive models. The differences, in truth, between these three models were imperceptible and of no real consequence. Random forest predictions were considerably more unique, with correlations of roughly .8 with the other models, but they had somewhat larger errors. The “know nothing” model listed above simply predicted that all players in each fold had the same wOBA split as the weighted average of pitchers with the same throwing hand in the other 19 folds. “God,” here, shows an approximation of how a perfect system, which knows every pitcher’s true platoon split, would perform—with errors due to chance variation alone. For right-handed pitchers, the best models took us almost halfway from knowing nothing to knowing everything. For left-handed pitchers, the models were all considerably less god-like.
What do the models say?
According to the ridge regression model, a right-handed pitcher with a 50 degree arm angle (the median arm angle for right-handed pitchers) who throws entirely four-seam fastballs would have a platoon split of 19 points. Here’s how that platoon split changes with arm angle and pitch mix:
- +10 degrees arm angle: -5.7 points
- +10% sinkers: +1.8 points
- +10% sliders: +2.2 points
- +10% curves: -5.1 points
- +10% cutters: -1.3 points
- +10% splitters: -6.4 points
- +10% change-ups: -4.0 points
- >50% knuckleballs: -18 points
A left-handed pitcher who throws from a 50 degree arm angle and throws entirely four-seam fastballs is estimated to have a 20 point platoon split, which would be adjusted as follows:
- +10 degrees arm angle: -6.7 points
- +10% sinkers: +2.3 points
- +10% sliders: +4.9 points
- +10% curves: +0.0 points
- +10% cutters: -0.9 points
- +10% splitters: -3.0 points
- +10% change-ups: -9.1 points
Platoon Split Projections
We can use the results of this model as our “prior” when projecting pitcher platoon splits, regressing each pitcher’s observed platoon splits toward the model’s predictions instead of toward an average split. A mixed effects model suggests that we should regress a right-handed pitcher’s observed platoon splits by adding in roughly 1,670 harmonic plate appearances, or about 800 innings pitched of his prior. For left-handed pitchers, for whom our prior carries less information, we use only 570 harmonic plate appearances, which a left-handed starter might reach in 380 innings and a left-handed reliever (who likely faces more lefties) might reach in only 280 innings. Using observed career level splits and these regression levels we can estimate career-level wOBA splits. The distributions of priors based on the ridge regression model as well as distributions of estimated career-level splits for left-handed and right-handed pitchers are shown below.

Here we see that there are indeed some pitchers who are estimated to have reverse splits—more often right-handed pitchers than left-handed pitchers. The distributions in the bottom graph take observed splits into account in addition to arm angles and pitch mix, and show more left-handed pitchers estimated to have reverse splits and more overlap between the right-handed and left-handed populations.
To project a pitcher’s splits going forward, we can look at his historical splits relative to our model’s projections and regress those differences toward the mean to estimate how he is likely to perform relative to our model. Next, we can add these regressed differences to our model’s projected splits based on his most recent pitch data. In this way, our projections can move quickly to adjust a pitcher’s split projection if a pitcher starts throwing from down under or begins relying heavily on a new change-up. In the tables below, a positive split means that the pitcher has more success against left-handed batters and a negative split means that the pitcher has more success against right-handed batters.
| Top 20 RHP with the Most Severe Splits, 2015 |
|---|
| Name | 2015 wOBA split prior | Career wOBA split | Career Harmonic PA | 2015 wOBA Split Projection |
| Brad Ziegler | -0.066 | -0.085 | 937 | -0.071 |
| Justin Masterson | -0.052 | -0.073 | 2507 | -0.067 |
| Darren O’Day | -0.064 | -0.067 | 757 | -0.064 |
| Joe Smith | -0.066 | -0.045 | 846 | -0.058 |
| Steve Cishek | -0.064 | -0.033 | 585 | -0.058 |
| C.C. Lee | -0.057 | 0.055 | 55 | -0.053 |
| Charlie Morton | -0.027 | -0.068 | 1634 | -0.052 |
| Mark Lowe | -0.037 | -0.074 | 630 | -0.052 |
| David Carpenter | -0.056 | 0.042 | 99 | -0.051 |
| Carson Smith | -0.050 | -0.013 | 89 | -0.048 |
| Noe Ramirez | -0.048 | 0.057 | 9 | -0.048 |
| Chad Qualls | -0.042 | -0.059 | 924 | -0.047 |
| Blake Treinen | -0.040 | -0.110 | 185 | -0.047 |
| Chad Smith | -0.043 | -0.253 | 31 | -0.047 |
| Ronald Belisario | -0.041 | -0.063 | 660 | -0.047 |
| Adam Ottavino | -0.036 | -0.083 | 487 | -0.047 |
| Sergio Romo | -0.042 | -0.053 | 680 | -0.046 |
| Jared Hughes | -0.048 | -0.032 | 439 | -0.046 |
| Jeurys Familia | -0.035 | -0.098 | 291 | -0.045 |
| Mychal Givens | -0.045 | 0.000 | 1 | -0.045 |
| Top 20 RHP with the Weakest/Reverse Splits, 2015 |
|---|
| Name | 2015 wOBA split prior | Career wOBA split | Career Harmonic PA | 2015 wOBA Split Projection |
| Tyler Thornburg | 0.014 | 0.113 | 257 | 0.028 |
| David Robertson | 0.008 | 0.060 | 878 | 0.027 |
| Preston Guilmet | 0.023 | 0.184 | 47 | 0.027 |
| Oliver Drake | 0.023 | 0.020 | 16 | 0.023 |
| Tyler Clippard | 0.016 | 0.023 | 992 | 0.022 |
| Tim Lincecum | 0.012 | 0.022 | 2884 | 0.021 |
| Koji Uehara | 0.017 | 0.014 | 730 | 0.020 |
| Zach Putnam | 0.020 | 0.003 | 198 | 0.019 |
| Mark Melancon | 0.011 | 0.034 | 682 | 0.019 |
| Samuel Deduno | 0.004 | 0.049 | 671 | 0.018 |
| Joel Peralta | 0.017 | 0.019 | 819 | 0.018 |
| Dellin Betances | 0.014 | 0.030 | 287 | 0.017 |
| Anthony Varvaro | 0.007 | 0.053 | 363 | 0.016 |
| Jake Odorizzi | 0.015 | 0.008 | 614 | 0.015 |
| Jarred Cosart | 0.009 | 0.034 | 582 | 0.015 |
| Michael Wacha | 0.001 | 0.057 | 540 | 0.014 |
| Anibal Sanchez | -0.003 | 0.023 | 2314 | 0.014 |
| Will Harris | 0.004 | 0.071 | 282 | 0.014 |
| Cody Allen | 0.002 | 0.055 | 428 | 0.013 |
| Marco Estrada | 0.010 | 0.009 | 1242 | 0.013 |
Note that Noe Ramirez, Chad Smith and Mychal Givens are projected to have extreme splits despite almost no major league data (at least as of a couple of weeks ago, when these data were collected). Ramirez and Smith throw sinkers and sliders from a low arm slot while Givens throws sidearm and features four-seam fastballs and sliders. Preston Guilmet and Oliver Drake, who both throw over the top and feature split-finger fastballs, are already tabbed for reverse splits.
| Top 20 LHP with the Most Severe Splits, 2015 |
|---|
| Name | 2015 wOBA split prior | Career wOBA split | Career Harm PA | 2015 wOBA Split Projection |
| Randy Choate | 0.112 | 0.167 | 392 | 0.137 |
| Javier Lopez | 0.083 | 0.114 | 638 | 0.106 |
| Marc Rzepczynski | 0.078 | 0.093 | 670 | 0.093 |
| Clayton Richard | 0.062 | 0.081 | 1171 | 0.088 |
| Brian Matusz | 0.026 | 0.109 | 919 | 0.086 |
| Oliver Perez | 0.066 | 0.077 | 861 | 0.084 |
| Charlie Furbush | 0.065 | 0.084 | 518 | 0.081 |
| Christopher Rearick | 0.079 | -0.050 | 7 | 0.077 |
| Eric O’Flaherty | 0.066 | 0.070 | 576 | 0.076 |
| Dana Eveland | 0.085 | 0.030 | 630 | 0.076 |
| Brian Duensing | 0.045 | 0.086 | 1168 | 0.075 |
| Tom Layne | 0.053 | 0.145 | 149 | 0.073 |
| Cesar Cabral | 0.067 | 0.232 | 15 | 0.072 |
| T.J. House | 0.057 | 0.113 | 195 | 0.071 |
| Jake Diekman | 0.070 | 0.068 | 360 | 0.070 |
| Alex Claudio | 0.066 | 0.096 | 59 | 0.069 |
| Franklin Morales | 0.036 | 0.078 | 785 | 0.068 |
| Drew Pomeranz | 0.024 | 0.125 | 389 | 0.067 |
| Matt Grace | 0.066 | 0.087 | 29 | 0.067 |
| Derek Holland | 0.059 | 0.046 | 1214 | 0.065 |
| Top 20 LHP with the Weakest/Reverse Splits, 2015 |
|---|
| Name | 2015 wOBA split prior | Career wOBA split | Career Harm PA | 2015 wOBA Split Projection |
| James Paxton | 0.009 | -0.107 | 186 | -0.020 |
| David Huff | 0.004 | -0.020 | 756 | -0.014 |
| Alex Torres | 0.012 | -0.049 | 312 | -0.009 |
| Jake McGee | 0.023 | -0.042 | 450 | -0.007 |
| Sam Freeman | 0.033 | -0.108 | 192 | -0.004 |
| Kevin Siegrist | 0.014 | -0.043 | 227 | -0.003 |
| Mark Buehrle | 0.013 | 0.001 | 2561 | 0.000 |
| John Danks | 0.003 | 0.007 | 2107 | 0.003 |
| Neal Cotts | 0.025 | -0.023 | 424 | 0.003 |
| David Rollins | 0.005 | -0.088 | 10 | 0.003 |
| Brett Oberholtzer | 0.017 | -0.019 | 406 | 0.003 |
| Fernando Abad | 0.013 | -0.006 | 412 | 0.004 |
| Craig Breslow | 0.013 | 0.004 | 928 | 0.004 |
| Adam Wilk | 0.005 | 0.042 | 53 | 0.007 |
| Gio Gonzalez | 0.034 | -0.001 | 1710 | 0.008 |
| Cole Hamels | 0.015 | -0.007 | 2122 | 0.008 |
| Brett Anderson | 0.050 | -0.017 | 991 | 0.009 |
| Tommy Milone | 0.010 | 0.009 | 841 | 0.009 |
| Jason Vargas | 0.011 | 0.009 | 1717 | 0.009 |
| Clayton Kershaw | 0.029 | -0.001 | 1754 | 0.009 |
The 20 left-handed pitchers with the most extreme split projections have thrown only 16 percent of their innings this season as starters, while the 20 lefties with the weakest and sometimes reverse splits have logged 79 percent of their innings as starters. Note that Clayton Richard’s split projection is more extreme than either his career split or his prior for this season. His arm angle appears to have dropped in recent seasons and his career splits stands out further relative to his less sever priors of past seasons. James Paxton and Sam Freeman have had dramatically more success against right-handed batters thus far, which this model didn’t anticipate and mostly considers a fluke. These projections, however, hedge their bets and expect both pitchers to have reverse platoon splits, albeit more modest ones, going forward.
A full table of projected platoon splits can be found here.
Finally, to what extent do teams pay attention to a pitcher’s expected platoon splits when setting their lineup? To find out, I split 2015 starts by both left-handed and right-handed starters into 20 quantiles (vigintiles, that is) based on the projected platoon split of the starting pitchers. Then for each quantile I looked at the percentage of plate appearances taken by a batter who bats exclusively from the left side of the plate (in other words, I did not count switch hitters facing a right-handed pitcher as lefty batters) after removing plate appearances by pitchers and pinch hitters.
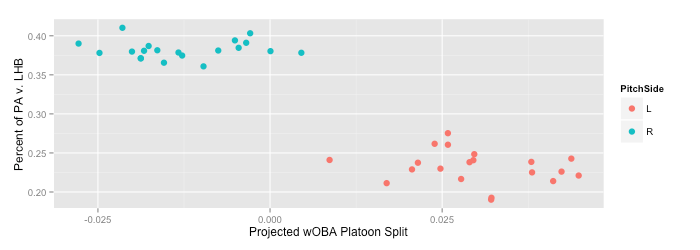
Managers, it appears, stack their lineups with more lefties when facing right-handed pitching but pay little attention to the projected platoon split of the pitcher. The right-handed pitchers projected to have reverse splits faced roughly as many left-handed batters as the right-handed pitchers with the most extreme projected splits and dramatically more left-handed batters than the left-handed pitchers with the weakest projected splits. Daily fantasy managers may well act similarly and, in either world, some advantage could be accrued by looking at more than just a pitcher’s throwing hand.
References & Resources
- Many thanks to Mitchel Lichtman for advice on this project.
- Full Arm Angle Estimates Table
- Full Projected Platoon Splits Table
- Tom Tango, Mitchel Lichtman, Andrew Dolphin, The Book
- The Hardball Times Baseball Annual 2008
- Max Marchi, The Hardball Times, “Platoon Splits 2.0”
- Brooks Baseball & Pitch Info
- Mike Fast, Baseball Prospectus, “Spinning Yarn: Pitcher Release Points”
- Dan Brooks, Glen Fleisig and Harry Pavlidis, Baseball Prospectus 2015, “Delivery Angles Determines Pitch Movement”
- Eric Seidman, FanGraphs, “When Samples Become Reliable”
This is really, really cool. I really like the quantification of how much each pitch type contributes to the split in relation to other pitch types. It really highlights the importance of throwing a change-up if you’re a lefty. A couple considerations for an updated model:
-Others have done research on platoon splits on pitches broken down into other classifications. For example, it they might differentiate between a 12-6 curve and a slurve. The next logical step seems to be to figure out splits based on pitch movement and velocity (perhaps relative to their fastball or a league average fastball). You could regress the movement/velocity rather than the pitch classification itself.
-Unless I missed it, you don’t split the pitch mix between lefty and righty batters. A guy who throws 55% FB, 30% sliders, and 15% change-ups to both handed batters will likely have different splits than a guy who only throws those sliders against same handed batters and only throws those change-ups against opposite handed hitters, but throws the same pitch mix in aggregate.
I’m not sure if either approach is constrained by data limitations, but either or both would be great next steps. Keep up the great work.
Thanks!
Since curveball and slider movement are mostly independent of arm angle, I did try including them in the model but didn’t get improved out of sample predictions as a result so I left them out. I like the idea of looking at pitch frequencies by batter handedness. My thinking about the overall pitch frequencies is that they are rough stand ins for the quality of each pitch relative to the pitcher’s other offerings. I do think there would be something to be learned by looking at how and how much different pitchers adjust their frequency depending on batter hand.
Hi : I know you mean well and have presented a vast amount of information, but I feel you have presented the reader with factoids and abstract statistics that are extremely detailed and precise without any application.
The power of observation while intense and exacting leads nowhere…..
One immediate question that comes to mind is how meaningful, in terms of results does the angle of release with a pitcher and his splits correlate with outcomes, for example is there a correlate for War? for +OPS , RA 9., etc., for more effective % of successful closes to games like Save %???
Until you provide a context for your accumulated data it seems to me that it is not useful.
In conclusion: Have you considered constructive comparison of results that puts all this information into a contextual pattern that is useful to the handicapper, the manager, the prognostigator?
Best wishes.
F.
August 14, 2015
I’m mostly using this to answer my own questions like, “How effective should I expect Eric O’Flaherty to be against lefties?” or “Should the Mets use Tyler Clippard as the closer when lefties are due up?” and to answer those questions I need estimates of these pitcher’s platoon splits.
I’ve had some long and thoughtful conversations about how useful baseball projections are in general — I’m biased but I think they’re pretty useful — but quantifying that utility is tricky and you’d need to be really specific about what you’re trying to do and how much of a benefit you get from doing it somewhat better.
Fred, the purpose of the article wasn’t to to correlate these things to absolute value. It was to correlate them to relative value, meaning lefty value minus righty value or vice versa. That doesn’t at all mean it’s not useful. For example, Jimmy Nelson came into the year with some big platoon splits. This article confirms the driving factor, considering he only really threw a sinker and slider. In order to correct the issue, would you rather see him develop a curveball or a change-up? This article says curveball. This might be a pooor examle considering Nelson actually did develop a curveball this season and it hasn’t really alleviated any platoon splits. Perhaps it’s a sample size issue, something not captured by this study like usage or movement, or maybe his curveball is just plain bad. The point is, that’s one type of purpose this work can provide to the handicapper, scout, pitching coach, fantasy baseball player, etc.
It is amazing (but not surprising at all) that managers in 2015 are not adjusting the handedness of their lineups according to the projected splits of the opposing starter. As we discussed on Twitter a few days ago, managers and scouts surely can infer pitcher true splits at least somewhat simply from observing their arm angles and repertoires. Another (large) data point in the, “Managers have no clue” meme…
Interesting article. As a Giants’ fan I’ve long had the feeling that Sergio Romo should naturally be much more effective against right-handed batters, and rather than using him as the 8th inning specialist he should be ‘platooned’ with Javier Lopez in general high-leverage situations, especially considering how many strikeouts he gets, but he’s never really been used that way.
Is there a rule of thumb/rough way to use a wOBA split to estimate component splits, i.e. babip/bb%/k%/hr%?
I don’t know. I’ll report back after I try this component by component.
“A mixed effects model suggests that we should regress a right-handed pitcher’s observed platoon splits by adding in roughly 1,670 harmonic plate appearances.”
This is a wOBA split, which most of the numbers in the article are. But to be clear, when you generate splits projections, you regress each component of a pitcher’s line (K%, BB%, HR%, etc.) by the appropriate regression point (i.e. strikeouts less, home runs more), and then roll up to wOBA at the end, right? Or do you project wOBA first and then break down into components later?
Right now, this is all wOBA all the way through. I plan to do priors component by component and regress stats to them component by component and put it together into full lines (including wOBA) but haven’t done that yet.
I don’t know but you might be better off just staying on the wOBA level. Doing it by component you may run into serious sample size issues and if you do each component independently I think you’ll run into interdependency issues as well.
Hmm… yeah, it might be better not to construct the models entirely independently since those same factors that affect K% splits are likely to affect HR/FB splits or ISO splits or whatever else. I think there would be something gained by regressing components different amounts though.
This is fantastic.
Also not sure what you mean by adding in “x harmonic PA.” Do you mean add in X PA to the harmonic mean of the player’s actual PA versus LH and RH batters?
Yes, that’s what I meant.
Is it just coincidence that for right handed pitchers there are several pitchers where the prior predicts reverse splits, but for left handed pitchers that is never the case?
Also, have you consider not just looking at wOBA but also looking at ISO? There seems to be some differences in what causes big wOBA splits versus what causes big splits in allowing hitting for power.
Really cool stuff!
Possibly just the sheer magnitude of the lefty-lefty split. To generate a true reverse-platoon a LHP would almost have to be deliberately bad against LHB.
Yeah, I think that might be it. The mean is further from 0 and there are fewer of them.
The real question is why dont any managers besides Bruce Bochy, Buck Showalter, and Bob Melvin know any of their players’ and/or pitchers’ platoon splits?