Future lefties PITCHf/x
The baseball world turns its collective focus to Anaheim, er, Los Angeles, this week for the MLB All-Star Game. Sunday night of All Star week has become a showcase for young talent from the minor leagues. The 2010 Futures Game was no exception. As has been the case for the past few years, PITCHf/x gives us a sneak preview of some of the electric stuff that may be floating to the big leagues sooner than later.
We have a whopping total of 283 pitches to look at—less than 15 per prospect for those of you keeping score at home—ranging from a 35-pitch outing all the way down to a one-pitch evening. Not a lot of data, but a total of 20 pitchers got into the game. We’ll start with the left-handed prospects today.
Background checks
Here’s a quick rundown on the five left-handed pitchers from Sunday night’s game.
| Pitcher | Team | Org. | Age | Height (in.) | Weight (lb.) | Drafted |
| Philippe-Alexandre Valiquette | World | Reds | 23 | 73 | 205 | Reds, 2004 7 |
| Alexander Torres | World | Rays | 22 | 70 | 175 | UDFA* |
| Mike Minor | US | Braves | 22 | 75 | 210 | Braves, 2009 1 |
| Zachary Britton | US | Orioles | 22 | 75 | 195 | Orioles, 2006 3 |
| Christian Friedrich | US | Rockies | 22 | 76 | 215 | Rockies, 2008 1 |
*originally signed by the Angels and sent to Tampa Bay in the Scott Kazmir trade
Focus on the heat
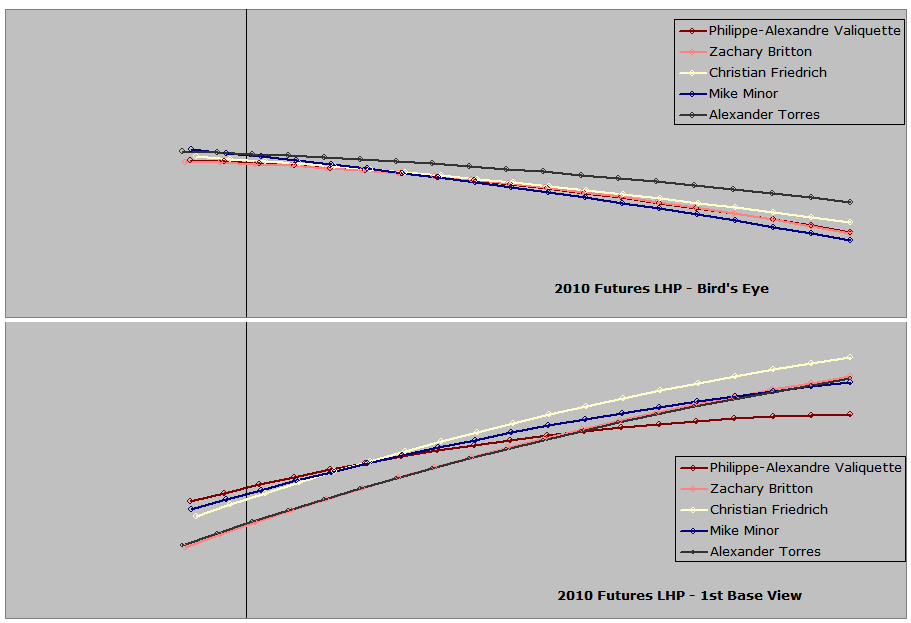
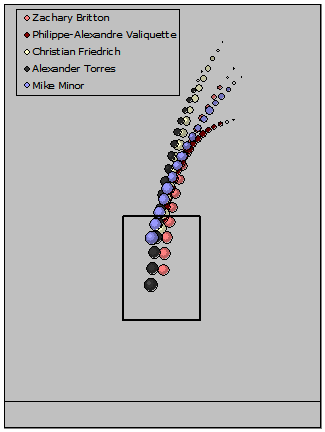
The one pitch each of these prospects threw during the Futures Game was a four-seam fastball. There were a couple of breaking balls, change-ups and sinkers on display as well. The four-seam fastball will be used to explore the release points, arm angles and plane for each. The best way I can think of to do that is with flight path charts.
Click the images for full-sized versions in a pop-up window. The bird’s eye and first base views show the average path of all fastballs thrown in the Futures Game for a given pitcher. Each of these paths is drawn from right (release) to left (plate). The duration of each flight is .45 seconds, so the longer lines are faster pitches. The second picture, the catcher’s view, is drawn to the approximate average plate location so the end points are the front of home plate, give or take a fraction of an inch.
 |
 |
There’s a nice variety of release points with these lefties. The tallest of this group is Friedrich, who threw nothing but fastballs, averaging better than 93 mph. The first base view highlights his high release and downward plane.
Torres, Britton and Minor all come from about the same height, but this requires a more over-the-top approach for Torres, as he’s listed five inches shorter than Britton and Minor. His release point comes farthest away from first base, with the ball coming from just about the middle of the mound. On video, he doesn’t look much more than high three-quarters. The other four southpaws come from the first base side, particularly Minor. Britton seems to be a little closer to center when facing left-handed batters.
Torres averaged over 95 mph with his fastball and backed it up with a change-up (86 mph) and a curveball (78). Minor was just under 94 and also threw some change-ups (84). Britton threw more sinkers (95) and sliders (85) than fastballs (95).
Valiquette, who also threw sinkers, averaged about 94 mph with both fastball varieties. Impressive—and on par for this group—but a little extra interesting coming from his low arm slot. By luck, his bird’s eye view is almost an exact overlap with Britton’s. Their plane couldn’t be more different, though. Britton is actually on plane with Torres.
League relative performance
A bit of PITCHf/x is nice, but what about actual performance? As you may have noticed above, there’s a broad range of experience—Valiquette and Torres turned pro in 2004, Minor in 2009. We’ll be looking at performance just from 2007-2010 in any minor league, but the sample size will still range from 541 batters faced to 1,832.
Strikeouts and walks (and hit batters) are relative to the number of batters faced (BF) while batted-ball types are relative to the number of batted balls (including home runs). All rates are league adjusted a la OPS+, such that 100 is average for the league the pitcher was competing in. Each point above or below 100 is one percentage point from the league average. Higher isn’t always better, it just means “more.”
| Pitcher | BF | K per BF | BB+HPB per BF | K per BB+HPB | GB | LD | FB | PU |
| Valiquette | 827 | 104 | 107 | 107 | 97 | 112 | 99 | 105 |
| Torres | 1338 | 129 | 139 | 95 | 125 | 99 | 73 | 52 |
| Minor | 541 | 149 | 85 | 138 | 96 | 103 | 104 | 105 |
| Britton | 1832 | 102 | 96 | 108 | 139 | 75 | 65 | 39 |
| Friedrich | 1012 | 153 | 97 | 169 | 96 | 109 | 99 | 111 |
First and foremost, all five strike out more opponents than the average pitcher. Valiquette and Torres issue more free passes than average but only Torres ends up with a sub-par ratio of strikeouts to walks plus hit batters. Friedrich and Minor get the most strikeouts, while Minor’s lower free pass rate still doesn’t give him a better ratio than Friedrich. Britton is quietly on the right side of average in terms of battles settled between the pitcher and the batter.
While Britton may not be noteworthy by dominating the pitcher/batter confrontation, he clearly is tough to elevate. He has lower and lower rates the higher the trajectory. This is also from the biggest sample of our group, so there may be something to his low line drive rate, too. Torres has the same pattern, not as impressively as Britton, which should help reduce the damage from his high walk rate. The rest of the group is pretty much average, with Friedrich showing another sign of a power pitcher with his high pop-up rate.
While not everyone’s favorite prospect, Minor is looking like he was worthy of the seventh overall pick in the 2009 draft. Torres and Valiquette are intriguing, but the walk rates are scary. Britton is tough to get excited about, but his apparent ability to keep the ball down is impressive. Friedrich—picked 25th overall in 2008—doesn’t look too far behind Minor. It’s too bad we didn’t get to see anything beyond his fastball, but I get the feeling we may see him in the big leagues before long. None of these guys are in their prime yet, so even the question marks could fade in the near future, and all five have something going for them.
References & Resources
PITCHf/x data from MLBAM and Sportvision. Batted ball data from MLBAM. Pitch classifications by the author.
Harry, can I just say that I love the idea of making the rate stats into an adjusted OPS-like scale of 100 average? Why haven’t I thought of that. That’s a fantastic idea and something I might take to the college ranks in some of the work I’ve been doing there.