Geographic Biases in the MLB Draft

Stephen Strasburg actually comes from the undervalued four-year category. (via Cathy T)
Historical data on the MLB Rule 4 draft makes it clear that the most domestic talent comes from the states of California, Texas, and Florida. This is without question. However, the purpose of this report is to examine where the best MLB talent comes from and if there are any inherent geographic biases in the way teams have drafted. Further, are there specific groups and types of players who are continually undervalued?
To begin, we divided players into six unique categories:
- Four-year college pitchers
- Junior college pitchers
- High school pitchers
- Four-year college position players
- Junior college position players
- High school position players
One note on these categories. When we say four-year college, we don’t mean the player in question had to attend all four years. We’re simply distinguishing between four-year colleges and junior colleges.
Using MLB draft data provided by Baseball-Reference, we broke down each of the above groups by state and found the total numbers of players selected, their average draft position, and whether or not they made it to the majors. From there, we calculated the percentage of players from each state that reached the majors, each state’s percent share of total drafted players across all states, and each state’s percent share of total major leaguers across all states.
The variable we will key in on is the difference between the percent share of players drafted and the percent share of major leaguers. In a world where teams draft perfectly, this difference would be zero. That is, in each state players of a certain subgroup are drafted in the same proportion that they are represented in the big leagues. Any deviation from zero represents an inefficiency.
For example, of all four-year college pitchers drafted, three percent were selected from South Carolina schools. We also find three percent when we examine South Carolina’s share of all four-year college pitchers who made the majors. Thus, South Carolina four-year pitchers have a “difference” of zero percent, and we conclude that these pitchers are being properly evaluated. On the other hand, California high school position players represented 23.3 percent of all high school position players drafted. Yet, 32.1 percent of all high school position players who were drafted and made it to the majors were from California. This whopping difference of -8.8 percent indicates that California high school position players historically have been severely undervalued.
Our first hypothesis was that MLB teams were not drafting enough players from the heavily populated baseball areas or baseball power states. To test this, we examined the differences between the percent share of players drafted and percent share of major leaguers for each state in all six subgroups. We then found the correlation between total players drafted from each state and that difference. A negative correlation would imply that a large negative difference, like the one we saw with California high school position players, is associated with a large number of draftees from that state.
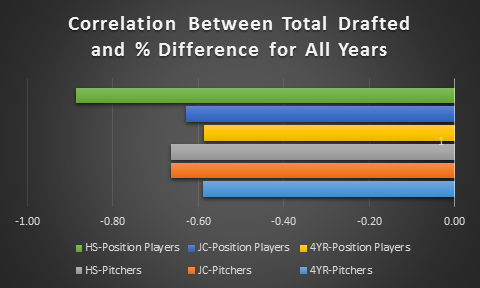
As the graph shows, there is in fact a strong negative correlation between total players drafted from a given state and the difference between the state’s share of total drafted players and its share of total drafted major leaguers. The largest negative correlation (-.89) falls with high school position players, in large part due to California (though the correlation remains strong even with California removed). There could be several underlying reasons for the undervaluing of players from states with high MLB draftee numbers, including:
- Teams overrate tools on high school position players from non-baseball power states
- Teams underrate the value of having consistent at-bats against quality competition
- Teams underrate the value of better hitting instruction in baseball power states
- Teams do not want to invest too heavily in one region
- Scouts are inefficiently allocated throughout the country
Following the conclusion that teams were not drafting enough players from baseball power states, we decided to narrow our focus to recent drafts. Was this merely a historical trend that teams had improved upon over time? To accomplish this we performed the same study, but only for players drafted between the years 2004 and 2008.
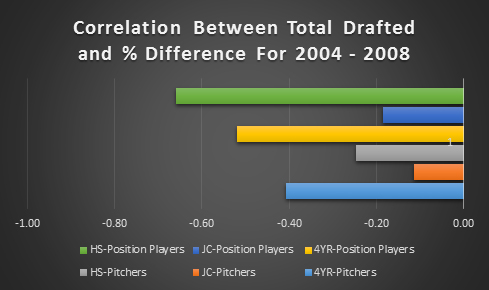
This graph shows that teams have been eliminating much of the geographic bias, particularly with junior college players and high school pitchers. However, there is still a significant amount of geographic bias in how high school position players are drafted (-.66). Over this period California high school position players also still had a significant difference of -4.8 percent.
We originally thought this bias existed primarily because of the overvaluing of the tools of high school position players from non-baseball power states. It must be considered, though, that while a plus-tools player from a non-baseball state might be less likely to make the major leagues, he may be more likely to become an impact major league player than a player with below-average tools from a baseball power state.
To look into this, we performed the same analysis, but instead of examining whether or not a player simply made it to the big leagues, we looked at whether or not they remained in The Show as a regular. This time, difference represents the percent share of players drafted from a specific state minus the percent share of MLB regulars from a specific state.
For the purpose of this study, a regular was a player who played four full seasons (150 games x four for position players and 25 appearances x four for pitchers).

When only MLB regulars are considered, the negative correlations for most of the groups sharply tilt towards zero. However, there is still a large geographic bias against baseball power states when it comes to high school position players.

Once we established this bias existed, we wanted to see what types of players from which states were specifically being over- or undervalued.
The tables below show the five most over- and undervalued types of players at each level since the creation of the draft.
| Undervalued Four-Year |
|---|
| Position | State | # Drafted | ADP | # Making MLB | % Made It | Draft Share | MLB Share | Difference |
| Pos Player | CA | 2027 | 503.0 | 305 | 15.1% | 16.8% | 20.1% | -3.3% |
| Pos Player | AZ | 356 | 404.6 | 91 | 25.6% | 3.0% | 6.0% | -3.0% |
| Pitcher | CA | 1618 | 506.0 | 278 | 17.2% | 14.7% | 16.5% | -1.8% |
| Pitcher | TX | 840 | 516.6 | 153 | 18.2% | 7.6% | 9.1% | -1.4% |
| Pitcher | LA | 392 | 525.8 | 76 | 19.4% | 3.6% | 4% | -0.9% |
| Overvalued Four-Year |
|---|
| Position | State | # Drafted | ADP | # Making MLB | % Made It | Draft Share | MLB Share | Difference |
| Pitcher | OR | 157 | 470.4 | 12 | 7.6% | 1.4% | 0.7% | 0.7% |
| Pitcher | PA | 271 | 572.0 | 29 | 10.7% | 2.5% | 1.7% | 0.7% |
| Pitcher | NY | 325 | 563.1 | 37 | 11.4% | 2.9% | 2.2% | 0.8% |
| Pos Player | NC | 509 | 557.5 | 45 | 8.8% | 4.2% | 3.0% | 1.3% |
| Pos Player | NY | 319 | 585.0 | 12 | 3.8% | 2.7% | 0.8% | 1.9% |
| Undervalued High School |
|---|
| Position | State | # Drafted | ADP | # Making MLB | % Made It | Draft Share | MLB Share | Difference |
| Pos Player | CA | 2258 | 571.1 | 296 | 13.1% | 23.3% | 32.1% | -8.8% |
| Pitcher | CA | 1478 | 596.5 | 186 | 12.6% | 19.2% | 21.3% | -2.0% |
| Pitcher | TX | 600 | 620.4 | 83 | 13.8% | 7.8% | 9.5% | -1.7% |
| Pos Player | FL | 1074 | 679.1 | 115 | 10.7% | 11.1% | 12.5% | -1.4% |
| Pitcher | LA | 118 | 617.6 | 19 | 16.1% | 1.5% | 2.2% | -0.6% |
| Overvalued High School |
|---|
| Position | State | # Drafted | ADP | # Making MLB | % Made It | Draft Share | MLB Share | Difference |
| Pos Player | MD | 122 | 672.1 | 4 | 3.3% | 1.3% | 0.4% | 0.8% |
| Pitcher | OK | 169 | 586.4 | 12 | 7.1% | 2.2% | 1.4% | 0.8% |
| Pos Player | CO | 116 | 855.7 | 3 | 2.6% | 1.2% | 0.3% | 0.9% |
| Pos Player | NJ | 231 | 567.2 | 12 | 5.2% | 2.4% | 1.3% | 1.1% |
| Pitcher | Canada | 184 | 888.0 | 11 | 6.0% | 2.4% | 1.3% | 1.1% |
| Undervalued Junior College |
|---|
| Position | State | # Drafted | ADP | # Making MLB | % Made It | Draft Share | MLB Share | Difference |
| Pitcher | CA | 1436 | 534.1 | 136 | 9.5% | 30% | 34% | -5% |
| Pos Player | CA | 1711 | 486.7 | 131 | 7.7% | 36.0% | 40.4% | -4.5% |
| Pos Player | FL | 745 | 565.3 | 60 | 8.1% | 15.7% | 18.5% | -2.9% |
| Pos Player | GA | 153 | 501.3 | 17 | 11.1% | 3.2% | 5.2% | -2.0% |
| Pitcher | CO | 45 | 548.9 | 8 | 17.8% | 1% | 2% | -1% |
| Overvalued Junior College |
|---|
| Position | State | # Drafted | ADP | # Making MLB | % Made It | Draft Share | MLB Share | Difference |
| Pitcher | CA | 1436 | 534.1 | 136 | 9.5% | 30% | 34% | -5% |
| Pitcher | GA | 124 | 540.1 | 4 | 3.2% | 3% | 1% | 2% |
| Pos Player | TN | 88 | 514.8 | 0 | 0.0% | 1.8% | 0.0% | 1.8% |
| Pitcher | WA | 212 | 540.4 | 9 | 4.3% | 4% | 2% | 2% |
| Pos Player | AZ | 232 | 567.1 | 9 | 3.9% | 4.9% | 2.8% | 2.1% |
| Pos Player | WA | 153 | 487.9 | 3 | 2.0% | 3.2% | 0.9% | 2.3% |
These tables clearly illustrate the most overvalued groups tend to come from non-baseball power states such as New York, Pennsylvania, Washington, Maryland, Colorado, and Oregon, while the undervalued groups tend to come from the baseball power states of California, Texas, and Florida. Arizona junior colleges are the one major exception to this rule.
Also notable is that teams are most efficient when drafting players from four-year colleges. The range from most overvalued to most undervalued for four-year college players was only 5.2 percent, much lower than the range for junior college players of 7.3 percent, and high school players of 9.9 percent.
We mentioned earlier that teams are getting better at eliminating the bias, but as our chart showed, there still was significant correlation between share difference and amount of players drafted from that state. The sample sizes are smaller, so there is more variability, but here are the top five most over- and undervalued types of players at each level from 2004 to 2008 (junior college is excluded because the sample size was too small).
| Undervalued Four-Year |
|---|
| Position | State | # Drafted | ADP | # Making MLB | % Made It | Draft Share | MLB Share | Difference |
| Pos Player | CA | 249 | 570.6 | 46 | 18.5% | 16.3% | 20.4% | -4.1% |
| Pos Player | AZ | 35 | 354.9 | 13 | 37.1% | 2.3% | 5.8% | -3.5% |
| Pitcher | CA | 255 | 546.6 | 51 | 20.0% | 15.5% | 18.5% | -3.1% |
| Pitcher | OH | 41 | 618.2 | 15 | 36.6% | 2.5% | 5.5% | -3.0% |
| Pos Player | TN | 56 | 576.3 | 12 | 21.4% | 3.7% | 5.3% | -1.7% |
| Overvalued Four-Year |
|---|
| Position | State | # Drafted | ADP | # Making MLB | % Made It | Draft Share | MLB Share | Difference |
| Pitcher | FL | 109 | 674.1 | 15 | 13.8% | 6.6% | 5.5% | 1.2% |
| Pitcher | OK | 49 | 694.3 | 5 | 10.2% | 3.0% | 1.8% | 1.2% |
| Pos Player | KY | 25 | 617.6 | 1 | 4.0% | 1.6% | 0.4% | 1.2% |
| Pitcher | PA | 41 | 703.5 | 1 | 2.4% | 2.5% | 0.4% | 2.1% |
| Pos Player | NY | 40 | 805.9 | 0 | 0.0% | 2.6% | 0.0% | 2.6% |
| Undervalued High School |
|---|
| Position | State | # Drafted | ADP | # Making MLB | % Made It | Draft Share | MLB Share | Difference |
| Pitcher | TX | 69 | 667.0 | 17 | 24.6% | 9.7% | 15.6% | -5.9% |
| Pos Player | CA | 149 | 752.8 | 21 | 14.1% | 18.3% | 23.1% | -4.8% |
| Pos Player | FL | 112 | 729.5 | 16 | 14.3% | 13.8% | 17.6% | -3.8% |
| Pitcher | CA | 117 | 724.0 | 21 | 18.0% | 16.5% | 19.3% | -2.8% |
| Pitcher | NJ | 23 | 909.6 | 6 | 26.1% | 3.2% | 5.5% | -2.3% |
| Overvalued High School |
|---|
| Position | State | # Drafted | ADP | # Making MLB | % Made It | Draft Share | MLB Share | Difference |
| Pitcher | PA | 13 | 856.5 | 0 | 0.0% | 1.8% | 0.0% | 1.8% |
| Pos Player | PR | 52 | 641.9 | 4 | 7.7% | 6.4% | 4.4% | 2.0% |
| Pitcher | WA | 22 | 872.5 | 1 | 4.6% | 3.1% | 0.9% | 2.2% |
| Pitcher | OK | 16 | 947.8 | 0 | 0.0% | 2.3% | 0.0% | 2.3% |
| Pitcher | Canada | 30 | 833.4 | 2 | 6.7% | 4.2% | 1.8% | 2.4% |
There is slightly more variation, with Florida four-year pitchers swinging the other way; however, the recent data remain fairly consistent with the overall findings. Again, the most overvalued groups tend to be northern or non-baseball power states, while the most undervalued are still year-round baseball power states.
Moving forward, it’s important to consider the nature of the amateur evaluation scene and how national showcase tournaments and events are organized with this data in mind.
For example, in the Area Code Games and East Coast Professional Showcase–two of the most prominent events on the summer circuit for high school players–individuals are selected by scouts to participate on teams based on their region, with only one team representing each region.
However, if significantly more players are drafted from regions such as Southern California, Texas, and Florida, and more of those players are likely to be major leaguers and impact major leaguers, teams would find further value if a greater percentage of participants in these events came from those regions.
In a given year, there likely are dozens of players from baseball power regions who are more talented than their counterparts from non-baseball power regions, but who lose the opportunity to compete in these events, in front of hundreds of scouts, due to the location of their home town.
If national showcase events over-represent players from non-baseball power states and leave potential draftees and MLB regulars off the roster, can these players left home at least expect to be noticed by their area scouts?
Through Baseball America’s scouting directory, we have mapped the location of most team’s area scouts versus the locations of successful and unsuccessful draftees. A dot represents the presence of a scout or player hailing from that town. Therefore, if several players are coming out of one school, it will still show up as one dot.

The concentration of players and scouts located in southern California makes it harder to interpret, but from the looks of it, scouts are well deployed throughout the country. Many scouts are prepared to watch and evaluate the volume of players in the power states, while fewer are in the non-baseball power states and regions like the Northeast.
California, Texas, and Florida are being undervalued, but it does not appear to be due to a lack of eyes on them. If teams are properly allocating their scouts, then something else must be accounting for the under-appreciation of these players.
As outlined above, it could be due to scouts underrating the value of facing quality competition and the lasting effects that has on players as they turn pro and work through the minor leagues. Perhaps it is these players’ more advanced approach and feel for the game that allows them to reach the majors at a higher rate. There is no doubt scouts take these things into account in their evaluations, making the true reason for this imbalance difficult to pin down.
Regardless, we have shown that there is a real, persistent bias in the draft that undervalues players from baseball power states and overvalues players from non-baseball power states. Though more scouts would help (we’re in favor of creating more baseball jobs), based on the distribution of scouts and players throughout the country we can begin to rule out lack of manpower as a reason for letting this talent go unidentified. It might be as simple as not wanting to lean too much on one region. Nevertheless, a shift needs to take place, as the imbalance is too large to ignore.
References and Resources
- Percent “difference” reflects (Drafted State/Total Drafted) – (Majors State/Total Majors)
- Draft data courtesy of Baseball-Reference
- Scouting locations courtesy of Baseball America
Impressive stuff, guys.
Good work
Couple of things
1. I think teams know where the talent is located, but they need to appease the scouts covering the barren talent areas. Almost all area scouts will get one of their guys taken in the first 10-15 rounds. Teams do this to keep the scout happy. Would it be better the team to get a marginally better 9th round pick or deal with an unhappy scout.
2. Some teams just have an obvious bias. The Tigers will always take 1 or 2 Wichita area high school kids with their last couple picks who they know won’t sign.
To filter both of these out, I would look at the data with just the first 5 (maybe 10) rounds. Teams will be more focused on talent then (cross checkers have seen most of these guys) and less on politics or preferences.
Jeff , you made me curious. What’s the attraction between the Tigers and the Wichita area?
David Chadd (VP, Amateur Scouting/Special Assistant to the GM) is from Wichita.
http://kstatesports.cstv.com/sports/m-basebl/spec-rel/051110aaa.html
Excellent article.
I wonder if anyone has attempted to develop rough “amateur league equivalencies” that would calibrate college or HS performance across regions. I can’t see how you would do this directly based on current amateur performance, but if you could compare performance at say the high A-ball level with performance over the last year or two at the amateur level, you might be able to deduce that a park/league adjusted SLG of .500 at A-ball level would come from CA high-schoolers who slugged .800 their senior year, but NY high-schoolers who slugged 1.000. This would have to be taken with a huge grain of salt, of course, but could supplement the work of the cross-checkers, especially for later-round picks.
Yes, excellent stuff. Don’t know, tho’, that 8.8% is a “whopping difference.” As the outlier, you could likely regress that toward the mean for starters. And then what does 8.8 signify as opposed to 4.8 or 12.8? ‘Biggest’ can simply mean ‘less insignificant than the others’ rather than ‘whopping’.
Thanks for the kind words. Yes, I’ll concede “whopping” may have been a bit dramatic. You hit the nail right on the head, the larger difference means we can be more sure of an inefficiency. Thanks!
I think the biggest factor driving your results is draft position, which you did not control for. Many Cali HS players are drafted high–they should have a higher rate of ML success. CA HS kids tend to require higher signing bonuses (for a variety of reason), and as a result relatively few of them sign later in the draft.
Whereas Canadian HS players for example, are generally drafted later and we should expect a below average return. They also tend to be more likely to take a reasonable signing bonus in those rounds (again for a variety of reasons), and thus teams are more likely to draft them in later rounds than an unsignable Cali HS player.
Tim,
Thanks for the read and you bring up a great point. While we didn’t include it in the article we did actually calculate the correlations between average draft position by state and % difference by state. I’ve posted them below when all the draft data is included:
4 YR College Pitchers: .15
JC Pitchers: .04
HS Pitchers: .17
4 YR Position Players: .19
JC Position Players: -.003
HS Position Players: .13
While there is a slight positive correlation it’s pretty close to 0. For High School Position Players the average draft position in Ohio (526) was actually significantly lower than that of California (571) but the difference between the share drafted out of Ohio and share of MLB players from Ohio was 0.
Is this for players drafted or players signed? Because the majority of HS players drafted late do not sign, and thus will not accrue ML time (at least as a result of this particular draft), so the results will be heavily skewed towards the higher drafted players. The correlation of interest would be between avg signed position and % difference by state.
Tim, thanks for your thoughtful comments, this is a very good point. We have excluded any player who did not sign if they were drafted again. We unfortunately did not have data on whether or not a player signed if they did not reenter the draft.
Very interesting article, though I think one extremely important factor is the draft position too. For instance, as you showed in your tables, the average draft position for California players is much higher than the average draft position for New York players (60+ draft slots). If there is a higher concentration of California players in the top few rounds, then this would skew the results.
It would be interesting to extend this analysis to be conditional on round. This would eliminate most of the difference in average draft position between different states.
I wonder if one reason some players in the baseball-rich states don’t get a better look is the perception by teams that there are no “secret weapons” to be found in those areas, e.g., if a team knows of a good kid in Miami, then they probably figure that every team drafting ahead of them does too. Whereas if they find a good kid in Omaha, they might assume they can keep that a secret until after the draft.
And yes, some teams do have regional preferences. The Braves always try to draft at least a few kids from the old TBS viewing area (Georgia/SC/eastern TN/Alabama/Florida panhandle), probably because they think this plays well with the fan base.
If that’s true, that’s a pretty depressing rationale. People don’t watch games based on where the players are from. I don’t deny, though, that the Braves do draft a lot of players from Georgia. I assumed they did it because they thought those kids would be easier to sign because the Braves think they (1) come from a more conservative/authority driven area and, therefore, less likely to hold out for more money; and (2) want to play for the team they grew up rooting for.
Reminds me of an old joke. A drunk is leaning against a lightpole looking for something on the ground. Guy asks him what he’s looking for. The drunk said he can’t find his keys. The guy asks him why he thinks he dropped them here. The drunk answers that he has no idea where he lost them, but the light is much better here.
For those interested here are the separated maps of those making the majors and those not.
https://docs.google.com/document/d/1HCZl97iAd-HVh6iLky2ttdogbWPejeXxBYIP1Rrfm9s/edit?usp=sharing
Hey Dan, good stuff. One thing that I thought you would mention, but wasn’t, was the fact that California NCAA players often aren’t able to showcase their skills because of the depth of players at these schools (UCLA, USC, Cal, Stanford, Irvine, Fullerton, etc.)
Take UCLA in 2011 for example — 3 All-Americans in Cole, Bauer, Plutko set their rotation, while their 4th/5th starter maybe was not able to showcase his abilities as well as he could have in PA, NY, etc.
My thoughts traveled the same path- a guy might be 3rd team all-conference in a California HS and barely make anyone’s radar, but if he were playing in a less-populated area would look like a beast among boys.
I wonder if some of the inefficiency might arise from teams’ propensity to gamble on raw physical attributes, notably velocity for pitchers and projectable power for position players. In contrast to developed skills, these attributes are not (or minimally) affected by climate, their distribution will tend to reflect population.
P.S. – Climate matters a lot, of course. I once knew a guy who coached baseball at Colby, but quit after a season when the outfield was never entirely free of snow.
Mr. Punch,
Thanks for the read and you bring up an excellent point. We tried to account for this by looking at MLB regulars. For instance, possibly teams were gambling on higher upside players from non baseball power regions, because while they might have lower floors and be less polished, their raw physical attributes gave them higher ceilings and a better likelihood to be an impact player.
It might be interesting to take this a step further though and create a threshold for MLB impact player that’s higher than just being an MLB regular. Deciding what qualifies as an “impact” player would be a relatively arbitrary distinction, but nevertheless could yield interesting results.