Ground Rule Doppelgangers
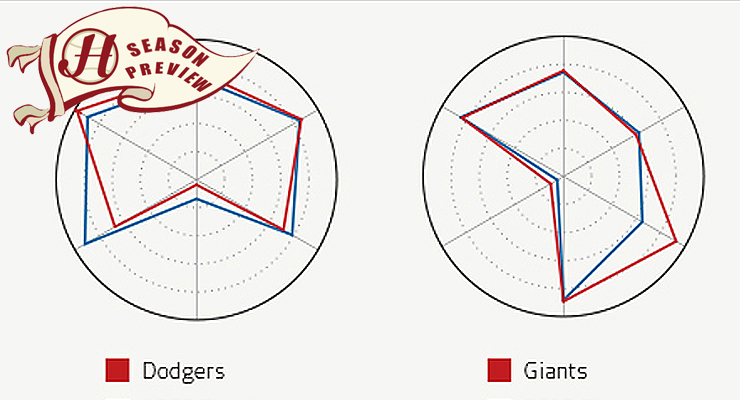
The Dodgers and Giants both resemble World Series teams. (via John LaRue & Howell Media Solutions)
At any given point during a baseball franchise’s history, a variety of factors combine to make up an organizational fingerprint. These factors indicate the organization’s past, present, and future plans as well as its recent success and potential for future success. By objectively observing these factors through recent history, we can look at the 2016 batch of major league teams and find their historical doppelgangers — similar-looking teams.
It’s worth noting that the original purpose of collecting all these data was to find a predictive model for wins and losses. The best the data could do was a nine-win standard error. In other words, what you’re about to read isn’t entirely predictive. Similarity here means that these franchises are on very comparable paths to their doppelgangers, but does not assume the same results.
First, let’s discuss the methodology. I’ve compiled six pieces of an organization’s DNA for all teams since 1988 and given them a percentile rank among all teams in the data set in each of the categories. The cut-off at 1988 keeps the data relatively current. Moreover, there are certain categories that have muddy data or no data at all prior to 1988. And since we want to compare teams to 2016-–a year in which we don’t know the pending results–-all data for these historical teams are their standing as of spring training in their given year. When you see the 1997 Indians, for instance, their figures are based on their performance in these categories from 1994 to 1996.
The first two categories pertain to the strength of the teams’ on-field results. Specifically, I have included their most recent year’s pythagorean winning percentage. And to gauge a franchise’s equilibrium, I have also included its three-year pythagorean winning percentage. From there, we want to dig into the flavor of a franchise with the next four categories.
For instance, we want to know what kind of economic resources it has. To do this, I’ve added payroll. To account for inflation, I’ve made all payroll figures relative to the league average in a team’s given year — Payroll+, if you will. We also want to know how wisely a team has spent in its most recent offseason free agent cycle. The most readily available resource for historical free agent cycles is Baseball-Reference’s yearly free agent lists, which include each free agent’s three-year total bWAR. Each team’s net bWAR3 for each free agent cycle was collected.
We also want to gauge the future–-how much young talent a team has in the minor leagues, and how much has already graduated to the big league roster. For young talent already on the major league roster, we’ll use FanGraphs to collect the WAR from the previous season for all players aged 25 and under. Baseball America’s organizational rankings help account for the young talent in the minors. For this category, we want to know how well a team has done at drafting and developing talent. Rather than including the most recent BA organizational ranking for each team, I’ve included its three year average.
Once all of this was put together, we wanted to find the historical team that best resembles the batch of 2016 teams. The first step was determining the percentile difference in each category, and adding them. Frequently, this step alone would make the doppelganger apparent. In cases where this didn’t make the doppelganger apparent, the tie-breaker was the number of categories that were similar within five percent, how many were similar within 10 percent, and how many were wildly different– 20 and 40 percent or more differences. Every doppelganger matches at least four categories within 10 percent, and most match five categories within 10 percent. In a handful of fortuitous instances, 2016 teams match with their doppelganger within 15 percent in all six categories.
Now that we’ve established the ground rules for our 2016 doppelgangers, let’s place their percentile ranks on a radar graph together so we can see where they’re similar, where they’re different, and the strength of the differences. For each graph, the red line represents the 2016 team and the blue represents its historical doppelganger.
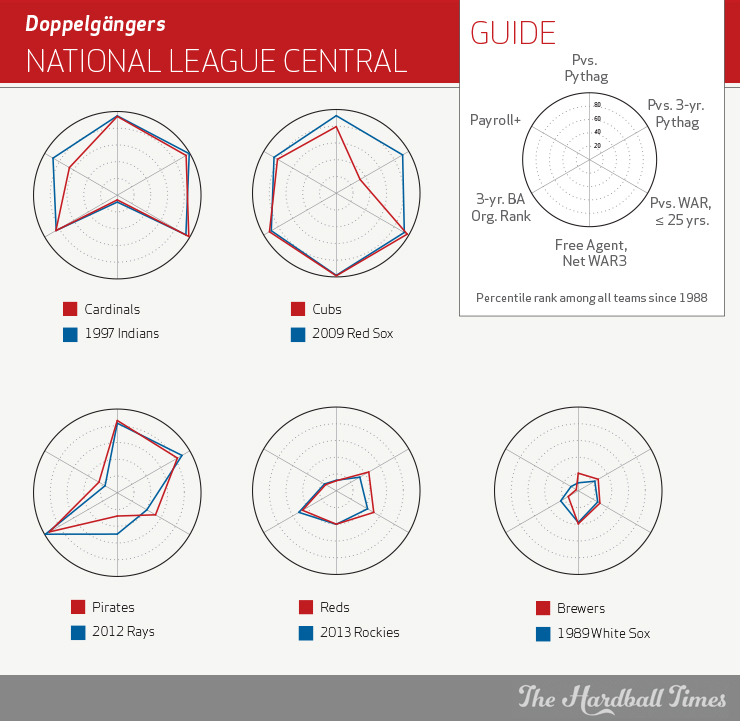
Part of this project that I’ve loved is that many of these doppelgangers make sense on a surface level. That’s the case with the Cardinals. Entering the 1997 season, the Indians had compiled a 99-win season and an impressive three-year window that included a six-game World Series loss. They also had boatloads of under-25 talent already contributing (Jim Thome, Manny Ramirez, Brian Giles and Chad Ogea) and a very solid farm system. They were in the middle of a dominant, if uncrowned, run of 1990s success. They also lost the free agent position player with the highest WAR3 (an outfielder, Albert Belle) and a productive veteran starter (Dennis Martinez) in free agency.
Exchange Jason Heyward for Belle and John Lackey for Dennis Martinez, and that description sounds a lot like the current St. Louis Cardinals. The lone categorical discrepancy is the Indians’ payroll, which swelled higher than the 2016 Cardinals. Despite a horribly disappointing offseason in St. Louis, the franchise remains in very good shape.
Similarly, the Cubs boast an eerie surface-level resemblance to their doppelganger. It would appear that Theo Epstein has imported his successful Red Sox blueprint to the Windy City, with the 2009 Red Sox edging the 1992 and 1993 Braves as the best match. The 2016 Cubs’ recent pythagorean records lag behind the 2009 Red Sox, with an ugly 2013 and 2014 dragging them down. But they’re almost a perfect match in the franchise flavor categories.
Both teams (the 2016 Cubs and 2009 Red Sox) entered their respective season with extremely large amounts of under-25 talent (this was the Sox team that had received contributions from Dustin Pedroia, Jon Lester, Jacoby Ellsbury, Jed Lowrie and Clay Buchholz). Both teams were very highly regarded by recent Baseball America rankings and had made significant free agent acquisitions. And each supported its talent with a well-above-average payroll.
Like the Rays at the dawn of the 2012 season, the 2016 Pirates had a highly successful previous season and have overcome a minor payroll to enjoy an impressive three-year run of success. Each franchise also boasts a farm system with a highly regarded three-year window of BA rankings, better than average young talent contributing at the big league level, and only middling results in free agency. Given that those Rays rattled off 90 wins, followed by 92 wins in 2013, I’m sure Pirates fans would be happy if their future transpires the same way.
The Reds needn’t go very far back in history to find their doppelganger. The 2013 Rockies had gone from contention in 2010 to bad in 2011 to downright awful in 2012. This year’s Reds have followed the same trajectory. In each case, they claim middling recent free agent results and a very average reputation for their farm system. In both cases, their payroll falls in the bottom quartile but doesn’t scrape the bottom of the barrel.

The good news for Reds fans is in the discrepancy not seen on the radar graph. Walt Jocketty has started the rebuilding effort by buttressing the farm system and potential for under-25 talent in the coming years by dealing Todd Frazier and Aroldis Chapman. The return for those two is certainly questionable, but beginning the rebuild is better than clutching to distant success the way the 2013 Rockies did.
The Brewers’ doppelganger is more objective than cosmetic, though it’s hard to argue with the similarities. Both the current Brewers and the 1989 White Sox have messy organizational fingerprints at the dawn of their respective seasons. Neither enjoyed much recent success, and neither crack the 40th percentile barrier in any one category, though both come closest in the free agent category. The hope on the horizon for the Brewers is that their 2016 BA organizational ranking should boost their future three-year average after some poor numbers the last few years. Now they need to identify their Jack McDowell, Frank Thomas and Robin Ventura. A Jason Bere and Alex Fernandez might not hurt, either.
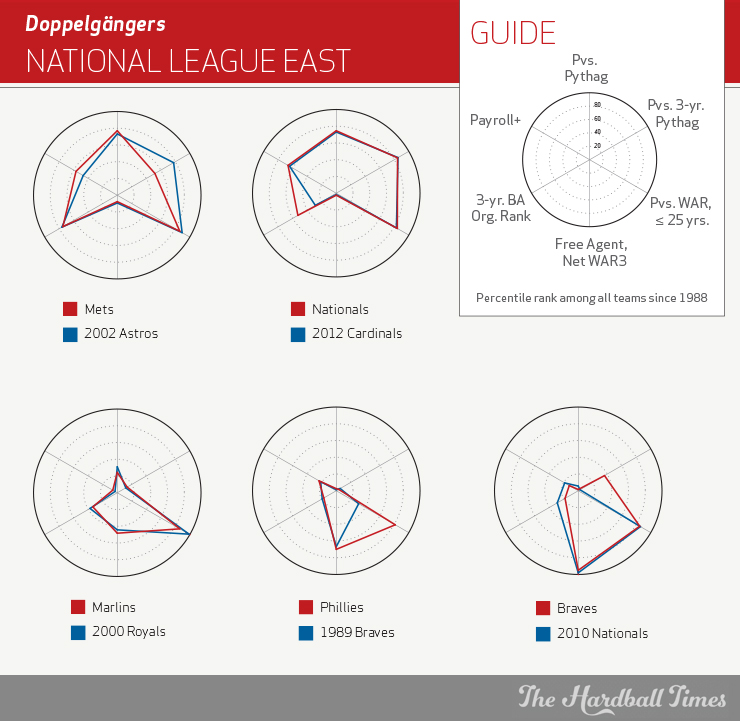
The Mets enter 2016 on a very comparable path to the 2002 Astros. Both teams had strong farm systems of recent vintage, and each team’s farm system was already starting to bear fruit at the major league level. Like those Astros, the Mets possess an average payroll with a little room to grow to augment the cheap young talent. Each team’s most recent season was solidly above average in terms of pythagorean winning percentage. Those Astros also took a hit in free agency, losing Moises Alou, deadline acquisition Pedro Astacio, and depth, just as the Mets lost mostly depth.
The difference is in franchise equilibrium– the Astros’ 1999–2001 seasons were more successful than the Mets’ from 2013 through last year. The 2002 Astros spun their position into two decent years in contention, followed by an NLCS appearance and a World Series appearance. It wouldn’t be hard to see the current iteration of the Mets following that same path or even improving upon it.
The story of the 2015 Nationals was one of high expectations and great disappointment. However, their three-year run (2013–2015) also featured one dominant season, and another season with 85+ wins. The 2012 Cardinals headed to spring training with much steadier three-year results, an out-of-the-blue World Series title in 2011, and lacking the dominant comp to the Nats’ 2014, but the overall recent strength was very much the same. And like this year’s Nats, the 2012 Cardinals bled value in free agency.
Rather than losing one big fish like their doppelganger (Pujols), the Nats accomplished their lost value with the departures of Jordan Zimmermann, Doug Fister and Denard Span. They also both possess slightly above average payrolls, and the Nats’ under-25 value is on par with the value the 2012 Cardinals had gotten a year before. The only true difference is in the prestige of the farm system. Despite the 2015 disappointment, the Nats can look to St. Louis and find hope in a team with a similar footprint.
One of my favorite doppelgangers resides in south Florida. If not for Giancarlo Stanton’s time lost to injury, the Marlins’ win total and under-25 WAR almost certainly would have mirrored that of the 2000 Kansas City Royals. And this is a doppelganger that’s intuitive. The 2000 Royals possessed the best young outfield in the game, with Carlos Beltran, Johnny Damon and Jermaine Dye, each standing in for Stanton, Christian Yelich, and Marcell Ozuna on this year’s Marlins. The Royals also had under-25 value in Jeremy Giambi and Mike Sweeney. The Marlins counter with an under-25 beast in Jose Fernandez.
Of course, neither the 2000 Royals or 2016 Marlins have seen any recent success at the major league level, and both have payrolls in the bottom 10th percentile. The Royals’ comp serves as both a testament to the young talent that the Marlins have amassed, and an ugly omen that simply acquiring a lot of impressive young talent can’t guarantee future success.
Things seem awfully hopeless in Philadelphia these days. And the fact that their doppelganger is the 1989 Braves–-a franchise at one of the lowest points of any franchise in the sample-–speaks volumes. The resulting doppelganger is owed much to their dreadful recent performances and poor organizational rankings from Baseball America. That said, the Phillies got a lot of value from the kiddie corps last year, just as we know the 1989 Braves’ youngsters corps anchored their 1990s dominance.
In fact, the Phillies are far more advanced in their rebuilding efforts than the Braves were at that stage. There’s an obvious bright side to all of this. It’s always darkest before the dawn, and that would seem to be true of the Phillies. Like those 1989 Braves, they have the payroll muscle to expand well beyond their current state, which will allow them to augment their kids as they grow.
Speaking of the Braves, they also find a doppelganger within their own division. The 2010 Nats added a lot of WAR3 depth (mediocre though it was– Jason Marquis, 85-year old Pudge Rodriguez, and a busted Chien-Ming Wang) and subtracted plenty of negative value from their roster via free agency, (Jhoulys Chacin, Bud Norris, Tyler Flowers). The 2010 Nationals also had a lot of hope on the horizon, both from under-25 major league talent (highlighted by Stephen Strasburg, Ian Desmond and Ryan Zimmerman) and a farm system that had struggled but was on the brink of adding Bryce Harper.
The Braves have shed a lot of their under-25 value in recent years (goodbye, Jason Heyward, Andrelton Simmons and Shelby Miller), but also greatly accelerated the rebuilding process by collecting some of the finest minor league talent in the game and swiping Ender Inciarte as a consolation prize. If they can complete their courtship of international prospect Kevin Maitan, they will have their Harper. Like the Phillies’, the Braves’ rebuilding effort seems to be right on time for 2017 and beyond if the fans can choke down 2016.
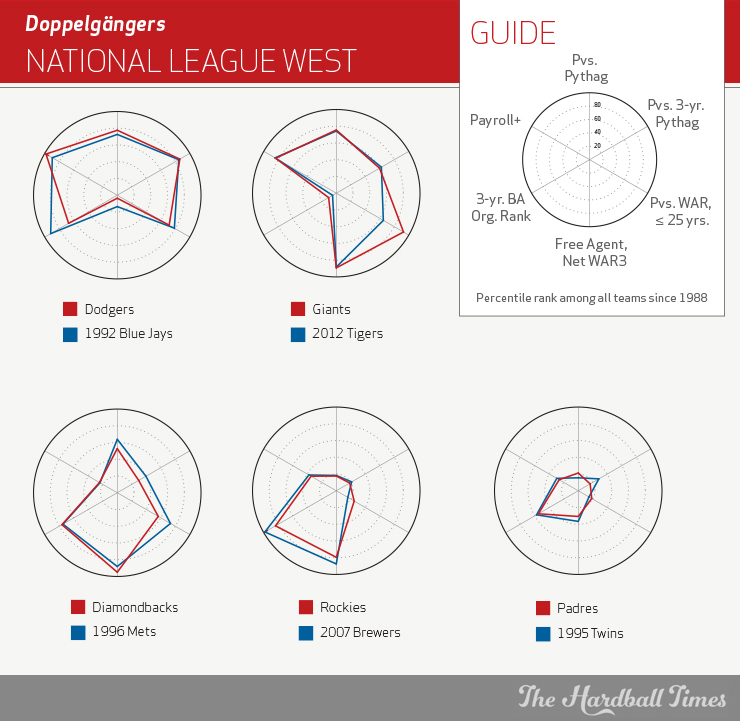
Finding a doppelganger for the Dodgers was not easy. Few historical teams have found themselves in the position of having a massive payroll, very good but not great recent results, and a lot of free agent value lost. The 1992 Jays fill the bill. What the Dodgers lack in the Jays’ organizational prestige from Baseball America, they make up in payroll. It’s hardly a perfect match, but Tom Candiotti and his 14.6 WAR3 stands in for Zack Greinke as the productive starter lost in free agency. Scott Kazmir takes the role of Jack Morris on the addition side. Both teams were perennial playoff teams with tremendous resources across the board, and the Jays found an extra gear: back-to-back titles. Such is the hope in Chavez Ravine.
The Giants’ doppelganger isn’t surprising. In recent years, two teams have consistently employed above-average payrolls and received a lot of under-25 value despite mediocre organizational rankings, each landing in October with semi-regularity. The difference between the Giants and the Tigers–-specifically the 2012 Tigers, the Giants’ doppelganger–-has been the way the Giants’ mini-dynasty seasons have ended. The Giants’ additions of Jeff Samardzija, Denard Span and Johnny Cueto echoes the 2012 Tigers’ addition of Prince Fielder and spare parts. Thankfully for Giants fans, there’s more under-25 talent at the major league level than there was in Detroit. And it’s an even year.
Arizona made a lot of noise this offseason, particularly with the free agent acquisition of Zack Greinke. And the net value of the D-backs’ free agent moves placed them in the 95th percentile of the sample, even better than their doppelganger–the 1996 Mets, who land in the 88th percentile (almost completely on the strength of adding Lance Johnson and subtracting Joe Orsulak and Bill Spiers). Both teams had been very bad in their three-year window, but took strides in the most recent season, followed by a lot of net free agent value added. The two farm systems are spot-on. The Mets took a step back in 1996 (71 wins) before arriving as an annual contender from 1997–2000. Diamondbacks fans may want a more accelerated timetable, but following the Mets’ 1996 trajectory wouldn’t be the worst thing in the world.
The Rockies’ 68-win season last year undershot their 71-win pythagorean record just a bit, while the 2007 Brewers were fresh off a season in which their 75 wins masked a pythagorean win total of 71. Neither team had a good three-year window on the field, both rank in the bottom quartile of under-25 production, but both teams made enough incremental free agent additions to land in the top 25 percent. They also carried below average payroll into their respective seasons. And while the Brewers’ farm system at the time was enjoying one of the best three-year rankings runs in the sample, the Rockies’ own three-year window has nearly kept pace. It’s somewhat grim in Colorado. But like those 2007 Brewers, there is talent below the surface.
Look into the vortex of small market mediocrity and you find the San Diego Padres. Look a little deeper into that pool and you’ll find the 1995 Minnesota Twins. Admittedly, the 1995 Twins had enjoyed slightly more recent success than the recent Padres, but the icy fingers of extended inadequacy had latched on to both franchises. Like their historical bretheren in the Great White North, the Padres’ fingerprint is bland in every category except for a Baseball America organizational ranking that just barely cracks the upper half. Escaping the vortex may take the Padres some time.

Much has been made of the recent Royals blowing their projections out of the water. Thankfully, their doppelganger is a little bit kinder as a comparison, and speaks to the overall organizational health of the Royals. By the time 1998 arrived, the Astros had spent the last six seasons above .500. They also had a relatively poor net value in the free agent market, but slightly above average showings in payroll and under-25 production. The Astros in 1998 had a bit better showing in the three-year BA organizational rankings category than the current Royals, but that’s forgivable considering the Royals’ mammoth run of success in that category for the last four seasons. The Astros, like the Royals, possessed a deep lineup with plenty of youth (five regulars with a 120 OPS+ or better, the same number as the Royals last season). And the ‘Stros used that recipe to create 102 wins in 1998.
Cleveland’s doppelganger makes perfect sense on the surface level. The 2008 Blue Jays and the recent vintage of the Indians have both resided in the fog of almost-contention. The lack of playoff berths belies the perilous position an almost-contender takes. The line between contention and annual mediocrity is razor thin. Still, both the 2008 Jays and the current iteration of the Indians carried very healthy footprints into their seasons. Cleveland’s under-25 production bolsters the roster, and the Indians found reasonable free agent value. They’ll likely need to add payroll in the future or enhance their farm system to hold on to their position or move forward, lest they end up like… well, the 2009–2014 Jays.
The Great Twins Revival of 2015 (or… return to .500) leads the 2016 team directly to a twin pairing with another revived franchise–the 2008 Diamondbacks. This pairing is made possible by the 2007 Diamondbacks’ extreme gap between their actual and pythagorean win totals. In both cases, the overall profile is somewhat bland except for extremely strong percentiles in the Baseball America organizational rank category (both fall in the 92nd percentile). Instead of names like Justin Upton, Stephen Drew, Max Scherzer and Chris Young, the Twins counter with Miguel Sano, Byron Buxton, Jose Berrios, Max Kepler and Nick Gordon. By 2009 and 2010, the D-backs’ WAR from the 25 and under crew had exploded. I suspect we’ll see a similar path for the Twins.
The White Sox were one of the most difficult teams to pair. Something about their profile is unique, much in the way that limburger cheese is unique. Their strength in relation to their doppelganger- the 2001 Cubs–foreshadows better days ahead, as the Cubs were firmly in contention in three of the next four years. It’s especially true in the farm system rankings, where the the Pale Hose boast a percentile rank twice as strong as their doppelganger. The problem here is that their other doppelgangers are far less flattering. The 2008 O’s were just barely on the outside looking in, and nobody wants to see an immediate future that looks like that squad’s.
On the precipice of the 2002 season, the Mets were bolstered by a big payroll and coming off a run of recent success that ended in a 2001 tailspin. With little on the farm and a scarcity of youth at the big league level, they attempted to re-open their window by signing Roger Cedeno and Pedro Astacio, among others. Enter the 2016 Detroit Tigers, a team with a similar tale. While the 2002 Mets were unsuccessful in their attempt to defibrillate a corpse for several years, the Tigers are in slightly better shape. Jordan Zimmermann and Justin Upton are no Pedro Astacio and Roger Cedeno, after all. And Tiger fans can take a little comfort in that.

The 2016 Blue Jays ‘closest organization, the 2015 Orioles, only tells part of the story. Of the 13 closest comps to the Blue Jays, 12 were teams with a prior year playoff appearance that failed to return. The 13th team was the 1994 Giants, who had won 103 games but still missed the playoffs in 1993 before the Wild Card existed, and were headed down a very ugly path of their own in 1994 before the strike. The average drop-off for those 13 teams (prorating the 1994 Giants’ record) is a whopping 17.6 wins. Six of them declined by more than 20 wins, none actually increased their win total, and all but one decreased by nine wins or more. This is not a good sign for the Jays.
Finding a pair for teams with huge payrolls like the Yankees represents something of a problem. One category– payroll– is already limited by a severe outlier. The 2013 Dodgers emerged as a reasonable option. Neither franchise could spin their large payrolls into the top quartile for recent pythagorean records or three-year pythagorean records. In fact, they barely cross the 50th percentile for three-year pythagorean record. The Yankees have a slightly more productive batch of under-25 players and BA takes a kinder view of their farm system than the Dodgers’ entering 2013. The Yankees had an uneventful free agent cycle, while the 2013 Dodgers gained Zack Greinke and lost Shane Victorino. From 2013 on, the Dodgers payroll actually found another gear. And while the spending certainly wasn’t the only reason, the Dodgers found more wins from 2013–2015. The Yankees are hoping that a combination of youth and potential to add payroll can help them do the same. Or they’ll just wait for the huge 2018 free agent class and lap the field.
The Orioles provided the most fascinating set of doppelgangers. The 2005 White Sox are the best match–-the only category stronger than a 10 percent difference is their BA three-year organizational rank. But there were 10 to 15 other teams that would have served as acceptable doppelgangers for the O’s, by far the most of any 2016 team. Adding to the O’s intrigue, the list of their 15 most comparable teams includes two teams who would go on to win the World Series, three defending World Series champs, one defending pennant winner, and two LCS participants from the previous season.
That is a really strange and highly successful mix for a team fresh off of a .500 finish, a poor off-season, and average payroll. The Orioles’ three-year pythagorean run has been mildly successful, and their under-25 talent is not without its merits (See also Machado, Manuel Arturo). Somehow, multiple teams since 1988 have turned that recipe into October success. It remains to be seen if the O’s can do the same.
As with the Yankees, the Red Sox payroll complicates the search for their doppelganger–-especially considering their mediocre performance within their three-year window. The closest match, the 2006 Cubs, doesn’t hit the payroll comparison but those Cubs do satisfy four of the six categories. In addition to payroll, the outlier between the two is under-25 production, where the Sox outperform those Cubs.
Regardless of their doppelganger, the future direction of the Red Sox is going to be a fascinating case study because they’ll be transitioning from one front office stalwart–Theo Epstein and his disciple, Ben Cherington–to another, Dave Dombrowski, with a very different personnel philosophy. For what it’s worth, the 2006 Cubs endured one more ugly season before rebounding with back-to-back division titles.
The Rays’ doppelganger is the 1988 White Sox. You may recall that the Brewers lined up best with the 1989 White Sox. If you’re the president of the Dan Pasqua or Larry Himes Fan Club, that will probably make you smile. If you’re a Rays fan, it has to terrify you a bit to think that a bad year can turn your scrappy, overachieving small market miracle into the malaise of the recent Milwaukee Brewers. The Rays’ three-year pythagorean run is notably better than the 1988 White Sox, but every other category is spot-on.
The jump from 1988 from 1989 for the White Sox shows a serious decline in under-25 production and BA organizational prestige, a franchise in transition from one cycle of prospects and awaiting the next round (which became Frank Thomas, Robin Ventura, Alex Fernandez, Jason Ber, and Jack McDowell). The Rays’ farm system has been increasing in stature each of the last few years and placed several players in the most recent Baseball America top 100. Barring unforeseen circumstances, they should be able to avoid the fate of Dan Pasqua and his peers.
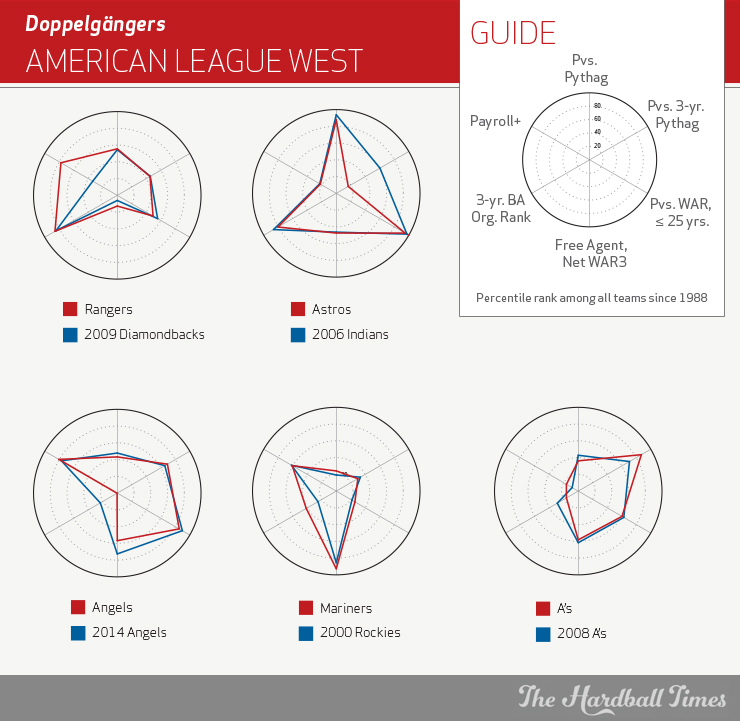
The Rangers match up with the 2009 Diamondbacks within two percent in three of the six categories, and within seven percent in five categories. They are an incredibly tight pair. The wild difference is payroll, with the Rangers’ percentile registering a whopping 44 percent higher than the 2009 D-backs. Of course, the other difference is that the arrow was pointing down in Arizona. The D-backs had just shed eight wins from 2007 to 2008 leading to 2009. The Rangers, on the other hand, leapt forward by 21 wins from 2014 to 2015. The arrow is very much pointing up.
That their farm system is comparable to the 2009 Diamondbacks is good news for the Rangers, as the D-backs turned that batch of kids into modest success in the coming years with a helping hand coming from their under-25 crew. Throw in a greater payroll to support the kids and suddenly both the present and future is bright in Arlington.
Another area of Texas where the future is bright is in Houston, where the Astros rank in the 94th percentile for under-25 value and 80th percentile for BA organizational prestige. Despite a three-year pythagorean percentile weighed down by a dreadful 2013 and 2014, this pairs the Astros up with the 2006 Indians.
The Indians went through a similar trajectory, with an ugly 2003, modest improvement in 2004, and finally a playoff-worthy season in 2005 (they missed the Wild Card by two games despite 93 wins). Their actual record in 2006 (78 wins) underperformed their pythagorean record by 11 wins, short-circuiting a promising season. Then they pushed the ALCS to seven games before bowing out in 2007, underperformed again in 2008, and finally sank back to mediocrity. The Astros have so much young talent that it would take a tremendous run of bad luck for the end of their story to match the 2006 Indians.
The Angels provide the most boring doppelganger among 2016 teams. I’d love to tell you that they line up best with a unique historical team, but the reality is that the most similar franchise to the 2016 Angels (by far) is the 2014 Angels. In fact, if not for the decline in the already weak farm system and a slightly worse free agent cycle, the 2016 Angels would be in the exact same position–within five percent in each category–as their 2014 iteration. Part of this is the fact that the Angels can count on Mike Trout to provide tremendous under-25 value for at least two more years (until he’s older than 25). The payroll should remain in the top quartile, which should theoretically keep the free agent pipeline open. If you have to be stuck in a franchise rut, you can do much worse than one in which you hit 85 to 90 wins most years.
The Mariners didn’t make a big splash in free agency, but they did manage several incremental improvements. The same was true of the 2000 Colorado Rockies. It’s not often that Brent Mayne and Tom Goodwin represent upgrades, but that was the reality for the 2000 Rockies. The same can be said for Nori Aoki and Chris Iannetta. Their payroll is spot-on with the 2000 Rockies as slightly above average, and therefore not a weakness. And these Mariners have a little more talent on the horizon, bringing in a three-year Baseball America rank a tick better than the Rockies.
That said, the M’s are floating in the ether much the same way the Rockies were around 2000, stuck in neutral and grasping for a plan. The direction Jerry DiPoto takes the Mariners in the coming years will say a lot.
That the 2016 A’s doppelganger is the 2008 A’s speaks volumes to the stability of the franchise under Billy Beane. In fact, if you look at most years since at least 2004, you see very similar footprints from year to year for the A’s. The average A’s team includes a small payroll, steady and occasionally very good production from under-25 players, a farm system consistently ranked in the 25th to 50th percentile, and a lot of free agent cycles where value is found despite the low payroll. With the 2016 A’s lining up to the 2008 A’s, the indication is that the A’s are at the bottom of their cycle, loading up for their next run in a few years. You can almost set your watch to it.
References & Resources
- FanGraphs
- Baseball America
- Baseball-Reference
- USA Today Payroll Database
This is way beyond cool.
This is terrific. Great approach and great graphics. I’m a little confused by the free agent rankings, however. When you say “net” free agent WAR, do you mean free agents gained vs. free agents lost? Is this why the Indians rank so highly, despite a relatively mild offseason?
To clarify, it’s the collective WAR3 from all free agents gained, minus the collective WAR3 from free agents lost.
I will admit that this is a little bit of a dodgy step for a handful of reasons- one that probably requires some refinement. For instance, it seems like the earlier free agents logs aren’t as complete.
Also, you end up with teams adding players who contribute -.3 WAR over a 3 year span, but it’s collected over 50 at bats or something 3 years prior. It impacts their net WAR3 but bigger picture, it means almost nothing.
And then there’s an age component. For instance, leading into 2011, the White Sox lost Manny Ramirez at age 40 and his 8.9 WAR3 (total WAR from 2008 to 2010), which went to the Rays. That’s a respectable WAR3 but it obviously was amassed in years 1 and 2 and meant little for his 5 games in Tampa.
For future versions of this, it’s definitely something I’d like to refine. The current use is great at identifying the very top end (say, this year’s Cubs) and the very bottom end (this year’s Cardinals), but there’s a lot of muddy gray area in the middle.
One other thing, by the way. I’m slightly color blind, and I have a tough time differentiating dark red vs. dark blue, particularly on an off-white background. I know some designers like darker colors as well as lines with otherwise similar characteristics (width, etc.) but they make the graphic harder to see for some of us.
Thanks for the tip. I can play around with different color combos to make it a little more 508-friendly moving forward.
if you hadn’t thought of it already, you can also used dashed vs solid.
This is on me, Studes. I noted it, but forgot to bring it up to John.