Maybe Players Aren’t Aging Differently After All
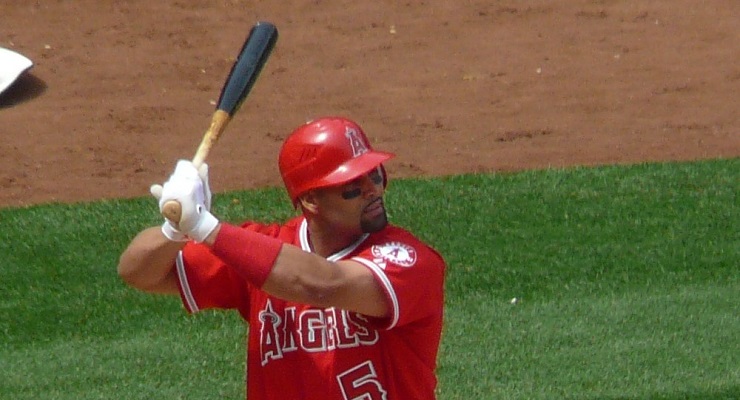
Albert Pujols isn’t as good as he was in St. Louis, but he has aged relatively well. (via Marianne O’Leary)
In 2013 Jeff Zimmerman published a fascinating article that found current players are peaking earlier than in prior eras, and players in the “steroid era” declined more slowly than in prior eras. Ever since I read Jeff’s piece I have wondered how the ebb and flow of the overall talent level in the majors might confound aging analyses.
The bumper crop of rookie stars in 2015 certainly has been a topic of discussion, and I hear those Mike Trout and Bryce Harper fellows are still pretty good. Is this much young talent historically unusual, and if so, is it possibly causing other players to appear to decline faster?
But it’s not just young players thriving in unprecedented quantity and magnitude. There also has been an influx of international veterans in recent years, and many have succeeded in the majors immediately. Is that having an effect on aging calculations? Conversely, in periods of expansion, is it possible talent didn’t keep up with the sudden increase in available roster slots?
To me, it seems these ebbs and flows of talent must have an impact on the perceived aging of returning players. As a thought experiment, imagine I played in a corporate basketball league made up of 30- and 40-something desk jockeys. If LeBron James joined my hypothetical league next year, it would make me look worse in two ways: directly by decreasing my numbers in the games my team plays against his, and indirectly by raising the league average I’m compared against. This would happen even if my talent compared to the pre-LeBron average was unchanged.
Unlike my hypothetical basketball league, major league baseball is probably too big for an aging analysis to be affected materially by any one player. But in aggregate, I do think expansion, demographic trends, and changes in international player flows can add up to something significant.
To try to isolate the effects of major league talent changes from pure physical aging when going from year Y to Y+1, we need to control for as many variables as possible. Like Jeff, I will use the delta method, as described by Tom Tango and MGL here and here (as well as other online sources). To deal with the issue of survivor bias, I will remove each hitter’s final season from consideration. Note that since I’m working with Retrosheet and Lahman data, which are complete through 2014, my analysis stops at 2013. This also conveniently mirrors Jeff’s work.
Using wRC+ as the target metric, as Jeff did, is a great start for controlling the range of possible variables since it adjusts for park and the league scoring environment. But in its standard form, it doesn’t control for (a) changes in the pitcher population, like Yu Darvish entering the league in 2012, or (b) changes to the batter population that won’t show up in an aging analysis but will affect “league average,” like Jose Abreu in 2014.
The delta method implicitly requires that for each two-year pair, all the sampled batters appear in both seasons. One looks at the difference between each hitter’s performance in the two years and takes a weighted average. To deal with changing pitcher populations, I will add the additional constraint of comparing each hitter’s performance over two years against the same pitcher. So to take the example of Darvish, his 2012 performance won’t count at all when we look at 2011-12, but it will count for 2012-13.
To address the year-to-year variation in league average, I will use a modification of wRC+. A full explanation of wRC+ can be found at Fangraphs. For this analysis, I calculated it the same way, but with two small tweaks. The first tweak is that, instead of comparing to “league average,” each player is compared to the average of only those batters sampled in this aging analysis (by year pair). So, for example, if I was looking at 2013-2014, the average of hitters for 2014 would exclude Abreu since he is not in the 2013-14 delta calculation.
One problem with fixing the pitcher population for the delta analysis is if pitchers decline only with age (and, generally speaking, they do), then restricting my comparison to the same batter-pitcher pair creates a bias. Some hitters will be improving from year to year and some will be declining, but pitchers will only be declining, and thus, on averag,e hitters’ second-year performance will be inflated. Which brings up the second tweak: an adjustment for pitcher aging.
To calculate the pitcher aging adjustment, I randomly split the set of qualified pitchers into training and test samples of equal size. With the training sample, I calculated a wRC+ aging curve for pitchers using the same method I described for hitters (without a hitter-aging adjustment). This aging curve establishes the pitcher aging adjustments for the batter aging analysis. I then used the test sample of pitchers to compute the batter aging curves.
With all of that background out of the way, here are the results for 2006-13:
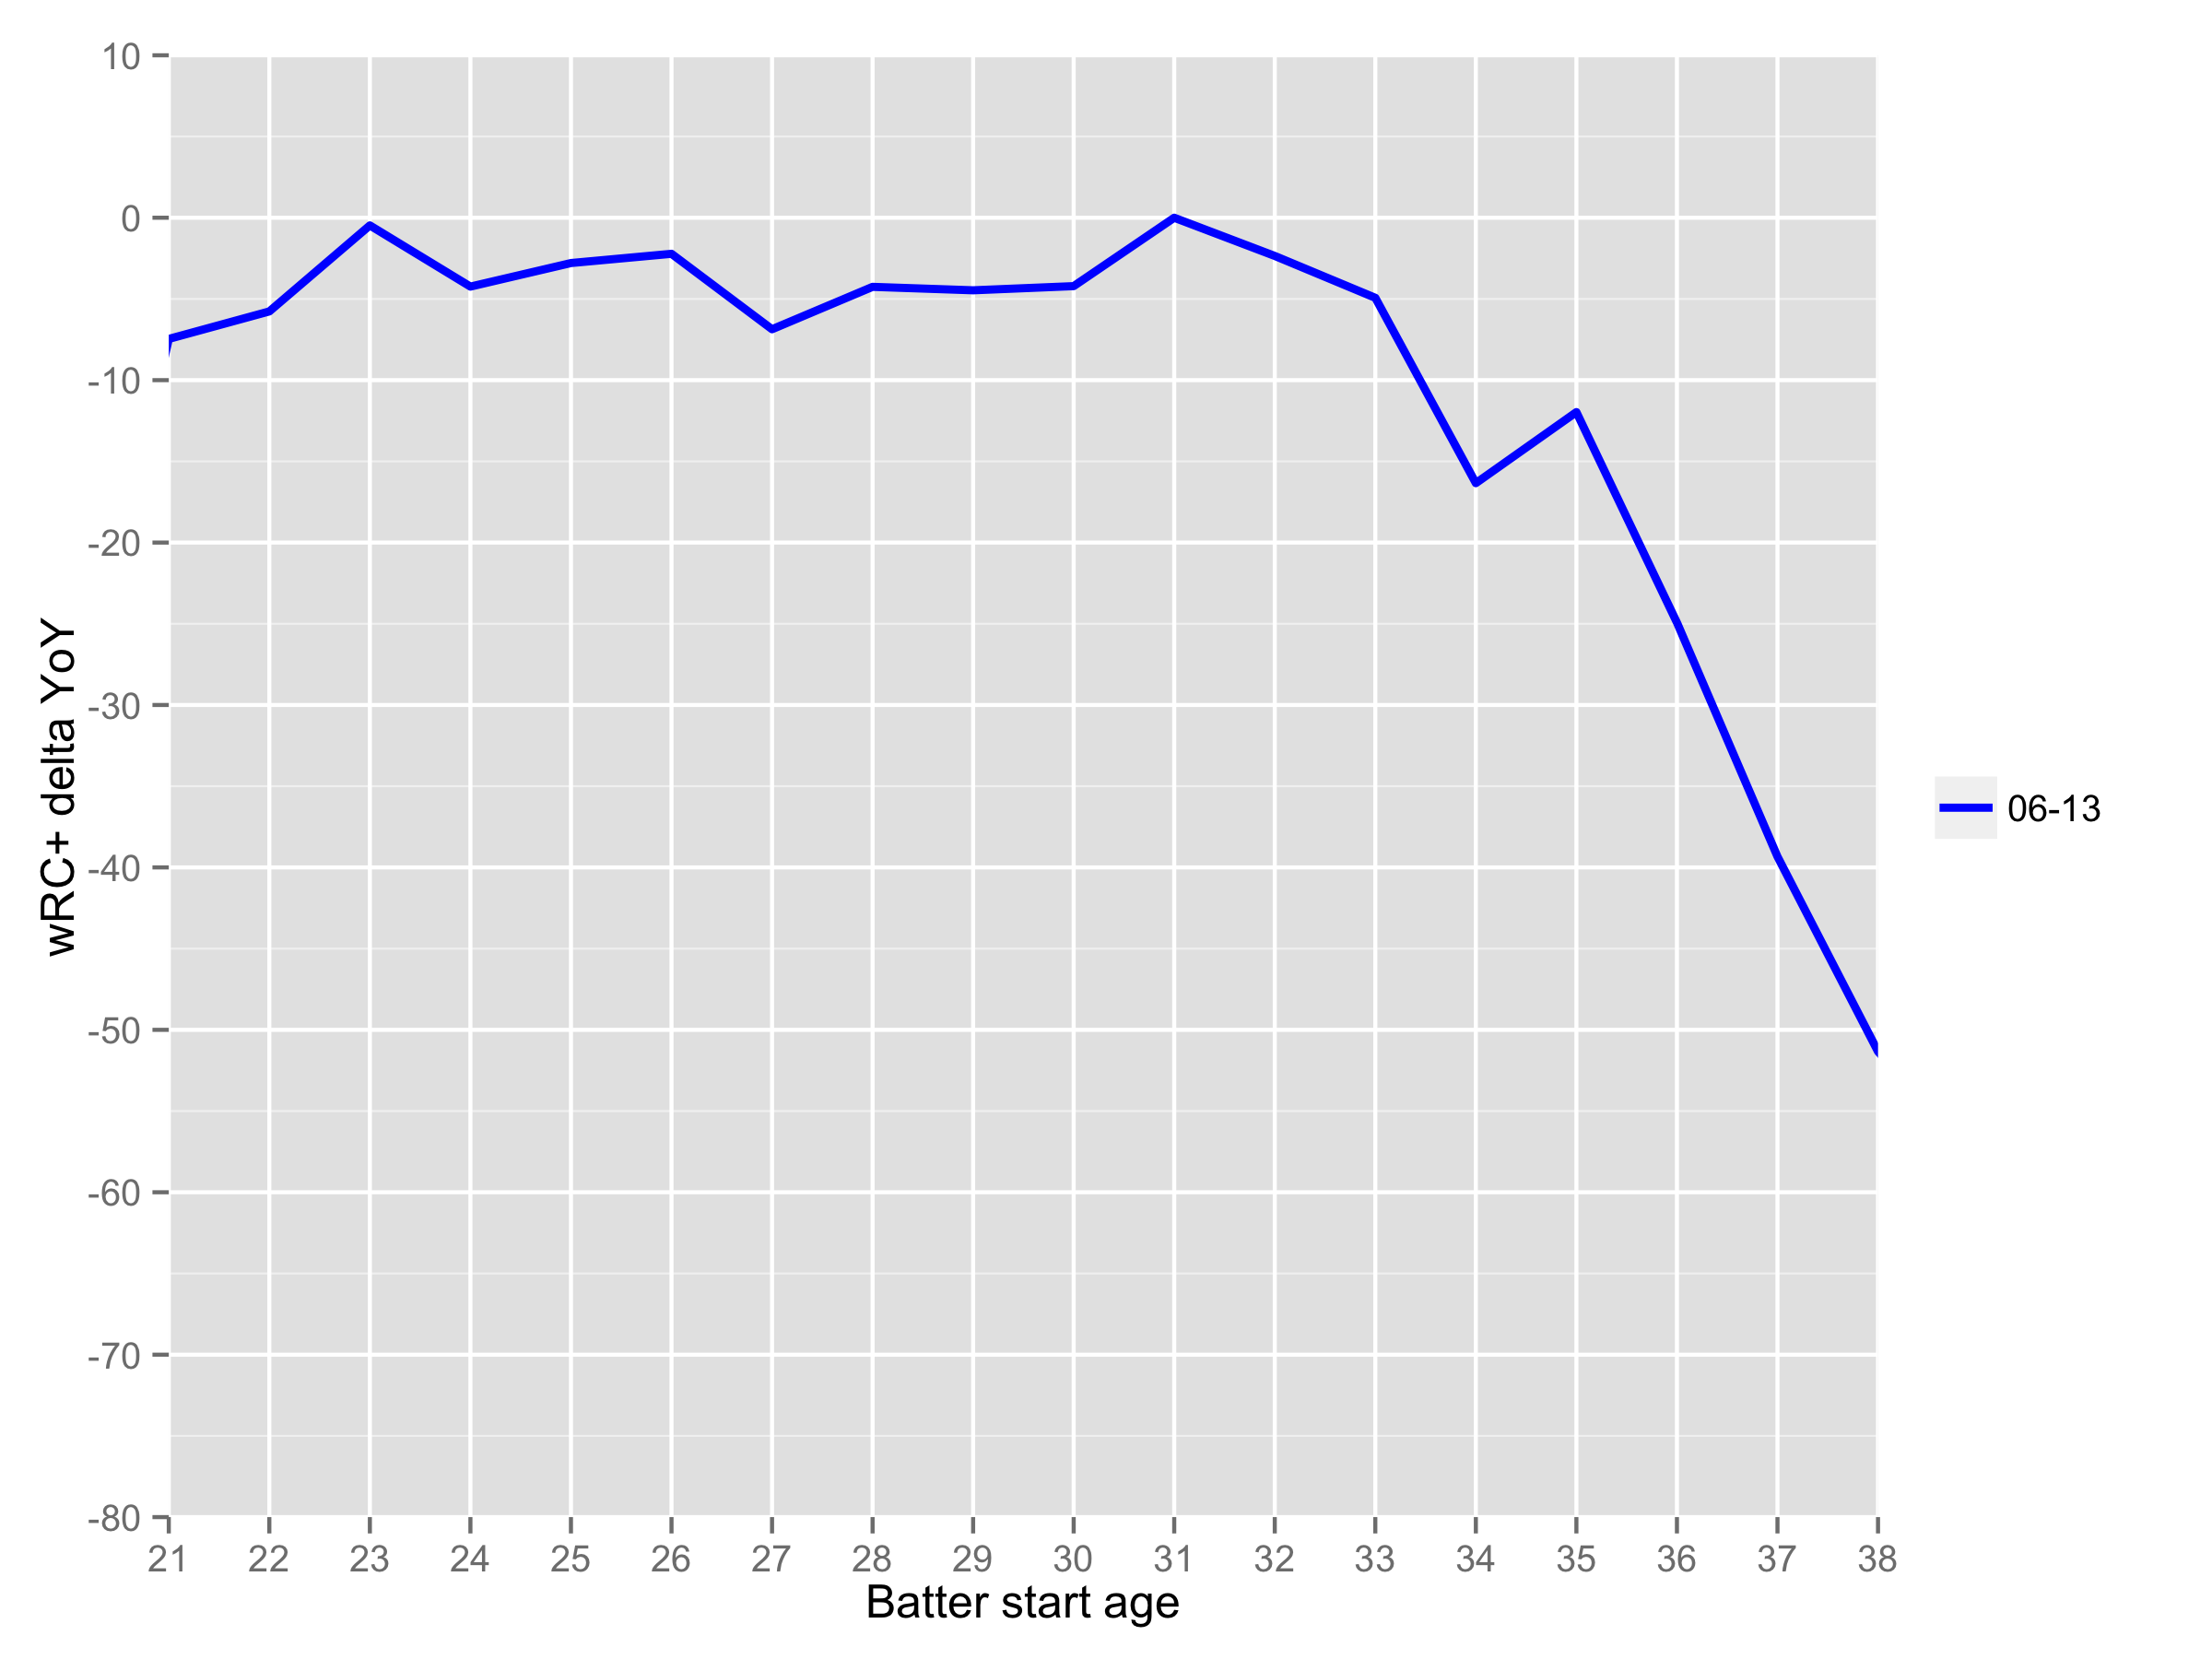
(Note that I’m showing the curve only from ages 21 to 38 because of tiny samples outside those bounds, but the underlying analysis contains no restriction on age. Limiting the age range can introduce another form of bias that Tango already described better than I can.)
Overall, it looks somewhat similar to what Jeff found: Players peak early, then plateau. The data is quite visibly a bit noisy, because the sample size of this method is smaller than the typical aging analysis, and on top of that we’re looking at only seven years of data, but it certainly doesn’t contradict the idea that players are peaking earlier now.

For comparison, let’s add 1991-2005:

These two lines do a lot of crisscrossing of each other, which means you can start to see the problem with the conclusion that players are peaking earlier: These lines might be meaningfully different, or the difference might just be noise. Adding error bands will help clear things up:

The dark grey band is where the standard errors of the two lines overlap. Note there is no point along the curve where they don’t overlap. In other words, these lines are (statistically) indistinguishable. So while under the standard view of aging it appeared hitters were peaking very late during the “steroid era” and post-2005 a different aging trend prevails, this alternate view says hitters basically have been aging the same way for the last 25 years.
That’s not to say PEDs had no effect (a variety of evidence and common sense suggest they could have), but whatever effect they had probably benefited hitters of all ages uniformly (more or less) and any unusually “slow decline” compared to recent history probably had more to do with the two rounds of expansion in quick succession in 1993 and 1998.
Because it’s easy to do once the framework is established, let’s add 1976-1990:

This curve does look distinctly different from the other two: The peak arrives around the same age as in later periods, but the plateau is shorter with a steeper decline. This seems fairly intuitive, as it covers a period of perceived advancement in medical and surgical techniques, such as the mainstreaming of arthroscopic surgery arising from advances in flexible fiber optics.
Let’s add 1961-1975, because why not:

It’s very similar to 1976-1990, at least before the 35+ range where sample size begins to decline significantly. If I had to draw any conclusions from that, I’d say it’s that medical advancements in the 70s and 80s made a significant difference to how players age, and that’s about it. But I’m hardly an expert on how things like nutrition, training, smoking, etc. have changed over those periods, so take that inference with a baseball-sized grain of salt.
Finally, on the assumption that ’61-’75 is similar to ’76-’90, and that ’91-’05 is similar to ’06-’13, let’s reduce this analysis to just two periods, 1961-1990 and 1991-2013, with standard errors for each:

There is more data underlying each of these curves, and thus tighter bands of uncertainty. Now there is a clear distinction between these two aging curves starting around age 30 or 31, which has intuitive appeal: It suggests players really are aging differently today from the days of cigarettes in the dugout and battlefield amputations (or whatever they did to treat torn ligaments back then), even if they aren’t aging all that differently today from the days of andro and accusations.
To be perfectly clear, although I think there is some meaning to be taken from these graphs, all I’m really suggesting is that physical aging can be evaluated separately from changes in league talent levels, and there may be good reasons to do so. For example, if you think expansion is around the corner and the recent inflow of international veterans and young stars is an aberration, you might take a more generous view of how the major league baseball will change over a free agent’s contract.
Conversely, if you think there are long-term demographic trends driving higher levels of young talent and we won’t be seeing expansion any time soon, you would probably take a more conservative view on aging. A framework like this one that separates changes in overall talent from what we think of as “aging” provides a straightforward method for doing so: Just adjust the future league average up or down in the wRCx calculation.
What I’m not suggesting is my approach here is the “right” way to look at batter aging, or that other methods are “wrong.” Aging is a very complicated subject, and the “right” approach is probably to develop a mosaic from as many reasonable methods as possible, including, perhaps, this method.
References & Resources
- I’d like to thank MGL for his very helpful comments on an initial iteration of this methodology
- The original inspiration for this article, from Jeff Zimmerman
- Very helpful discussion of aging from Tom Tango
- Also check out a great two-parter from MGL
Great article, Peter!
Pardon my ignorance, but what is ebb?
Ebb is when the tide goes out – in this context, Ebb and Flow in talent means decreases and increases in talent
Good work, very interesting. An anecdotal point on the shift in late-career patterns: I believe that when Dave Winfield came back in 1990 after missing the entire previous season, it was the first such successful return ever for a player over 35.
Great article, I have always wondered how increase in talent/physical improvements affect the aging curve. I have generally believed that it isn’t so amazing that pitchers like Ryan, and Johnson or even Moyer weere productive at older ages, but more impressive that they were good against a newer generation of talent. Using the timing of expansion to highlight this is an interesting and insightful approach.
Interesting article. I have long thought that the talent level of MLB is getting better and better because of international players and the lack of expansion. The only thing to drag it down would be a decrease in desire among young boys to be baseball players.
I also have believed that. However, I am starting to believe the talent level may have peaked at the turn of the century and that we are seeing it trend the other way, especially for position players. Steroid testing has likely had a disproportionate affect on the international players (due to the availability), and conditions in the minors (poverty wages for years) may be turning more potential players away from the game. About 1/2 of the leagues domestic WAR historically has come from picks after round 5, and such players, especially at the college level may now be unsignable due to the need to pay off college debts as there is not much bonus money in the latter rounds.
Of course this perception contrasts with stars like Harper and Trout coming into the league, but both were first round picks with healthy bonuses, bonuses which are now being suppressed
Re: ” The only thing to drag it down would be a decrease in desire among young boys to be baseball players.”
My son enjoyed Little league but doesn’t have the attention span to sit and watch a ballgame on television. I blame the internet. And smart phones.
OTOH, football is not exactly the sport parents are pushing these days, so we may see more guys like Willie Wilson and Carl Crawford who turned down college football for minor league contracts.
And on the third hand, soccer is rising in popularity in the US, which we have been reading since the 70’s.
Interesting! One thing that pundits never bring up is the increase in the number of baseball teams, but the number of pro sports in general which HAVE to pull overall talent from baseball, and dilute the overall quality of athletes. People like to talk about the inclusion of Black players (are they inherently superior players?) as well as Latin American talent. But in spite of these influxes, the popularity of pro football, basketball, tennis, soccer, and even golf has competed, and in fact drawn many athletes away from baseball. Put another way, the number of pro athletes, and the available “slots” as increased faster than the general population of the US since (let’s say, 1965). In spite of the usual babble about athletes being “bigger, faster, stronger”, the human race has NOT evolved. Medical science has, year round training without question, and the ever present PEDS, which I’m convinced showed up in MLB in the late 1970’s at the latest.
I find the PED issue to be infuriating because not only does it effectively force marginal players to take them, or take a “job”, but whereas 400 homers usually would be Hall worthy, now you better have 400 steals, and better hope that the defensive metrics like your play. But I digress, you wrote a very informative article, one that would seem to put a slam-dunk on those who still speak of PEDs as “not a big deal”, and you gave much deserved kudos to the medical community who saved many thousand “career years”. Sorry, but I couldn’t stay off the PED soapbox….. Thanks for your research!
Over the years, I’ve seen and heard it stated many times that “expansion” has only a negative effect on the overall MLB talent level and significantly dilutes the level of play of the current time periods game. Often the 1962 Mets are pointed to as the prime example for this proposition. This negative view of expansion has been repeated so many times over the years that, for the most part, it appears to be accepted as true.
While this article only hints at a negative “expansion” effect on talent, I want to state what I think is often overlooked by those making the assumption that MLB talent is less now than before periods of expansion. Assuming modern MLB begins in 1903, all you need to do is look at the US population numbers from 1903 (i.e. about 81 million) and from 2015 (i.e. about 322 million) to see that there are 4 times as many people in the US now than when modern MLB began. The number of MLB teams have increased from 16 to 30. This is not even a 50% increase in MLB teams. In conjunction with this 400% increase in US population, add to the MLB talent pool the international populations and the formerly excluded black players. This enormous increase in the population pool from which to draw MLB talent should debunk the seemingly automatic assumption that MLB talent has diminished through expansion.
Peter and I spoke at the SaberAnalytics conference and the big difference in the aging curves between my version and his is his new wRC+. If this is true, we should expect to see the aging curves become more up and down in the near future.