Measuring & Managing the Value of Ballclubs (Part 1)
Every year as free agent salaries explode, journalists and analysts try to find a means behind the madness that explains the inextricable growth of payroll. One reason posited is that as more money flows into the game the value of baseball clubs continues to grow astronomically, allowing owners to indulge in wage largesse.
The theory is that owners don’t have to turn a profit because they make money purely through capital appreciation and use that as the basis to sign the latest and greatest free agents. Mix new superstars with your existing crop of talent and the team is in line to cover itself in postseason glory. A World Series win would do wonders for the bottom line, which would cause the value of the club to grow even faster. So it goes. It is difficult to fault the logic, but when all 30 owners are driving to the same end and there are only eight postseason slots, losers will outnumber winners.
It is with this thought that I present a four-part series on ball club valuation. In this opening piece, I’ll look at the relationship between payroll growth and ball club value over the last 20 years or so, using data from Forbes. In the second part, I’ll spend more time with the Forbes data, poking around under the hood to see how robust the methodology is.
In the third part, I will take a look at different valuation techniques and try to value the Milwaukee Brewers. Why the Brewers? Data are difficult to get and it just so happens that there is quite a bit of publicly available info on Bud’s old team. These three comprise what I call “Measuring Value.” In the final installment I want to explore why similar clubs can have wildly different valuations and give some thought as to what owners can do to maximize the worth of their franchises—this I term “Managing Value.”
This four-part series only scratches the surface of what is a much wider topic. Over the coming few months I’ll return to this subject with plenty more detailed analyses and insights.
Let’s get started.
Valuation 101
Before we launch into this stuff it’s worth spending a little time on the basics of valuing a ball club, or any other asset for that matter. The subject is extremely complex and technical, but in short the value of any asset is the present value of all future cash flows. So what does this mean? Let’s run through an example. If I give you $100 a year every year for the next five years, what is that worth to you today? It obviously depends on a number of factors, the most important being what you could make by investing that money elsewhere.
If you thought that you could invest that money in an instrument (eg, a bank account) that returned 5% interest (risk-adjusted) per annum, then a little math tells you that the worth of your asset (ie, the present value of $100 for the next five years) is about $380. In other words you’d be willing to pay a maximum of $380 for that asset. And that is the crux of valuation. Make sure you keep this concept in mind while trawling through different aspects of valuation as it is one I’ll keep referring back to.
Now let the games begin!
Ball club Valuations
Who’s heard of Forbes? Most people, I suspect. They are the guys who publish the eponymous rich list every year so we can find out whether Bill Gates accumulated more treasure than Warren Buffet did. The rich list isn’t the only perennial list that our friends print. They also publish valuations for every major league franchise. How they arrive at their numbers is a bit of a conundrum—one that’s best left for another day.
Take a look at the most recent list, which was published in 2006 for the 2005 season:
Rank   Team                         Value     % Change
1      New York Yankees             1026      8
2      Boston Red Sox               617       10
3      New York Mets                604       20
4      Los Angeles Dodgers          482       14
5      Chicago Cubs                 448       12
6      Washington Nationals         440       42
7      St Louis Cardinals           429       16
8      Seattle Mariners             428       3
9      Philadelphia Phillies        424       8
10     Houston Astros               416       17
11     San Francisco Giants         410       8
12     Atlanta Braves               405       6
13     Los Angeles Angels of Anaheim368       25
14     Baltimore Orioles            359       5
15     San Diego Padres             354       8
16     Texas Rangers                353       8
17     Cleveland Indians            352       10
18     Chicago White Sox            315       20
19     Arizona Diamondbacks         305       7
20     Colorado Rockies             298       3
21     Detroit Tigers               292       22
22     Toronto Blue Jays            286       34
23     Cincinnati Reds              274       8
24     Pittsburgh Pirates           250       15
25     Kansas City Royals           239       28
26     Milwaukee Brewers            235       13
27     Oakland Athletics            234       26
28     Florida Marlins              226       10
29     Minnesota Twins              216       21
30     Tampa Bay Devil Rays         209       19
I suspect the order won’t shock too many people. What we perceive as large-market clubs dominate the upper echelons while the minnows bring up the rear. If you gave the table above more than a cursory glance, the third column, which tells us that baseball is in a rather rude state of health, may have caught your attention. The average franchise grew in value by an astonishing 14% between 2004 and 2005, outperforming almost every other asset class. To put it another way, Frank McCourt trousered an extra $60 million in paper capital gain last year simply by owning the LA Dodgers. The same cash in a bank account would have netted $15 million, or $30 million tops in the stock market.
These data show that collectively baseball became a lot richer last year. To see the permanence of this trend take a look at how the values of all major league franchises combined have risen since 1990 (expansion franchises ignored).
Year    Value ($B)   Year % change
1990    3,150
1991    3,021        -4%
1992    2,830        -6%
1993    2,805        -1%
1994    2,885        3%
1995    3,000        4%
1996    3,458        15%
1997    4,970        44%
1998    5,627        13%
1999    6,141        9%
2000    7,029        14%
2001    7,683        9%
2002    7,982        4%
2003    7,975        0%
2004    9,002        13%
2005    10,256       14%

CAGR since 1990      8.2%
CAGR Since 1995      13.1%
In the early 1990s, as the US economy emerged from its recession and the players’ strike took hold, valuations stayed static. It was only after the labor dispute ended that the value of ball clubs started their stratospheric climb. In all, year-on-year capital appreciation over the period was a healthy 8%; after 1995 it was a hedonistic 13%.
Yikes, that is a lot of moolah! So, what happens to it all?
The Link to Payroll
One obvious beneficiary of this largesse is player wages. But does all the capital appreciation go straight into the players’ pockets, or is there something left for the owners to cream off the top?

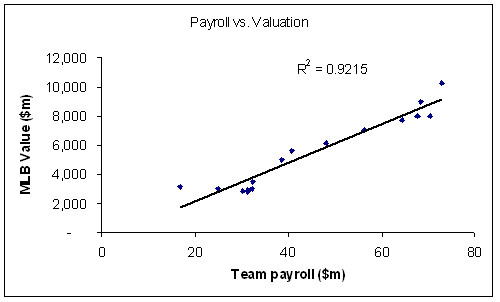
The graph shows average payroll on the x-axis against value on the y-axis. Unsurprisingly there is a strong relationship between the two. The R squared is 0.92. Closer examination of the data show that there is actually a small lag effect. For instance, in the early 1990s valuations were static but payroll was moving along at a 20-30% clip. It was only a couple of years later that General Managers reined in spending. Likewise, when valuations started to surge in 1995, it took another two years before teams loosened the purse strings.
The model predicts well what is happening this year. Since 2004 average payroll has risen by only 2% a year, but values have accelerated at 15% a year. Based on that we’d expect 2007 to be a bumper payroll year and the current goings on in the free-agent world definitely support that.
There are a couple of watch-outs though. First, is the consideration that the values we are using come from Forbes. If sabermetrics has taught us one thing it is to be skeptical about what we see and hear. I’ll look at how much stock we should put in the Forbes data in part two.
Second, if it is not obvious now it will be by part three, but there is an inextricable link between revenue and value. All else being equal, the more revenue a club generates the higher its profits are and the more it is worth. Values are being driven up as a result of money flooding into the sport from lucrative TV deals and rocketing ticket prices. The link is more subtle that you may think. For instance, if a club signs a new TV deal we’d actually expect value to increase ahead of revenue.
Why? Valuation 101 said that the worth of an asset is the present value of all future cash flows. A new TV deal implies not only higher revenues today but also in the future. The value reflects this expected increase in revenue immediately although it takes several years before the full impact of this new revenue is realized. The lag trend we saw earlier is partly because of this interaction between revenue and value. Taken to its logical conclusion there is an argument that GMs could be even more aggressive in the free-agent market than they already are. It would be the same as you or I borrowing against the rising value of our homes to fund renovation projects or other frivolous activities.
Either way value and payroll are closely related—so, big deal; isn’t that what we expected? Well, yes, to a point at least. Don’t forget that owners continually bleat about how spiralling wage bills result in impoverished franchises. Poor owners! Although that view has been largely discredited in recent years, the data above prove it to be emphatically false. In fact the Forbes data say that valuations have risen faster than mean payroll over the last 15 years. Total payroll as a percent of total value has dropped from 24% to 22% over the last decade. Collectively the owners are dripping with lucre.
Let’s Talk Teams
Enough of looking at data in the aggregate, let’s look at what has happened to the value of individual franchises in this period. Which have increased the fastest? Have a look at the valuations for all teams from immediately after the strike in 1995 to today:
Team           1995 ($m) 2005 ($m) CAGR
Expos / Nats   68        440       21%
Padres         67        354       18%
Yankees        209       1026      17%
Mariners       92        428       17%
Mets           131       604       17%
Red Sox        143       617       16%
Astros         97        416       16%
Phillies       103       424       15%
Angels         90        368       15%
Pirates        62        250       15%
Cardinals      112       429       14%
Giants         122       410       13%
Brewers        71        235       13%
Dodgers        147       482       13%
Cubs           140       448       12%
Royals         80        239       12%
Twins          74        216       11%
Indians        125       352       11%
Reds           99        274       11%
Tigers         106       292       11%
Rangers        138       353       10%
Braves         163       405       10%
Athletics      97        234       9%
Marlins        98        226       9%
Rockies        133       298       8%
White Sox      144       315       8%
Orioles        168       359       8%
Blue Jays      152       286       7%
Devil Rays               209
Diamondbacks             305
The table is sorted by10-year CAGR. Interestingly the Nationals are top of the tree because thrashing the timber in the capital is far more lucrative than it is in some Canadian outpost. See if you can guess the relocation year from the graph below?
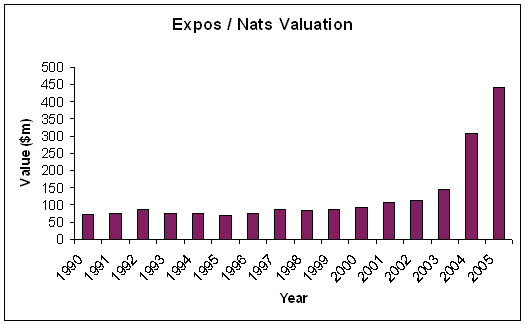
Okay, you don’t have to be Einstein (or even know anything about baseball) to decipher that it was 2004. No wonder Bud Selig and the MLB owners were so keen to buy the Expos—it was a license to print money. The extent to which local markets drive value is interesting and is something we’ll explore in more detail in part four.
What other trends can we detect? Let’s pick out a few examples.
You’d think that with 10-15% annual rises in franchise value everyone would be coining it. Not so. Look at how the Tampa Bay Devil Rays’ value has changed since their expansion in 1998. Forbes initially pegged them at $225 million, or around the average in that year, but by 2003 their value had slumped to $150 million despite the market’s Everest-like ascension.
Devil Rays
Year    Value ($m)
1998    225
1999    163
2000    150
2001    142
2002    145
2003    152
2004    176
2005    209
Another interesting example is my team, the Atlanta Braves.
Atlanta Braves
Year    Value ($m) Payroll ($m)
1990    74         10.9
1991    83         21.2
1992    88         32.9
1993    96         43.9
1994    120        40.3
1995    163        47.9
1996    199        53.6
1997    299        52.1
1998    357        61.7
1999    388        79.3
2000    407        84.5
2001    424        91.8
2002    423        93.5
2003    374        104.6
2004    382        90.1
2005    405        86.5
The Braves’ value peaked in 2001 & 2002 at $424m, which was also close to the time that their payroll peaked. Coincidence? I don’t think so. Remember the 2003 valuation was published in Forbes in 2004 after Time Warner clamped down on payroll. We said earlier that value today is based on our future expectations of revenue and profit. Forbes probably thought that the Braves dynasty was coming to an end and so would be worth less. The rebound in 2005 could be because Schuerholz continued to defy the sceptics with on-field success while juggling more limited resources. With the Braves under the hammer for anywhere between $450m-$600m (the final number remains a mystery) it seems as though Forbes’ estimate could have been a tad conservative—we’ll find out soon.
One final thing to mention is that on-field success doesn’t appear a path to financial utopia. Two of the best-run teams in the majors, the Twins and the Athletics, continue to languish at the bottom of the valuation table. Perhaps the old adage that you have to spend money to make money is true after all!
Value ($m)
Year    Athletics  Twins
1990    116        81
1991    115        83
1992    124        95
1993    114        83
1994    101        80
1995    97         74
1996    115        77
1997    118        94
1998    125        89
1999    134        91
2000    149        99
2001    157        127
2002    172        148
2003    186        168
2004    185        178
2005    234        216
I’m not going to go through each individual club but if you want to look at valuations over time you can download a spreadsheet here.
Takeaways and Next Up
So, what have we learned?
1) As more money comes into baseball franchise values increase (duh)
2) This feeds through into higher payroll (duh again)
3) Extraneous factors affect value, we have discovered four:
- Poor performance can destroy worth
- A winning team doesn’t equal instant wealth
- A change in future expectations (either money or performance) will affect value
- Relocation can radically transform value
However, this list certainly isn’t complete. That will be the task of future articles but before we move on to that we need to deal with a pressing question: Namely, how does the Forbes methodology work and is it a good judge of value for a baseball club?
I’ll provide those answers in a couple of weeks.
References & Resources
Obviously Forbes is a great (and only) source of valuation data and the Lahman database provided all the salary information that I used. Thank-you both!