New Findings About An Old Park
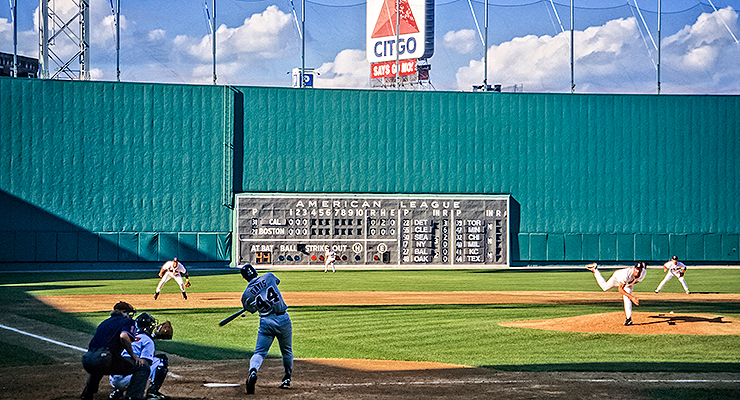
This pitch probably resulted in a double. (via Jerry Reuss)
Fenway Park is such a famous sports landmark that Baseball Almanac has a full page devoted to quotes about it. At various points in its history it has inspired awe, apathy, disbelief, confusion, disgust, and, ultimately, consecration. I won’t add to the pile of bad verse that has been spilled on Fenway. I will just point out one particular way in which it is unique among sports venues: It isn’t just famous, it is famously weird.
This weirdness has long been known to affect the baseball games it hosts. In “Men at Work,” George Will guessed Fenway adds about five to seven points to batting average, also observing that Red Sox players had won a disproportionate share of batting titles in the post-war era. Growing up in Massachusetts in the 1980s, this was an obvious truth. After all, “fly ball to left field” was Wade Boggs’ superpower. Sure, the batting average effect is partly about foul territory, or rather, the lack of it. But foul balls don’t capture the imagination of little boys – Green Monsters do. However, as a kid my musings were limited to inane debates about Boggs vs. Don Mattingly; actually quantifying the effect a ballpark could have was quite beyond my reach.
Fortunately, it was not beyond the reach of Pete Palmer, who showed us how to measure these effects when he introduced park factors in The Hidden Game of Baseball. The original formula was for overall scoring – identifying parks that tended to be hitter-friendly or pitcher-friendly so players with different home stadiums could be compared on level terms. But the concept could be adapted to specific events (hits, home runs, etc.), and to quantify separate effects for lefties and righties. Today, park factors of many varieties are available from FanGraphs, StatCorner and other sources.
These park factors confirm my childhood impression that Fenway was fairly hitter-friendly, inflating scoring by five to 10 percent. But as anyone who has watched a lot of Red Sox games can tell you, doubles are where Fenway really leaves its mark. According to FanGraphs’ park factors, in recent years Fenway has inflated doubles by about 25-35 percent overall. This effect exists for both lefties and righties, with Fenway increasing doubles by 30-40 percent for lefties and 25-30 percent for righties.
For most purposes that is enough: Fenway has an impact, it’s large, it affects hitters from both sides of the plate, and that’s that. But it’s not quite all there is to say. After all, Fenway presents asymmetric profiles to left-handed and right-handed hitters since the Green Monster is pull-side for righties and away for lefties. Because this unusual feature has quite a bit to do with Fenway’s double-friendly ways, a difference like this ought to mean something. As it turns out, it does mean something: The standard doubles park factor doesn’t tell the whole story, for batters of either hand.
Methodology
To find out how Fenway might impact different hitters differently, I decided to look at all hitters from 1953 to 2014. The 1953 season marks a somewhat subjective line before which Retrosheet’s event files are missing “a lot of games,, and after which they are missing only “a few games.” Most importantly, that campaign is after the last change to Fenway’s on-field dimensions in 1940. To remove players who might have been selected for – or developed over time – a specific skill for launching fly balls off the Green Monster, I eliminated all Red Sox home plate appearances. For everyone else, I computed how frequently they hit doubles (per PA) in a given year, both (a) on the road at Fenway, and (b) on the road at all other parks combined. I then computed the delta (2B/PA on the road at Fenway minus 2B/PA on the road everywhere else) for each hitter.
Suspecting Fenway might affect the most prolific doubles hitters differently from the least prolific, I ranked hitters based on their expected propensity to hit doubles each season. To make those rankings, I created retroactive Marcel projections for every hitter. This avoids the obvious sampling problems that arise from using in-season statistics to rank hitters each year. Since a full Marcel projection requires three seasons of historical data, I used 1953-1955 data only for creating projections; actual results begin with 1956.
With these rankings in hand, I grouped hitters into quartiles for each season based on their projected double-per-PA rate. Within each quartile, I computed the weighted average ex-Fenway 2B/PA rate and at-Fenway delta, weighted by the lesser of each player’s at-Fenway and ex-Fenway plate appearances in a given year. I then averaged the results within each quartile across all seasons (again weighted by the sum of the lesser of at-Fenway and ex-Fenway PAs each season), split by batter hand.
Results
I found that high-double lefties received a much bigger benefit at Fenway than all other lefties:
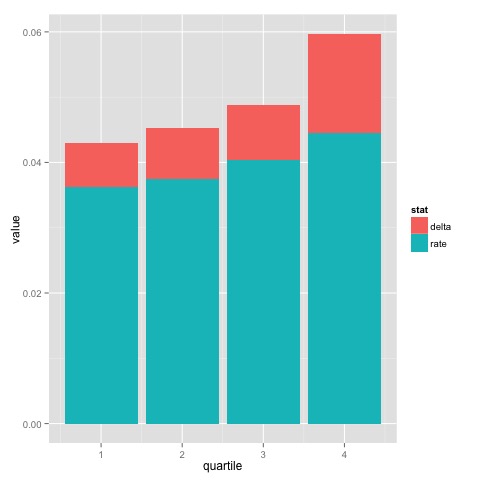
Chart 1: 2B/PA rates ex-Fenway with at-Fenway deltas for left-handed hitters on the road, by projected 2B/PA quartile,1956-2014
In contrast, high-double righties received about the same benefit as other righties:
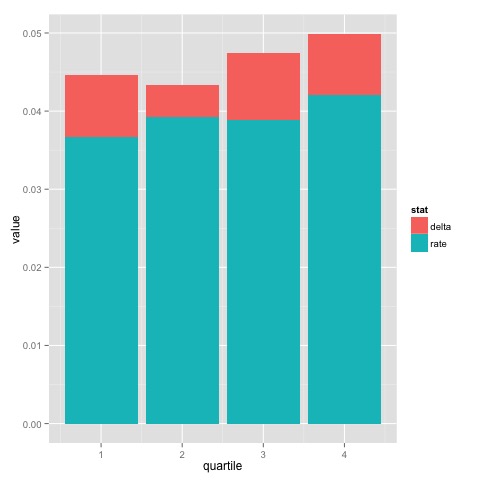
Chart 2: 2B/PA rates ex-Fenway with at-Fenway deltas for right-handed hitters on the road, by projected 2B/PA quartile, 1956-2014

As these two charts show, Fenway park has had a vastly different impact on left-handed and right-handed batters even though the overall result is to inflate doubles in both groups. For lefties, the most prolific doubles hitters increased their rates by more than twice as much in absolute terms as the least prolific. For righties, both the most and least prolific doubles hitters increased their rates by about the same amount in absolute terms.
Some possible objections, rebutted
By now, anyone with a cursory knowledge of Fenway’s history probably has realized that while Fenway’s field hasn’t changed since 1940, the stadium has seen changes, most notably the addition of a center field message board in 1976, the “600 Club” seats behind home plate in 1989 (these were later renamed the “406 Club”), and seating on top of the Green Monster in 2003. If these changes had an impact on batted balls generally, or doubles specifically, then these changes might confound the results.
Before you scroll down to leave an angry comment about wind shear and micro-vortices, I will stipulate: it does, in fact, appear that each of these major renovations has had an impact on doubles at Fenway:
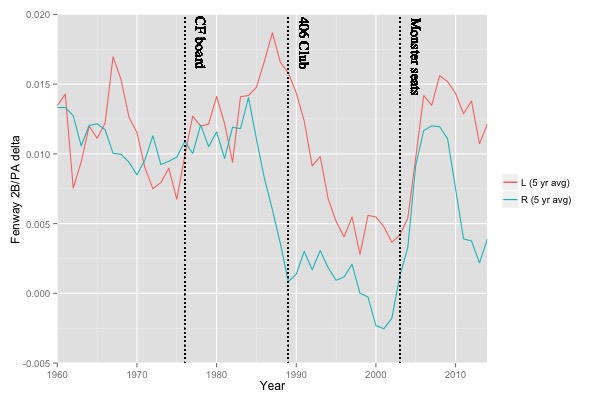
Chart 3: Fenway’s average 2B/PA delta (5-year moving average), by batter hand
This chart shows the average 2B/PA delta visiting hitters have experienced, by batter hand. Because the deltas fluctuate significantly from year to year, the chart uses a five-year moving average to smooth out some of the random variation. Note in particular the impact of the 406 Club: Red Sox players of that era strongly believed its addition had a significant impact on home runs (and fly balls more generally). It also appears to have neutralized Fenway’s double-friendliness, at least until the addition of the Monster Seats in 2003, which has had a surprisingly large impact considering the (seemingly) minor change.
However, while each change has influenced the average 2B/PA rates for both lefties and righties, the effect I identified still appears to hold: high-double lefties have a higher at-Fenway delta than low-double lefties, and high-double righties have about the same at-Fenway delta as low-double lefties:
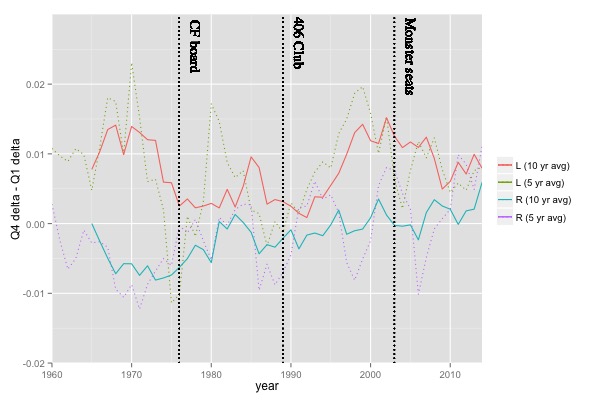
Chart 4: Q4 delta minus Q1 delta (five- and 10-year moving averages), by batter hand
The data is noisy, since park effects are noisy even when measured with a full season of hitter statistics, and here we are dividing each season into four separate samples of hitters. Therefore, I’ve used 10-year averages to make the trend more apparent (five-year averages are shown as dotted lines if you want an apples-to-apples comparison with Chart 3). Though there obviously is some variation over time, it’s clear the difference between the deltas for the most and least prolific doubles-hitting righties has hovered close to zero over time while it has tended towards something well above zero for lefties.
Another way of confirming that the effect holds across eras is to compare the top-quartile delta to the bottom-quartile delta each year, simply counting how frequently the top-quartile hitters had a higher at-Fenway delta than the bottom-quartile hitters. If prolific doubles hitters receive a special benefit, they should have a higher at-Fenway delta the majority of the time; if they receive no special benefit they should underperform as often as they outperform.
| % of seasons in which most prolific doubles hitters had higher delta than least prolific, by batter hand |
|---|
| Era | Lefty, % Q4>Q1 | Righty, % Q4>Q1 |
| Original (1956-1975) | 65% | 50% |
| CF board (1976-1988) | 62% | 31% |
| 406 Club (1989-2002) | 71% | 64% |
| Monster Seats (2003-2014) | 75% | 58% |
| Full sample (1956-2014) | 68% | 51% |
Again, the result is clear: the most double-prone lefties, as a group, received a larger benefit from Fenway in a clear majority of seasons, while the most prolific righties received a larger benefit about half the time and a smaller benefit about half the time. Furthermore, this relative trend held not only over the full period but within each period as well, with the high-double lefties always outperforming their low-double peers more often the high-double righties did.
Another obvious, though smaller, objection might be that I haven’t accounted for pitchers. Since this analysis only considers visitors to Fenway, the batters always were facing the Red Sox pitching staff over the entire sample. If there is some bias in the match-ups arising from this fact, it could skew the results.
In reality, hitters in each quartile faced about the same level of competition at Fenway as all hitters of the same hand. While at Fenway, lefties in the fourth quartile faced pitchers that were -0.00344 wOBA points tougher on lefties than the average pitcher they faced elsewhere, while lefties in the first quartile faced pitchers that were -0.00338 wOBA points tougher. In other words, regardless of their propensity to hit doubles, lefties at Fenway faced pitchers that were uniformly tougher than what they faced away from Fenway. For righties, the average pitcher was 0.00585 wOBA points easier at Fenway for the most double-prone hitters and 0.00579 wOBA points easier for the least – easier on average than they faced elsewhere, but again uniformly so.
Finally, it is reasonable to ask whether the results are an artifact of the weighting scheme. As a sanity check, I recomputed the average 2B/PA rates and deltas by quartile, weighting by the harmonic mean of each player’s at-Fenway and ex-Fenway PAs instead of the minimum. The differences between the first and fourth quartile at-Fenway deltas, for both lefties and righties, were the same to three decimal places under both weightings.
Conclusions
Over its life, Fenway has sometimes had a neutral effect on doubles, but most of the time has tended to inflate them. In hindsight, these swings seem to coincide with structural changes to the stadium, suggesting they reflect something more than random variation. But across all of Fenway’s physical configurations, the park was always affecting certain hitters differently from others. Since this effect has held no matter what Fenway was doing to doubles overall, I conclude it must be driven by something invariant over the data sample. Most likely, that invariant is Fenway’s unusual dimensions.
As fun as this finding may be, it doesn’t point to any broader lesson, nor does it mean much in the grand scheme of baseball. For the average hitter at Fenway, this effect is essentially irrelevant – the effect on his ability to hit doubles will be roughly the average effect (i.e. exactly what is measured by standard park factors). And for exceptional hitters at most parks other than Fenway, it’s also irrelevant, because the average park is…average.
At the moment, there may not be any major league ballpark besides Fenway that hides a subtle park effect behind a glaringly obvious park effect. Although it’s difficult to analyze rigorously (because extreme parks have tended to change over time, and parks that haven’t changed much tend not to be very extreme), my casual analysis indicates most park effects work precisely the way they are usually presented: as simple multipliers. So even in this respect it seems Fenway is an outlier: park factors probably work exactly as we expect them to, except perhaps for this one factor at this one park.
So what is anyone supposed to do with this knowledge? Maybe it changes the way we should think about some individual Red Sox players, but it’s not exactly groundbreaking to say that certain left-handed hitters have been able to exploit Fenway’s dimensions to their advantage. Maybe on the margin it might help the Red Sox evaluate personnel in a very small way, but they may have known about this for a long time already. Most likely it just adds one more entry to the long list of quirks at the most interesting stadium in American pro sports.
That picture at the top reminds me how much more majestic the monster was without all the tacky clutter that now covers a lot of the green.
I was thinking the same thing.
But I wonder how much the seats would detract as well, even if there were no advertisements. (I think the seats were a great idea.)
There are generally three ways of hitting a double: a ball hit down the line, a ball hit into the gap, and balls hit hard enough to hit the wall but not over it. It seems likely to me that it is the third one in particular that increases. The other two might actually be slightly suppressed in that the LF can get to the ball quicker because of the Green Monster (of course it also depends on the quality of the LF defense).
I wonder if there is a way to bucket the hitters into mashers, average dudes, and speedsters to see if change in benefit shows up here.
Yes, that’s more or less my thinking as well. For righties a double off the wall is probably a hard-hit ball with not quite enough loft to make it out. For lefties a double off the wall is probably not especially hard-hit, but “weakly hit” has different meanings when you’re talking about (say) David Ortiz or Dee Gordon. Something about the interaction of the wall’s boundary constraint with the variation in “weakly hit fly ball” from different types of hitters leads to a disproportionate benefit to those who hit the ball a little bit further on average. At least that’s my theory.
Categorizing the players into groups like that is a good suggestion for investigating that idea further – thanks!
Nice article, but I don’t think you are adjusting for Red Sox pitching properly. Clearly, any Red Sox pitcher is going to seem like they possess a higher than normal propensity to allow doubles over time, by the sheer fact that they pitch half their games at Fenway. So did you try to evaluate the Red Sox pitchers’ true doubles-inhibiting skills (i.e., look at only their road games and compare to average road pitching performance), or did you simply look at their overall season stats? It certainly seems like the latter.
You are correct that I looked at overall stats as the control. But it’s trivial to do it by 2B/PA allowed as well (results below).
The “true” doubles enhancing/inhibiting skills of the Red Sox pitching staff isn’t the relevant thing to control for, though. What matters is how the sample of pitchers varied across the different groups of batters: i.e. if it turned out that the most prolific lefty doubles hitters just happened to face pitchers that gave up a lot more doubles than the pitchers faced by the least prolific, but this wasn’t true for righties, well that would probably explain the difference I found.
As it turns out, it doesn’t explain the difference between hitter groups. For both lefties and righties, the pitchers’ average 2B/PA rates varied across the most and least prolific hitter groups by less than 0.0002 2B/PA, compared to at-Fenway deltas on the order of 0.01 2B/PA – in other words a de minimus effect.
Hitters with established power are often played to pull, now by the infield shifts but always by outfielders. As a result, it seems to me, a ball off the wall is more likely to be a double if it’s hit by a LHH. (Righties, meanwhile, may face a huge empty zone in RF, but they tend to be trying extra-hard to pull because of the wall.)
There are two kinds of prolific doubles hitters, fast guys and slower power guys. I’d guess Fenway helps the latter especially.
Yes, I think that is getting at the gist of it. See my comment above re: fly balls off the bat of David Ortiz vs. Dee Gordon.
Are the extra doubles from prolific double lefties coming from hits that would be singles or home runs in other parks? Is the increase in doubles per pa proportional to a lefties wOBA increase?
The increase in doubles is more than proportional to the wOBA increase for batters of all hands.
As for where the doubles are coming from, it’s complicated to say precisely. For sure there are spots in play at Fenway (e.g. deep right-center) that would be home runs in some other parks, but some of those balls will fall in for hits and some will be outs. And some (many? most?) of the “extra” doubles would actually be easy outs at most parks, not hits.
There’s an answer, and I have some very rough theories, but exploring them will take at least a whole other article’s worth of work. So stay tuned….
As an aside, I’ll be talking about this subject at Saberseminar in August. By then I may have more to say about some of these questions.
“Fenway’s field hasn’t changed since 1940” is incorrect. The left-centerfield triangle was eliminated in 1970; before that the flagpole was “in play” all the way to the ground, and a fair ball could roll around behind the flagpole. Also the short foul territory was made smaller by the installation of two rows of “dugout box” seats about 10 years ago. So both fair and foul territory have been reduced.
Great catch, thank you. Though small, changes are changes.
To make sure neither of these features were having a material impact on the results, I reran my analysis for the period from 1970-2002. The results are the same: the highest-double lefties got more than double (ha) the benefit from Fenway as the lowest-double lefties (deltas of 0.013 and 0.006 per PA, respectively), while the highest-double righties received no special benefit vs. the lowest-double group (deltas of 0.0069 and 0.0073).