Next week’s Cooperstown election results today
Next Monday the Hall of Fame will announce who the BBWAA is sending to Cooperstown. If you want to know who will get in you won’t have to wait until then to find out. Just read on.
For the last few years I’ve issued an annual column predicting not only who will go into Cooperstown, but estimating the exact percentages each notable candidate will receive on the ballot.
In four years that amounts to 63 predictions. 50 of them have been within five percentage points of the actual vote, including 22 within one percentage point of the BBWAA result. The average margin of error has been 3.4 percentage points.
Last year was my best job ever. Of the 18 candidates I made a prediction on, I was within three percentage points 14 times. The average error was 2.4 percentage points.
The point is, there is reason to think the system and predictions listed below really amount to something.
The prediction system comes from ten guidelines based on the history of BBWAA voting. The Hall’s electorate has certain tendencies and patterns, and by looking at those, one can roughly determine what it’ll do before the election happens.
Let’s go over them one by one.
1. Consistency
All other factors being equal, assume a player’s vote total won’t move very much. However, all other factors aren’t always equal.
2. Strength of ballot
This is the single most important guideline. When the ballot’s overall strength goes up, the members of the backlog have their vote totals go down. If a ballot gets weaker, the backlog’s support gets stronger.
Two things change the strength of a ballot: guys arriving on it, and those departing from it. For example, in 1999 Nolan Ryan, George Brett, Robin Yount, Carlton Fisk, and Dale Murphy arrived on the ballot and the holdovers suffered considerably.
Alternately, 2008’s ballot’s newbies received almost no support, with only Tim Raines getting more than two votes among the newbies (not two percent; two votes). 13 of the 14 backloggers on the ballot had their vote totals increase. (The exception was Harold Baines, who fell from 5.3 percent to 5.2 percent of the vote. Big deal).
A typical crop of first-year players receives gains around 1.6 votes per BBWAA ballot.
This year Bernie Williams is the only guy with a chance to top five percent. Aside from him, the best new contenders are Brad Radke, Tim Salmon, Brian Jordan, and Javy Lopez. This should be a historically low vote total to new candidates. For perspective, here are the worst rookie classes in the last 50 years in terms of the average number of newbies listed per ballot:
Year	Newbies
1976	0.00
1968	0.02
1984	0.07
1987	0.08
1986	0.13
1967	0.15
1970	0.21
1975	0.26
2008	0.26
1996	0.29
2012 is probably the weakest rookie crop in 25 years. That means that the backloggers should rise up. Expect them all to go up in vote totals this year.
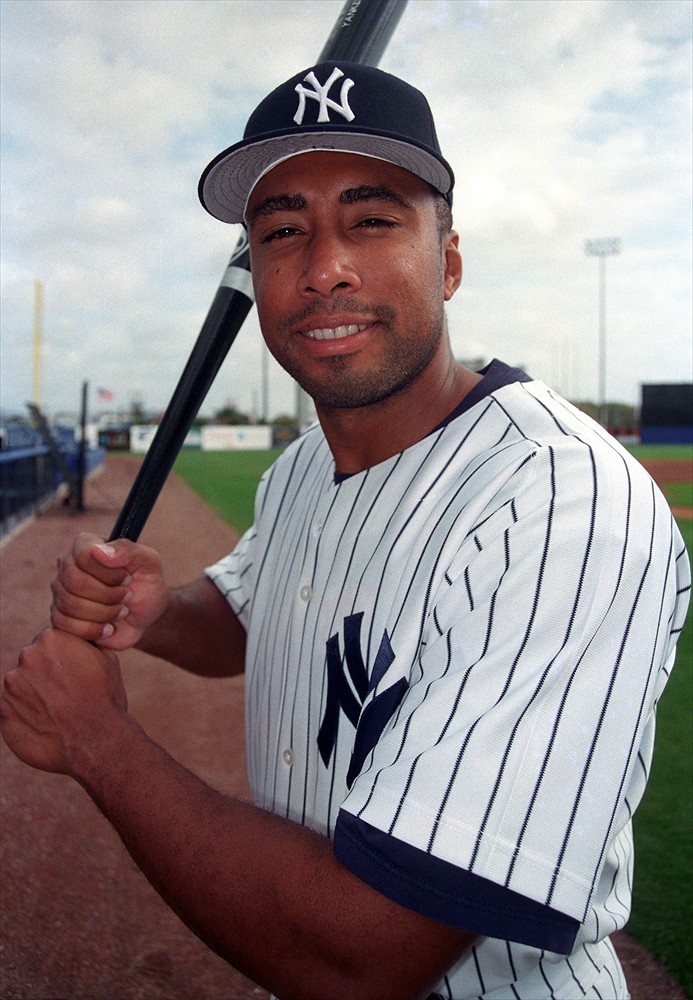
Bernie Williams: the only ballot rookie
likely to get any support
The backlog is also aided by the departures of Bert Blyleven, Roberto Alomar, and Dave Parker (the first two were elected and Parker ran out of time). Their departures make the ballot that much weaker, further ensuring a good year for the backlog.
3. Comparable candidates
The backlog will improve, but not everyone will improve equally. Comparable candidates are one notable factor. Let’s look at Luis Tiant for a second. In 1988, he debut on the ballot around 30 percent, a nice total. Then, in 1989 Gaylord Perry, Fergie Jenkins, and Jim Kaat arrived. Tiant’s vote cratered as he lost two-thirds of his support.

For 2012, the issue isn’t who’s arriving on the ballot, but who is leaving. Blyleven’s election means that Jack Morris is the sole starting pitcher on the ballot likely to top five percent (no, Brad Radke won’t get any serious support). This should help Morris as there’s less direct competition to him.
Similarly, Roberto Alomar’s departure should help Barry Larkin. They played different positions, but were both middle infielders with good all-around games. When I say comparable, I’m not trying to be too fine. It’s all about the image a player occupies in the collective consciousness of the electorate. Alomar and Larkin both played up-the-middle defensive positions and had well-rounded games.
(What about Alan Trammell, another guy similar to Alomar and Larkin? He could also get a nudge, but he’s been on the ballot so long with limited support that many voters probably aren’t thinking of him as much as Larkin, who is the top of the backlog.)
4. The “over-the-top” surge
The players most likely to receive a bump in their vote totals are the guys at the top of the backlog. They’re at the top of popular consciousness.
In general, the key is to top 50 percent. Once a guy gets the majority of voters on his side, things start breaking in his favor. When the majority finds a player worthy of Cooperstown, the holdouts start reexamining their positions.
The higher the vote total, the stronger the surge. Guys at 70-74 percent surge more than guys in the 60s, who surge more than guys in the 50s.
Two holdovers topped 50 percent last year. Barry Larkin finished at 62 percent and Jack Morris at 54 percent. The “over the top” surge should be much stronger for Larkin than Morris. He finished in the 60s instead of the 50s, and it took him less time to get there.
Going by precedent, candidates with Larkin’s support usually go up by about six percent and Morris should be expected to go up by four percent. Both are excellent bets to do more than that.

Jack Morris faces his 13th year on the ballot.
The average surge is misleading because it includes guys who had to fight through some tough ballots. For example, Jim Bunning got 63.5 percent of the vote in 1989, but his support went down in 1990 when Jim Palmer and Joe Morgan headlined an especially good newbie class. Almost half the guys in the low 60s actually surged forward by 10 percent or more.
Given how weak this year’s ballot looks, Larkin should have a double-digit surge.
Morris could also receive a nice boost this year. However, I have some lingering concerns that Morris may not rise up as much as one might expect, in part because he rose so minimally last year. Morris will rise, but Larkin will have the biggest boost.
5. Primordial conversations
These guidelines are all based on a general premise that the BBWAA election process works as a 15-year long conversation for determining who should/not go into Cooperstown. Over the 70-plus years of voting for Cooperstown candidates, general guidelines have been established for what constitutes a Hall of Famer.
For example, the BBWAA has elected 10 second basemen, and according to the Bill James Historical Abstract, they are the 10 best second basemen eligible for induction. The system almost never works that well, but a player rises up or down the ballot in part based on how he compares to similar guys in Cooperstown. That’s one reason why Larkin is rising so rapidly.
However, there are instances where the decades long conversation breaks down and new conversations emerge.
The steroids controversy is one such instance. Without the ‘roids controversy, Mark McGwire and Rafael Palmeiro would’ve receive far more support than they have. Traditionally in Cooperstown conversations, the character question is ancillary and performance is primary, but with PEDs that’s been flipped.
In fact, Mark McGwire has seen historically minimal levels of movement in his support over the years. Here’s what’s happened to him each year he’s been on the ballot:
Year	 %
2007	24
2008	24
2009	22
2010	24
2011	20
There’s a pretty clear ceiling. As a result, I can’t imagine McGwire topping one-fourth of the vote. Similarly, Palmeiro isn’t likely to do too much better than he did last year. Both will likely receive modest bumps of a few percent in this year’s ballot, but that’s it.
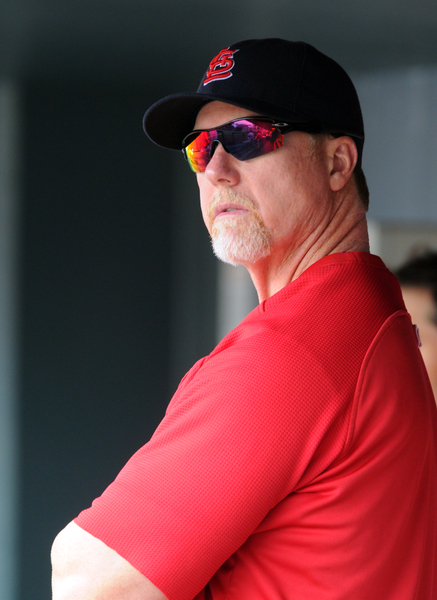
McGwire stands off on the side on the BBWAA ballot.
Another emerging conversation is about relief pitchers. Until the 1990s, only Hoyt Wilhelm was a serious candidate, so the BBWAA has only recently had to grapple with this position. Making it a bit more complex, the big reliever stat is saves and what would be a good save total for a closer 25 years ago wouldn’t be now.
Currently, Lee Smith is caught churning in the middle of the ballot. He debuted at 42.3 percent in 2003. That’s a terrific debut. In fact, every person prior to Smith who debuted at 42.3 percent or higher has since gone into Cooperstown. No exception.
Smith, however, hasn’t done diddley since then. In nine times on the ballot his average vote total is 42.5 percent – essentially exactly where he started. He peaked at 47.3 and bottomed out at 36.6 percent.
Saves always drove Smith’s candidacy, but since Trevor Hoffman and Mariano Rivera eclipsed his career total, it’s harder to make a case for him. He has his supporters and has actually done better in recent years, but he’s just spinning his wheels. He should see a mild improvement, but it’ll be an unusually mild improvement.
6. Last year on the ballot
Normally, a player in his final year on the ballot receives a modest bump, but no one faces his last time on the ballot this year.
7. Candidates per ballot
This is a big one – especially for this year’s ballot. The last decade or two of Hall of Fame voting has seen the fewest marked candidates per ballot in BBWAA the history of Hall voting. Through 1986, every single Hall election averaged over seven names per ballot. It’s never been that high since then.
Nowadays, it’s typically fewer than six names per ballot. That’s been the case in five of the last six elections. The 2008 election had 5.35 names per ballot, the lowest average ever. 2009 had 5.38 names/ballot, second lowest. 2010 is in the bottom ten, with 5.67.
(A brief side note: If the ballot has so few names per ballot, how come a strong newbie class hurts the backlog? There’s space, given that BBWAA members can list 10 guys per ballot. True, but some voters have some self-imposed limitations. If you normally vote for three of four guys most years, putting seven or eight can feel cheap. I assume that’s the thought process. Regardless, this doesn’t apply to the 2011 ballot with its weak newbies.)
Here’s what does matter. Last year’s election had 5.98 names/ballot, a decent total for nowadays. However, that includes Alomar, Blyleven, and Parker, who are all gone. They received 1,075 votes on last year’s 581 ballots, which works out to a 1.85 average.
In other words the surviving backlog averaged 4.13 mentions per BBWAA ballot last year. And this year’s newbie crop is horrible. And the all-time low names/ballot in BBWAA history is 5.35.
Upshot: Backloggers could see massive improvements across the board and this would still have the all-time record for fewest names per ballot.
The question isn’t will a guy’s vote total go up, but how much will it go up by. This year’s election will set a new record for fewest names per ballot, and everyone in the backlog will see their vote totals go up.
8. Repoz’s BBWAA tallying
All the above describes how to gauge backloggers. What about new guys? Well, there is one tool. At the Baseball Think Factory website, a diligent soul called Repoz collects every single ballot he can get his hands on and tallies them up. Usually, he winds up with a little over one-fifth of the electorate.
As I write this, Repoz has 77 ballots – a little over half of what he normally gets. To date, Bernie Williams has appeared on only two ballots (2.6 percent) and Vinny Castilla on one. That’s it for the newbies.
That’s bad. Real bad. Could the entire rookie class get skunked? Sure, but I’m skeptical. In years past the tally has had its most trouble with ex-Yankee Don Mattingly. It routinely pegs Mattingly at five or six percent, but the electorate normally gives him around 15 percent.
It’s one thing to be off by 10 percentage points when you predict a guy to get 80 percent of the vote – but when you’re predicting six percent? The tally isn’t perfect but it’s usually a lot better than that.
I have a theory to explain this. Years ago, ex-THT writer Maury Brown posted the complete list of BBWAA members. About a fifth were based out of New York City. Less than a fifth of Repoz’s tally comes from there. I think there’s a definite Big Apple effect going on, and I expect Bernie Williams to top five percent with no problem.
9. Beware five percent
Candidates who get less than five percent of the ballot fall off. Guys near it almost always go under at some point. That said, given how weak the ballot is this year that shouldn’t happen. Thus Juan Gonzalez, who barely topped five percent last year, should survive 2012.
10. Guidelines ain’t rules
This is more art than science. It’s one thing to note tendencies. Trying to put them together is the fun part. So let’s not get too carried away with any single guideline.
The predictions
Enough explaining, time for the results.
Based on the above criteria and my own semi-informed guesses, here are my predictions alongside last year’s performance to show the predicted change:
Name	      2012	2011
Barry Larkin	82	62
Jack Morris	65	54
Jeff Bagwell	54	42
Lee Smith	52	45
Tim Raines	52	38
Edgar Martinez	39	33
Alan Trammell	32	24
Larry Walker	27	20
Mark McGwire	24	20
Fred McGriff	24	18
Dale Murphy	19	13
Don Mattingly	18	14
Rafael Palmeiro	15	11
Bernie Williams	12	XX
The Rest	 3	XX
That’s 5.18 names per ballot, which would be a clear all-time low – and yet it might still be too high. You’re better taking the under than the over on 5.18 names/ballot.
Good news for Reds fans – Barry Larkin is going in easily. A guy in the low 60s rarely makes the jump over 75 percent like this, but this isn’t a normal year.
All precedent and historical trends point upwards for Larkin. He’s on top of the backlog with a weak crop of newbies on an aggressively uncrowded ballot. All those things should pump up his vote total.
Forget the guidelines for a second. Let’s compare Larkin to Ryne Sandberg. Both were perennial All-Star middle infielders who spent a long time with one NL team, won an MVP, played a very solid all-around game, and were widely perceived as future Hall of Famers during their careers.
In Sandberg’s first year on the ballot, he got a little under 50 percent of the vote. In Larkin’s debut, he got a little over 50 percent. Both very similar, but a slight edge to Larkin.
In both cases, Sandberg and Larkin topped 60 percent in their second year – but Larkin edged Sandberg by a hair there, too.
In his third year, Sandberg lept from 61 to 76 percent. Larkin needs to go from 62 to 75 percent. It was close in Sandberg’s case, but it was a much more difficult ballot for him. Wade Boggs debuted in Sandberg’s election year. That’s a far cry from Bernie and the Seven Dwarfs.

The newest member of the Hall of Fame.
I expect notable jumps from Tim Raines and Jeff Bagwell. Raines has the advantages of already having some serious momentum (he’s gone from 23 percent to 37 percent the last two elections) and there’s no one quite like him on the ballot. He’s a speedster surrounded by sluggers.
Bagwell actually had a nice debut last year at 41 percent. Aside from players still on the ballot, all who did at least that well in their first year on the ballot later made it to Cooperstown. Yes, there are steroid rumors, but then again Larkin and Sandberg were both considered clear Hall of Famers and their first years were nowhere near 75 percent. Bagwell’s start was below theirs, but not that much below.
The rest of the players in the backlog shouldn’t get their hopes up. They’re too far back with three really impressive rookie crops coming up.
The key backloggers to look out for (beyond Larkin) are Raines and Bagwell. If they move up enough, they have enough years left to gain election. Those, like Jack Morris, who are almost out of time will probably have to wait for the Veterans Committee.
Anyhow, that’s my prediction. Come back next week to see how dumb I am.
References & Resources
Years ago I took the voting results from every BBWAA election from the Hall of Fame’s website and put it in Excel.
Repoz’s tally at Baseball Think Factory comes in very handy for this.
How in the world is Don Sutton in and Jim Kaat? California and New York! Sorry Larkin doesnt have HOF numbers but when Robby Alomar goes in? Katy bar the door. Nice system.
I wonder if there is any backlog of support for players in their second year on the ballot. Voters for Bagwell, for example, might have thought he wasn’t a first ballot type of player but come on board for the second year. (I’m not advocating that distinction but just asking whether there is a second year bump historically.)
I hope Raines gets in…
Tim Raines was a dominant player from 1981-87. He was a very good player for another eight years. And his decline was pronounced, similar to Kareem Abdul-Jabbar’s in basketball. Sometimes late memories stick in the mind. Raines deserves to get in but isn’t slam dunk.
HUGE MISTAKE: I forgot to predict Juan Gone. DAMMIT! I’d peg him around 8%. Sorry about that.
As a result, I’d probably kick several guys down by a percentage point or so to keep the names/ballot around where it is. As noted in the article, the predictions are likely too high than too low. Given that I left a guy off, the predictions are that much more likely to be too high.
Chris, I think you’re right on the money at the top of the ballot. Larkin gets in, and Morris gets about 65, Bagwell about 50. I think Larkin might come in a little lower, something like 78 per cent, but that’s quibbling. Larkin will be the only electee.
Good work.
Baseball is in a crazy state right now. How is a guy, McGwire, with nearly 600 homeruns not in the HOF. What are we going to do about Bonds? Pretending that they’re not there won’t do it. Someone has to face up to this situation and it should be Major League Baseball. Did these players violate any laws or regs? Bonds was on trial because he did not want to talk about whether he did something that wasn’t even against the rules. No one liked the roid era, but whose fault was it, anyway? The players, as players usually do, attempted to maximize their career within the boundaries of the regs. Now we’re punishing then for that? If you want to send someone to jail for all of this it should be Selig and his cronies. They’re the ones who allowed this to happen. And they’re the ones who have not stood up for these players. They slink off into the night, shaking their heads as though they had nothing to do with this, and as usual, all the boneheads who love to scream about the evil players are piling on to people who as near as I can tell violated no rules. I don’t like Bonds, never did, going back to his Pittsburgh days, I always found him unsufferable. But come on, if this guy is not HOF material they need to shut the place down. The steroid era happened, we just can’t pretend that it didn’t. Those player belong. This is how crazy it is. Bagwell is supposedly being kept out because of a suspicion, no evidence at all, that he did roids. Someday, someone will figure out that the ball was juiced, afterall lots of players were suddenly hitting homeruns who weren’t accused of roids, and all this bs will seem sad and ridiculous. And all this discussion of these relatively minor characters, Williams et al, is hypocritical and renders the entire HOF process meaningless. Selig, or someone needs to either say these players are deserving or not, and I would love to hear the argument why not. Who cares about Williams when McGwire is at 20%. Don’t like steroids, get in line. But blame the right people and face the facts.
As an addendum to the above, there are several articles on the internet if you need to review the history. In 1987 the NFL banned steroid use. MLB, according to the article I have read and the way I remember it, was the only major league sport that did not have a policy. This was in effect telling the players, we, the management of this game, don’t see anything wrong with roids, so go ahead, do what you have to, let’s have fun. Any voter who does not put McGwire on his ballot should lose the privilege of voting for the HOF.
It was against the law.
And before he juiced up the only way McGwire would have been in the Hall of Fame was if he bought a ticket.
Bonds and Clemens were Hall of Famers before they ballooned up.
Pretty cut and dry.
Next question
As for Bagwell… yeah it is outlandish to think a light hitting first baseman would suddenly pack on 30 pounds of muscle while hanging out with Ken Caminiti was doing something.
PFS – I haven’t gone back to review, but as I remember it, McGwire was using a legal substance openly. I seem to remember articles written at the time about the bottle sitting front and center on the shelf in his locker. It’s possible I’m wrong about that, and if so, please correct me, but it appears to me that he is being punished retroactively. (I am not arguing for his election, I’m just trying to get it clear as to whether his conduct was illegal or immoral, and it seems it was not.)
It was illegal to purchase without a perscription
Look, if you don’t care if someone took ‘roids, then fine. Vote for Palmeiro, Canesco, Gonzalez, McGwire et al.
But to take the whole “Ohhh… but was it legal? Was there a rule? What was the problem?” route is disingenuous.
Sorry, it is.
Man, the Hall of Fame votes are NOT going to be fun for the next 10-15 years
Taking drugs without a prescription is “illegal,” but authorities and baseball turned their backs on that particular problem for years. Of course, we were going to evolve from greenies to “harder” drugs. It was inevitable.
Taking the “OMG, it was illegal! What’s wrong with you!” tack is also disingenuous.
Paul, your conclusions are pretty cut and dry but I don’t think the issue is. McGwire’s principal drug of choice was Androstenedione which was an over the counter “dietary supplement”. It was legal, period. His use of anabolic steroids, which was illegal, was used to help him recover from injuries, reportedly twice in his career. If this were true, this would put his usage in the same category as Hank Aarons use of amphetamines, and using them without a valid prescription was equally illegal. You want this to be simple, everybody likes their villains to be obvious and uncomplicated, but that’s not how it works. Baseball had no policy, we have all of these “great” players who are HOF material, if you go by the numbers, and MLB has accused them of nothing. Joe Jackson was banned by the commissioner as was Pete Rose. Mark McGwire has been accused of nothing, the commissioner, what a surprise, is mum. Baseball had no policy, virtually every other professional sport did, so don’t blame the hired help, blame the people who ran the institution.
Yo TC,
If you saw Henry Aaron’s end-of-career burgeoning gluteus maximus, I don’t think he would qualify as an amphetamine suspect….steroids work – bigger, faster, stronger really plays well across most sporting events.
Bonds’s numbers in 1993 relative to the league are comparable to his 2001.
Paul E., my point was not really to single out Aaron, greenies were an amazingly accepted part of most locker rooms. Mays, Schmidt… a whole lot of players took them, illegally because they were not individually prescribed in most cases, although I don’t think the players were so on to that aspect. There are countless stories of clubhouse coffee machines spiked with the stuff, bowls sitting on tables in the clubhouse filled with the little green pills, a drink called red juice… I mean, it was everyday stuff. My argument is not that one abuse excuses another, I’m saying that the people who ran the show were essentially telling the athletes, do it, it’s good for you, and it’s good for the game. And now, the righteously indignant are aiming their shots at the guys who were trying to do their best, in the way that they understood it, and essentially, according to MLB, legally. I don’t believe MLB will ever try to pin the tail on the players because that would open an investigation that would shed an unattractive light on both the Commissioners office and the individual owners.
Chris, this is one of my favorite articles of the year, so thank you.
A few comments:
@will hammons – What Rose and Jackson did was different from spitballs, greenies and steroids. They put themselves in a position to intentionally lose games. Jackson took money to play poorly, Rose could have gotten himself in a situation where he owed a gambler and had to throw a game to pay up. At the least, trying particularly hard to win one game may have cost him a later one – abusing a starting or relief pitcher, for example, making him less effective in a future game. Gambling on the game threatens the validity of what fans are watching, potentially turning MLB into the WWE.
@tc – If you’re blaming ownership and the commish, you have to blame the players, too. They’re the ones taking PEDs, even if the environment condones it.
@Sully – It’s good to see you around again.
shthar-
Well, according to James in The Politics of Glory, that’s not quite true: Yes on the “what people THINK happened,” but no on the “#s don’t matter at all.” As memory of the player as a player fades, the numbers matter more and more. FWIW, I’m inclined to agree with him on that argument.
PFS-
If it was both legal and within the rules of baseball, then no, I don’t care if a player used steroids. If it was either illegal or a violation of the rules, then I do care.
For the record, I am uninterested in putting either Canseco or Gonzalez in the Hall. McGwire has a good case, Palmeiro not as good.
Your Bagwell comment is pretty good snark, but not a very good argument. I’m not particularly a Bagwell defender, but I think JoePo lays out a reasonable case for him.
Steve I – To address your earlier post, yes, McGwire was using andro – a legal supplement – back in 1998, but he has admitted using (illegal) steroids during his career, too.
If the HOF were simply about numbers, then Rose, Clemens, Bonds, and McGwire would already be in bronze.
For better or worse, tho’, the Hall has always been seen—certainly by the voting press—as a
judgment on baseball character. Oh, yes, there were statistical thresholds that were best crossed: .300 lifetime batting average, 500 home runs, 3,000 hits, 300 wins. But, repeatedly, an inductee is weighed on, ahem, intangibles: ability in the clutch, presence (and production) in the postseason, durability, and exhibition of good citizenship.
A PED user (proven or apparent) is perceived by many as a bad citizen—for some voters a clear disqualification. The tar of bad citizenship has spelled HOF exclusion for Joe Jackson and Pete Rose, certainly, however fair. Being less than model human beings in some ways, though, didn’t keep Ruth, Cobb, Williams, and Mantle from being first ballot members of the pantheon (not that I’d have denied them their places there, of course). Luckily for Robby Alomar, his one intemperate (but much villified) moment was not enough for naysayers to cast a decisive shadow on an impressive career.
It’s a Hall of FAME, after all, not a Hall of Justice. The game, its fans and its journalists are certainly as prone to moral and political perspectives as the wider world. To many voters, numbers, however impressive, are almost beside the point.
I’m curious to see if the “let’s see what bubbles up to the surface” crowd softens up for Jeff Bagwell, since nothing “bubbled up” for him this year about PED’s. Isn’t that what the 1-2 year wait period is – a “punishment” for either not being Babe Ruth, or for some real (or perceived, in this case) infraction? It’s pretty clear to me that his steroid suspicion cloud is more an issue than some lack of longevity argument. With the more obvious steroid cases entering the ballot soon (Clemens, Bonds, etc.), how are people going to vote for them, and NOT a similarly-qualified guy like Bagwell? He’s on his way in.
Raines…I think he’ll climb more this year. His value becomes more obvious each year, and those voters who are used to filling in 5-6 names on their ballot will have to be giving him a hard look. Who else – Jack Morris? Please. Everyone’s had more than enough time ruminating about HIM.
Lee Smith, I’m a Cub fan, but he’s HOF toast.
I disagree that Bagwell is “similarly-qualified” compared to Clemens and Bonds. The latter two have career numbers (however they were achieved) that are inner-circle great. Bagwell was a terrific player and most likely HOF-worthy, but he’s not in their class.
Will Hammons,
I’m convinced that what the Hall is, is an offshoot of the Cooperstown Chamber of Commerce, tasked with throwing a a big party one weekend a year to fill hotel rooms and restaurants and being a tourist attraction the rest of the time. I doubt the Hall itself cares one way or another about “integrity” and “character” as long as there’s at least one inductee a year to have an excuse to throw that party. That’s all on the dithering BBWAA. The irony is, given that the “journalists” who make up the BBWAA routinely violate rules of journalism ethics by 1) making news themselves and 2) casting votes for honors and awards that routinely involve the transfer of tens or hundreds of thousands of dollars (bonus clauses for MVP and Cy Young, vastly increased prices for autographs and personal appearances for HoFers)—clearly a conflict of interest—the BBWAA’s moralizing over steroid users is hypocritical at best.
@Greg Simons- I think most everyone agrees that Rose and Jackson are a separate case. As much as I hated to see Rose’s career flushed, by doing so it gave baseball an air of integrity, maybe just a veneer, but it made the game look like it stood for something. MLB needs to clear the air on the steroid era. Since they can’t vilify the players, because of course they would then have to share in the vilification, they need to clear everyone prior to the drug policy and instruct the HOF voters that PED use cannot be considered and that if voters don’t vote in the normal way, they will lose their right to vote. Many people will not like this, I don’t, but this shadow game we’re playing makes no sense. You just can’t be talking about Bernie Williams going into the HOF while McGwire is in no where land. This goes to the integrity of the game, but also to the sense that baseball means something, stands for something, and I guess that something would be fairness. We can sit here all day arguing about who got in in the past and what they did but in the end, baseball had no clear policy and to hold the players feet to the fire only is simply not fair.
To say that someone took steroids to “recover from an injury”, and that constitutes a pass or lighter scrutiny on steroid use is absurd. The quicker recovery from injury is one of the chief advantages steroids can give its user. If used only for that purpose, that should still bring down all the same penalties as if it were being done purely to bulk up. The idea is that the user is on the field performing when he otherwise would not be and those not using are not.
The Hall of Fame is schizoid at best. Ty Cobb was voted in despite being a racist who had beaten a man with no hands in the stands of a game. The man had called him a “half-ni****” and Cobb nearly killed him. The commissioner at the time BANNED him for LIFE. Until the Tiger team went on strike. Cobb was soon back in the game. Then there was the womanizing, alcoholic great Babe Ruth seen by writers at the time running naked from a woman waving a knife. He is a hero of the hall. Betting on the game cost Jackson and Rose suspensions that were never lifted. But it was OK for Ford and Gaylord Perry to alter pitches (cheat) and enter the hall without problem. As for the Amphetamine use in baseball in the 60-70’s Jim Bouton wrote that they actually didn’t make a player better, they simply made him FEEL that he was better and he often under-performed. That leads to steroids. It did enhance performance thereby altering the outcome of games. This is what Rose and Shoeless Joe were accused of. IF the steroid era players get in, shouldn’t everyone? The problem with the Hall of Fame is, simply, no one knows what the hell it is. Is it a small hall(Mays and Mantle) or is it a large hall(Mazeroski and Rice)? Does it punish cheats (Rose and Joe Jackson) or let them in (Ford and Gaylord Perry)? Is it a moral arbiter keeping steroid-users out? Or can anyone (Cobb and Ruth) get in no matter how they behave? What bothers fans about the Hall is not the standards, but rather the lack of them. The mood of the moment is the arbiter for the Hall, and that simply creates confusion and frustration.
Sure, ok Gerard, one of the purposes of amphetamines was to help achy and injured players perform better(albeit minor injuries). Want to open that can of worms? Seriously, this is an argument of ifs and buts. Either we swallow what happened or drown in a thousand qualifications that really will never end. Sport science will continually provide new challenges to our sense of fairness. If the sport in question is not clear on what is acceptable, an after the fact witch hunt will occur. The sport must lead, are they guilty or not. I think MLB has no choice but to say not guilty.
if Bagwell, Raines don’t get in now then it’s over for a while as the next few years have excellent candidates even with Clemens, Bonds and Sosa not getting in.
Talking about stats and the hall of fame is really a waste of time.
That’s history. And history isn’t what happened.
It’s what people THINK happened.
IF enough writers think a guy is a hall of famer, he goes in.
If not, then #s don’t matter at all.
tc:
Amphetamines beat you down….‘roids build you up. If you want to say those 1960’s enthusiastic, amped-up bubble gum chewers were addicts – fine. But, if you’re using steroids you’re addicted to the performance aspect-the results that made the post-1993 modern day ballplayer wealthy beyond Marvin Miller’s wildest imaginings
Very well said, tc.
It’s a bit sad that the comments section of an article about the HOF candidates had morphed into a discussion of PEDs, cheating in its various forms and how that has impacted the game’s history, but that’s where we are these days.
I can’t wait for pitchers and catchers to report.
I have been thinking about baseballs problem for quite a while and this latest issue, steroids, has only increased my feeling that MLB needs to address its splintered history. When I was growing up in the ‘50s and ‘60s, baseball was still THE game. People believed in the purity of it’s history, its records. When I was a boy we listened to the World Series on the radio in my elementary school classroom, it was so central to American life. Its heroes had not yet been humanized, Mantle and Mays were giants, in every way. But of course, it was all a ruse. There never was a purity of records because baseball was truly, even then, historically divided into eras. There was the 19th century era, the deadball era and liveball era. We had not yet accepted at that time the notion that overlaying the 20th century was the pre-race and post-race eras. Even the pre-spitter and post-spitter era must be accounted for. And then baseball went from 154 games to 162 games and Roger Maris hit 61 homeruns and the arguments began. Baseballs supposed purity was gone. Maris never broke Babes record. He needed all of those extra 8 games to tie and “break” it and he needed 9.7 to Babes 9.0 HR per AB. What he established was a new record, a record for another era. But people wanted that race between Mantle and Maris and so even though the “wrong guy” won, you couldn’t have all that fuss for a non-record, could you? And now we have I guess what we’ll call the steroid era and 73 HR from Mr. Bonds. I believe that we have to stop pretending that baseball has a pure history. Look, Babe’s record occurred because MLB juiced the ball to regain fan interest. One could deride that achievement, as I believe a lot of the older, deadball era players did, but what good did it do them. The Babe became one of the biggest heroes in sports history and his records dominated the game. But if he had played during the dead ball era, would he have achieved those same heights? I think Ty Cobb would still be considered the greatest if MLB had left the ball alone, kept the game pure, although Willie Mays might have surpassed him. I think we have to stop thinking there is “A” record. People think players have improved because of the constant assaults on old records but that is false. The challenges that deadball baseball presented would have kept many a modern major leaguer in the bushes and the same can be said in reverse. It was a different game then and should be honored as such. All of baseballs different eras should be seen in that way. There are no pure records and what was accomplished during the steroid era, or as I think of it, the 2nd juiced ball era, should be seen in the same way. McGwire, Bonds, Sosa and Clemens played the game the way that it was presented to them. They should be in the Hall of Fame. Sorry for the length of this.
But, Gerard-
Aren’t steroids sometimes prescribed post-surgery even now? (My sister had knee surgery 20 years ago, and she had a six-week prescription for steroids as part of the recuperation protocol.) Should ballplayers have to forego a recognized medical protocol because of their occupation?
Alan Trammell was better than Barry Larkin.
Pat Gillick says “I have personally brought this up a number of times to different baseball people, front office people, owners, coaches, managers, players that knew of our time,” Tony La Russa, the now-retired legendary manager, told me when we spoke a few nights ago. “I cannot believe the lack of support that Alan is receiving. “Trammell was probably one of the most all-around defensive and offensive shortstops in the American League in the late 1970s and 1980s.” That era included Cal Ripken, elected to the Hall in 2007 with 98.5 percent of the vote. It included Robin Yount, elected to the Hall in 1999 with 77.4 percent of the vote. It also included, over in the National League, Ozzie Smith, elected in 2002 with 91.7 percent of the vote. Trammell, now in his 11th year on the ballot, checked in at only 24.3 percent last year. And that was a good year. It was up from 22.4 percent the year before, and 17.4 percent before that. La Russa argues vehemently that Trammell is a slam-dunk Hall of Famer. Would he have traded Trammell for Smith straight up? “That’s a tough one,” Gillick said. “That’s a real tough one.” No question, Ozzie is a Hall of Famer. Now. If you agonize like that over whether to trade a legit Hall of Famer for Trammell … there’s your answer regarding Trammell’s Cooperstown qualifications. Trammell clobbers Smith across the board in nearly every statistical offensive category. It’s not even close. Defensively? Even if you favor Smith here, the difference between him and Trammell is nowhere near the chasm their Hall voting totals suggest. “They’re two different type of players,” Gillick said. “That’s the difference. Yount, Ripken and Trammell were offensive shortstops. La Russa said. “Just to admire his mechanics, how you catch a ball, exactly how you teach. Hands low and out front, his over-the-top throw. Almost without exception, he’d hit the first baseman with the throw between the chin and his waist. “It was remarkable how accurate and true his throws were. You can talk offensive stats that were impressive, he was a dynamite defensive player, and he was a clutch player and leader.” “And the fact that he not only was a good offensive player and an excellent defensive player, he also was very, very talented in the field—he knew how to play the game, knew what to do in situations.” La Russa said he ranks Trammell alongside such luminaries as Ripken, George Brett and Kirby Puckett—all Hall of Famers—and a few others. Yet … 24 percent of the Hall vote last winter? When contemporaries with whom he was on the same level long since have been inducted? “Basically, if you ask 10 people to rate Ozzie, Trammell, Yount and Ripken, you’d get some consensus,” Gillick said. “But I don’t think everyone would have the same ratings 1 through 4. I think one would prefer one over the other, and someone else would prefer one over another.
A question about Bonds. The second book about Bonds and steroids came out in Dec. ‘04. I don’t know when testing was ramped up, but was Bonds still using when he still had two good years (‘06 and ‘07) left in him? Was he that stupid or that lucky?
Steve I – those are different steroids. Post-surgical steroid prescriptions (or for inflammatory injuries like many back issues, something I have unfortunate experience with) are typically corticosteroids, which don’t build muscle and to my knowledge are not banned by any organization. The banned PEDs are anabolic steroids.
It’ll be interesting to see Chris’ prediction next year for Jack Morris with effects #2 and #3 from this article fighting against effect #4.
On my hypothetical ballot, I would have voted for Morris this year (helped by some home team favoratism perhaps) but doubt that I’d have room on my ballot for him next year.
I wonder if guideline #9 needs to be revisited. In other words, was Juan Gonzalez falling below 5% an isolated case or is there a pattern of guys slightly over 5% losing their support since it looks like such a lost cause.
Thanks Yinka!