On “Weaver on Strategy”
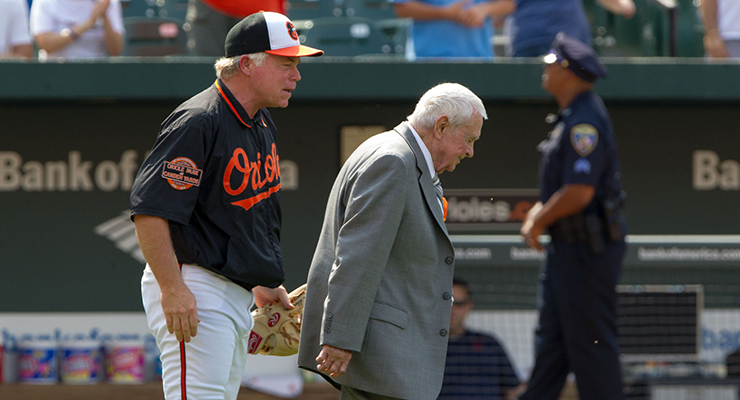
Earl Weaver was good at arguing with umpires and there was a strategy behind it. (via Keith Allison)
Earl Weaver was not only one of the most successful managers baseball has known, he was also one of the most distinctive in managerial style. Weaver was known to scorn the sacrifice bunt and other one-run strategies, basing his teams instead on “pitching, defense, and the three-run home run.” He also had frequent and entertaining run-ins with the umpires, leading to nearly 100 ejections in his career.
When he retired as Baltimore Orioles manager after the 1982 season, Weaver went to work with sportswriter Terry Pluto on a book. That volume, Weaver on Strategy, was a deep look into how Weaver approached a wide range of baseball situations, explaining his philosophies in detail seldom seen before or since.
Weaver on Strategy is, for my money, in the top tier of baseball books. That doesn’t mean, of course, I have to take everything it says as the final word. I’ve been known to pass a critical eye over classic baseball works before. I have learned no such book, even the best of them, is guaranteed free from errors, sometimes quite big ones.
With that attitude in mind, I did a study of Weaver on Strategy. I wanted to see how his declarations stood up to scrutiny and whether his game philosophies had firm foundations beneath them. I didn’t examine every detail of his strategies and declarations but went after those that piqued my interest. I wanted to see whether I could trust Weaver with the big picture and in the small stuff. Looked at that way, you could say I got two separate answers.
Number Games
Earl Weaver was not bound to a set lineup. He would shift players in and out of the starting nine, and up and down in the batting order, on a daily basis. Strongly informing his decisions were head-to-head batting records. If you’d hit a pitcher well before, you’d see him again. If you had struggled, you’d sit.
 “In theory,” Weaver observed, “a batter should have 20 at-bats against a pitcher before you can get a true reading on how he will do.” He made clear, though, he would act on shorter track records when results were clearly good or bad. Today’s sabermetricians reach for the antacids when they contemplate acting on such small sample sizes. Weaver’s digestion was different.
In the examples he gave of telling head-to-head records, however, his memory proved shockingly fallible. One can quip that he had left all the statistical records behind in his manager’s office when he retired. He (and Pluto) should have double-checked, or leaned less on his memory, because the mistakes undermine a case for his tactics that already would be considered highly dubious today.
The anchor of his case is how Boog Powell fared against Mickey Lolich. In separate chapters of the book, Weaver said Powell went 1-for-61 and 2-for-61 against Lolich, a minor and forgivable slip. “That is something that never changed, and it never was going to change,” he said. That was why you gave your big first baseman a day off when Lolich got the start.
Except Powell wasn’t 2-for-61 against Lolich. He was 16-for-90 lifetime, slashing .178/.211/.278, which is quite rough but not all ashes and bitter tears. In the years Powell played under manager Weaver, 1968 to 1977, he hit Lolich 13-for-70. Breaking down his yearly performances, there is no stretch in those 90 ABs when Powell could have been 2-for-61 or particularly close. It’s hard to see where Weaver got such dire numbers.
His recollection was wobbly in positive territory, too. “Mark Belanger hit well over .300 against Nolan Ryan and Jim Kern,” Weaver stated, “but he was barely a .200 hitter against the rest of the league.” (The latter claim is a slight exaggeration, but only slight.) Belanger did wallop Kern to a 10-for-16 tune. Calling this “well over .300” is faint praise. Against the Ryan Express, though, Belanger went a lifetime 12-for-48, slashing .250/.367/.271. That’s not close to .300 and not that far from his career .228 batting average.
Belanger’s record against Ryan was a topic because Weaver faced Ryan’s California Angels in the 1979 ALCS, and he batted Belanger second when they faced Ryan. (Just to be thorough, Belanger’s lifetime BA against Ryan through 1979 was .255. His .351 OBP, though, may have been the real motivator for putting him second.)
Weaver broke down the first game of that series, from his lineup choices through each inning, to show readers his thought processes. His rundown, though, showed a shocking memory lapse when he stated, “This was [Ryan’s] first inning in postseason play.”
No, it wasn’t, and of all people Weaver should have known that. Ryan threw seven innings of winning relief in the New York Mets’ 1969 NLCS-clinching Game Three against Atlanta, then carded a seven-out save in Game Three of the World Series—against Weaver’s Orioles! I can understand why Weaver might wish to blot out that memory, but still…
Late in that same game, the Angels made a move opposite Weaver’s own style: They sent in a relief pitcher, John Montague, who had a lifetime ERA against Baltimore above 8.50. What did Weaver think of that? “Sometimes that means you own a guy,” he said. “But stats have a way of turning around on you. Just because you hit a guy in the past doesn’t mean you will definitely do it again in the future.”

Even with the temporizing phrasing of his statement, Weaver is effectively negating his own philosophy of leaning on past samples as a guide to future performance. Either those numbers matter or they don’t, but Weaver hedges here. In the event, his Orioles beat Montague with (what else?) a three-run homer in the 10th, so it isn’t like Montague proved a counter-example.
Perhaps Weaver was trying to maintain narrative suspense? That would explain another pair of mistakes he made.
In a later passage, Weaver talks about two games in which he started thinking too far ahead and made blunders because he wasn’t paying attention to present developments on the field. Remarkably, these two games happened within a week of each other. Perhaps also remarkably, he made errors in recounting the scores of both games.
In the early game, he ordered an intentional walk to a Minnesota batter who, two pitches in, he realized was on deck and not at bat. He scrubbed the free pass, but the batter walked anyway, and the next Twin knocked in a run in a game Baltimore would lose by one.
Four days later, with bases full of White Sox and nobody out, a batter hit a tough grounder to the Orioles’ third baseman. Weaver, assuming a play to first that would thus leave a base open, pulled his pitcher, intending southpaw reliever Scott McGregor to walk the righty due up next to get to a lefty. Somehow, Weaver had forgotten his third baseman was Brooks Robinson, who cut down the lead runner at home. With the bases still jammed, McGregor had to pitch to the righty, who whacked a three-run double. Baltimore would lose by three.
The hitch both times was that Weaver mis-stated the score when he pulled both boners. He had Minnesota leading 1-0 at the time of the semi-intentional walk when it was really 2-0, not as close. On Brooksie’s play, he wrote that the score was 4-4, when it was actually 4-0 Chicago. The final scores he did get right.
The similarity of both errors is intriguing. Each time, Weaver recalled his team being in a tight game before his managing blunders, down one and tied rather than down two and down four. It seems the mistakes gnawed at Weaver, and he recalled them as more damaging to his team’s chances than they had been.
There’s a pretty good reason why. His Orioles finished 1977 two and a half games behind New York in the American League East. Had those two losses been victories—no sure thing even with his missteps erased—Baltimore would have been just a half-game back. A make-up game against Boston would have been necessary, and had the Birds won that, they would have had a one-game playoff with the Yankees for the division (just as the Yanks would with Boston the next year). That’s a good number of ‘ifs,’ but enough to prey on a highly competitive, and thoughtful, manager’s mind.
Numbers got fudged again when Weaver recounted times he stuck with players whose seasons began ice cold. He recalled Rich Dauer going 1-for-44 to begin 1977. The actual 1-for-41 isn’t far off, and is quite scary enough, but is still a mild miss. More notable to modern fans would be Cal Ripken Jr. finishing the April of his rookie year batting .089—if he had done so. The real figure was .123. There was no time that season when Ripken was at .089. Both times, Weaver remembers the stats as a little worse, making him appear a little braver for sticking it out.
(To be fair, he also recalled how he stuck with Don Buford for the entire 1972 season, where his bat never came around. He trusted the lifetime numbers and kept giving him opportunities, but “for once my stats were lying to me.” Baltimore’s string of three straight pennants snapped, and Buford never played in the majors again.)
Weaver didn’t believe too strongly in clutch hitting. “I’d say a good clutch player is usually a good player to begin with,” he declared. Still, he did cite Brooks and Frank Robinson as “two of the best hitters I’ve ever seen from the seventh inning on,” even though “they were good hitters any time.”
There was no special reason to cite Brooks: His lifetime tOPS+ (ie., measured against himself) in the seventh to ninth innings was 99, with a perfectly average 100 in extra innings. Frank was a different matter. He had a 104 tOPS+ in the seventh to ninth and a standout 113 from the 10th onward. Those are the kinds of numbers that can make you believe in clutch hitting, though not enough to get Weaver to separate Frank from Brooks.
As someone who liked digging into statistical breakdowns, Weaver seems tailor-made for today’s era of information overload. The problem is, you have to get the stats right for them to be useful for you. I suspect he did while still managing, but his looseness with them in this book, usually in a direction making things look more dramatic, causes one to wonder.
Appropriate Anger
If you’re a fan of red-faced, nose-to-nose arguments with umpires, Weaver may be your poster boy. My 2014 series on manager ejections—inspired in part by reading Weaver on Strategy—had a fair amount of material on Weaver getting tossed out of ballgames, which I won’t rehash here. Much.
One thing worth revisiting briefly is the method, or methods, Weaver offered for his madness. Half his ejections, he said, were interventions when his players were arguing with umps. He’d take over the argument and get ejected in their stead, because losing the player would hurt the Orioles while losing him wouldn’t. The other half were his own disagreements, argued less to get a call changed than to keep umpires’ noses to the grindstone and hopefully avoid losing a game on a bad call.
Looking at a table of the dates of Weaver’s ejections given in the book, I discovered something I never thought to look into during my old series. You may know Weaver’s teams improved as the season wore on, playing better with each month over the course of his career. I found that he also got ejected from games with more frequency as the season progressed.
| Month | April | May | June | July | August | September |
|---|---|---|---|---|---|---|
| Ejections | 7 | 11 | 14 | 23 | 22 | 20 |
Note: The regular-season ejection numbers add up to 97, three more than Retrosheet’s total for his career, which I used in my old ejection study. I won’t worry about that discrepancy right now.
Why would the numbers climb this way? Part of it, but only part, is that Weaver had two partial seasons of managing that began on July 11 and June 14. I can also note that, over his career, Weaver tended somewhat to get tossed more in seasons in which his Orioles had better records. Perhaps whatever caused that correlation year to year also caused it month to month, meaning Weaver got the thumb more as the season progressed and his team got hotter. That certainly would not be an indication that anger was getting the better of him. Most people are angrier when they lose.
Another area Weaver claimed control over his temper was the matter of beanballs. Weaver spoke forthrightly against them in his book, saying he’d always done so as a manager, deploring them as dangerous and inexcusable. He claimed to have always discouraged head-hunting, and I found the statistics backed up his claim.
Not once in his 15 full seasons did an Earl Weaver team exceed the MLB average for HBPs by a team. Three times they were at less than half the league average. Now, part of this is because his pitchers had good control. His teams’ average BB+ rate for the same period was nine percent under the AL average. Does this, by itself, account for a HBP+ of two-thirds the MLB average? I think not. Weaver’s stance was more than just talk.
Sidebar: Billy-bean-ball
I cannot resist a digression here. In trying to suss out how much walk rates influence HBP rates, I looked at a near-contemporary of Weaver’s whose beanball tendencies went the opposite way: Billy Martin. I wanted to see if Martin’s (higher) HBP rates tracked with the control of his pitchers.
The conclusion I reached with Martin was the same as I reached with Weaver: There’s some effect, but not nearly enough to explain the HBP rates by themselves. Martin’s pitchers had slightly better than average walk rates, but they still often drilled batters at rates well above average.
There was, however, one remarkable and persistent exception. It came whenever Martin managed the New York Yankees.
Younger fans may know Martin only for his five tempestuous terms as Yankees manager, but he also had stints with the Twins, Tigers, Rangers, and A’s. Eight of the 12 years he managed a team all or most of a season (cutoff at 80 percent), it was for someone other than New York. In those eight years, the fewest HBP his team had was 30—or 28 if you count the 1981 strike year, when his A’s were on a 162-game pace of 42 plunks.
In Martin’s four full or almost-full years in pinstripes, the highest HBP count the Yankees reached was 22.
| Year | ’69 | ’71 | ’72 | ’73 | ’74 | ’76 | ’77 | ’80 | ’81 | ’82 | ’83 | ’85 |
|---|---|---|---|---|---|---|---|---|---|---|---|---|
| Team | Min | Det | Det | Det | Tex | NYY | NYY | Oak | Oak | Oak | NYY | NYY |
| HBP | 38 | 49 | 47 | 30 | 40 | 17 | 22 | 31 | 28* | 30 | 20 | 13 |
A little of that may come from having better control pitchers in the Bronx, but not much. His 1974 Rangers and 1976 Yankees had almost identical league-adjusted walk rates, but the Rangers plunked 40 batters and the Yankees hit 17. A little may come from the mellowing of age, as Martin’s four highest totals came in his first five years, before he ever managed in New York—though he un-mellowed in his late Oakland years.
The main cause is that managing the Yankees made Martin behave, at least relative to his own baseline of volatility. I saw an indication of that in his ejection rates, getting tossed over a quarter less in New York than his career pace. At the time, I attributed this to his getting ejected less when his teams were winning, and he mostly won with the Yankees. With this added information, I now believe it was not just the success, but also just wearing the pinstripes.
Was it due to the culture of professionalism in the Yankees organization, established in the 1930s by manager Joe McCarthy and widely derided as corporatist conformity in later decades? Or was it that Martin reached the majors with New York, had his greatest playing success there, and formed lifelong bonds there? In short, was it business, or was it love?
I’ll let you form your own conclusions. I have mine.
A Royals Pain
Weaver’s preaching of homers and the big inning is well-known, but it was not without caveat. He himself saw a weakness to it: other ballparks. “There’s one ballpark in the American League where it would be a mistake to try and go with power,” he wrote, “and that’s Kansas City.”
With deep fences at Royals (now Kauffman) Stadium, along with artificial turf, Kansas City’s home muffled Baltimore’s power advantage and played to its own, speed. Weaver admitted that, had he managed the Royals, he would have had to emphasize speed rather than wait for the big bomb. As it was, he lamented “…our record against Kansas City [at KC] was horrendous…”
Yes, I checked this. No, Weaver’s memory didn’t pull a Boog Powell on him here.
Royals Stadium opened in 1973. For the 11 full years Weaver managed the Orioles while the Royals played there (1973-1982 plus 1986), Baltimore was 40-24 against KC at home—but 22-39 as visitors. This .264 differential in winning percentage is higher than for any other team Weaver faced, the Chicago White Sox being closest at .234. (Perhaps not coincidentally, Comiskey Park had artificial turf for seven of Weaver’s managing years.) Weaver’s diagnosis was correct.
Not that he didn’t have some skepticism about Kansas City’s playing style. He voiced it indirectly, in comments about their famous longtime hitting coach, Charlie Lau*. Lau, praised by players up to George Brett, was an evangelist for hitting for average rather than power.
* Also spelled “Charley.” I’m going with how Weaver spelled it.
“That’s OK for some guys, but not everybody,” said Weaver. “But when Charlie was with a team that hit a lot of homers, they won. When he was with singles-hitting clubs, they lost.”
This has a tang of sour grapes. Lau’s first year as a coach was with the Orioles in 1969, in Weaver’s first full season managing. (According to Retrosheet, Lau was their bullpen coach. Interesting.) Lau’s success and fame elsewhere may have made Weaver defensive about letting him get away.
Numbers, though, give Weaver some support. For every team on which Lau coached, from 1969 to 1982, I tracked winning percentages and rates of singles and home runs hit, adjusted to the American League. (All Lau’s teams were in the AL.) When Lau’s teams’ winning percentage rose, their rate of singles fell, though with a weak 0.0668 R^2 coefficient. When winning rose, home run rates rose, with a 0.3771 R^2 that shows a real, if moderate, correlation.
Perhaps Weaver shouldn’t have been quite so dismissive of singles hitting, but we already know he wasn’t daunted by small sample sizes.
Big Blasts and Late Innings
I’ve put off examining Weaver’s most famous claim, but no longer. Weaver considered the three-run home run his best friend as a manager, but did his teams really specialize in producing them? The short answer is yes and no.
Weaver’s Orioles hit over 22 percent more three-run homers than the average MLB team, but that is because they had over 21 percent more homers overall. As a percentage of all home runs, Baltimore was barely ahead of the league average in the three-for-one shot.
| HR TOTAL | Solo | 2-R | 3-R | GS | |
|---|---|---|---|---|---|
| MLB | 47993 | 56.81 | 29.39 | 11.51 | 2.29 |
| Baltimore | 2333 | 55.55 | 29.40 | 11.62 | 3.43 |
This doesn’t mean Weaver’s philosophy of filling up the bases to be cleared with one swing didn’t pay dividends. It just did so in rarer circumstances. The percentage of homers that were grand slams was half again as high for Weaver’s Orioles as for the whole league. (This despite his 1969 squad, maybe the best he ever had, hitting zero.) This pushed Weaver’s teams from less than one percent ahead of the league on proportion of three-run homers to nine percent above league average on homers of at least three runs.
He was probably sensible not to make this his selling point. Playing for the grand slam smacks of desperation or wishful thinking, akin to making a trip to Las Vegas part of your investment portfolio. (Go to Reno instead. I speak from experience.)
This strategy depended not just on sluggers but on baserunners for the sluggers to drive in. This was indeed a huge emphasis for Weaver. Bill James noted that Weaver had been excellent at drawing walks in his minor-league playing days, which carried over to managing. (Lest you think too much determinism is at work, Weaver the player hit almost no homers.) Chris Jaffe’s tome Evaluating Baseball’s Managers found Weaver the fourth-best manager all-time for drawing walks.
With his emphasis on walks and power, Weaver almost seems the true inventor of Moneyball, Billy Beane’s famed plan to keep his Oakland A’s in contention on the cheap. But really, Weaver did Beane one better. Beane’s methods sacrificed defense as too expensive a skill to pursue. Baltimore, despite not being a big spender and thus losing players to the dawn of free agency, had incredible defense while Weaver managed the team. There was some luck to that, such as inheriting Brooks Robinson, but Weaver built on that luck. Jaffe’s volume found Weaver to be the best manager in history for fielding percentage and for DER (Defensive Efficiency Rating, essentially the reverse of BABIP).
In one sense, with his Moneyball-Plus method, Weaver feels like the most modern of managers. He accomplished his goals, though, with a roster construction that could scarcely be further from modern practice. His ideal roster had nine pitchers—yes, nine—and 16 position players. That gave him seven people on his bench, eight before the advent of the DH, and even more after September call-ups, which he loved using.
This huge reserve let Weaver make all sorts of lineup maneuvers and implement all sorts of platoons to squeeze out edges in hitting and fielding. He specifically boasted about one that came shortly before his first retirement. “In 1982 we used Benny Ayala, John Lowenstein, and Gary Roenicke in left field. They combined to hit 37 homers, which is the same as having a Reggie Jackson in the batting order.”
I looked over their 1982 stats. All told they had 994 plate appearances and 51 home runs, but that’s because they played more than just in left field. For only their left field work, they combined for 624 PA and 36 homers. That’s one off Weaver’s stated total, and given how his method judging who’s a pinch-hitter and who’s a defensive sub may differ from Baseball-Reference’s, I don’t mind calling that a match. So for a reasonable length of season, they did as well as Weaver advertised. Given their combined left-field slash numbers of .289/.393/.557, they probably did better than advertised.
Still, it was three players doing this, not one, which even he admitted was two more than you’d like. You wouldn’t and couldn’t see such profligate use of bench players on a current team. All the roster space has shifted to the pitching staff. All the matchup-making has shifted to relievers with specific roles, not position players with specific roles as Weaver had fashioned it.
This leads to a big question: Is a full bullpen a better way of leveraging your non-starting players than a full bench? Was Weaver a dinosaur in this respect, or have modern teams turned down a blind alley?
The argument for both systems is that it gives your team an advantage in high-leverage situations and lets you win the close games. Weaver’s career record in one-run games was .574 compared to his overall mark of .583. Given that one-run records should regress strongly to the mean, this looks very good for Weaver.
But take a fairly contemporary manager, Whitey Herzog, with different philosophies: a speed-oriented offense that played to manufacture runs and an emphasis on relievers rather than starters. Herzog’s career record was .532, but in one-run games this rose to .537. In his own time, it looks like Weaver’s way was behind the curve.
Now, one-run games may not be the best definition of a close game. They can have wide leads that only narrow at the end, which limits the span of high leverage. I decided to look at different definitions: games that were tied through eight and games that went to extra innings. The two situations are mathematically equivalent. If either team “wins” the next inning, it wins the game; otherwise they play another inning.
I tallied Weaver’s records in both types of games (which do have substantial overlap) for all his full-season years as Orioles manager. His record in those full-season years was .586, a shade higher than his overall .583. For tied-through-eight games, his record was 161-113, for a .588 percentage; in extra-inning contests, it was 143-106 and .574. Not only does Weaver still resist regression to the mean, but for games tied after eight he even exceeds his overall winning percentage.
I put Herzog to the same test for the 13 full years he managed, at a .548 clip. His record in games tied through eight was 114-110, just .509. In extras, though, he spiked to 127-105, a .547 percentage. Whitey’s previous edge over Earl is negated by that through-eight figure, but I cannot quite say that it’s reversed.
Neither manager’s style shows a clear edge. Weaver’s method, with lots of bench players, holds even or maybe better against a manager who went with relievers—and whose team was better built for the one-run strategies that become crucial in late-and-close games. If Weaver’s way kept pace with that, perhaps his eight-man benches could keep pace with today’s eight-man bullpens.
It would take a revolutionary manager with remarkable guts and staunch front-office backing to dare such an experiment today. That, or it would take a massive philosophical shift, walking back the previous movement over the same span of decades. Either way, the odds are long that we will ever see another manager construct a roster the way Weaver did.
Conclusions
Analyzing Weaver on Strategy produces diverging verdicts. On the larger scale, Weaver’s baseball principles were backed up by performance. His teams produced a surplus of big, game-breaking homers, even if not of the three-run variety. His principles on beanballs were borne out every year he managed. His concentration on bench flexibility at the expense of pitching staff depth produced records in tight games that defied expected regression to .500. He was even accurate when admitting the occasional limitations of an offense based on power.
It is in the more anecdotal details that things break down. Too many inaccuracies in smaller statistics and recounting of games get past Weaver and Pluto. I have to cite both men here: The faulty recollection is Weaver’s, but Pluto had a responsibility to confirm the claims in a book that went out under his name as well as Weaver’s.
The trends of those inaccuracies, toward more extreme splits and tighter games, suggest a reason for the mistakes: making events look more dramatic for the book. Was this unconscious by Weaver or calculated? Given his ability to tell tales against himself, I lean toward the former. Were these dramatic figures and anecdotes “too good to check” for Pluto? Maybe, or perhaps he was more concerned with getting the book out in a timely manner, while the just-retired Weaver was still in the forefront of baseball fans’ minds.
If you are depending on Weaver on Strategy for accuracy in statistical minutiae, you’re in trouble. If you instead take a step back and view the broader picture it paints, it fares far better. Weaver comes through as strongly engaged in the full range of on-field tasks a manager needs to perform, from spring training to World Series. He had plans, he executed those plans, and his teams won until the very last year of his career. He was highly important in his era, and his ideas are still relevant in this era. As long as you don’t read it with a microscope, Weaver on Strategy still matters.
References and Resources
- Baseball-Reference, including the Bullpen
- Retrosheet
- Chris Jaffe, Evaluating Baseball’s Managers
- The Bill James Guide to Baseball Managers
- Bruce Markusen, The Hardball Times, ”Cooperstown Confidential: The Tale of Charley Lau”
To give you an idea of his attention to detail, Weaver invented a tactic that was later banned by MLB. As Weaver told it in the book, suppose an opponent were starting a left handed pitcher. He would counter by putting in a right handed hitter in the 5-6-7-8-9 position, say Andy Etchebarren rather than Elrod Hendricks. But wait! Suppose that pitcher got knocked out in the first or second inning and Etchebarren had to face a right handed reliever. No problem. Instead of inserting Etchebarren int the lineup, he would insert a pitcher, say Dave McNally, to play catcher. As Weaver told it, McNally could have been 1000 miles away. Once his turn at bat came up, Weaver would then substitute Hendricks or Etchebarren depending on who was pitching. Sound crazy? Sure. But Weaver justified it by saying that in a tight pennant race, every detail counts. Weaver said that MLB caught on to this gimmick fast and stopped it.
Dennis, I don’t recall him doing this for the catcher position, but he most definitely did it, and wrote about doing it, for the DH. MLB did indeed rewrite the DH rules to prevent this. All managers could have used this trick, but with the way Weaver stocked players on his bench for situational use, the banning of this maneuver probably hurt him more than most. Weaver thus had cause to be as miffed about the ban as he was.
This is not true.
First of all, this phantom player cannot be used if the starting pitcher gets knocked out in the second inning because someone would have to play the field in the bottom of the first. Second of all, the rule that was changed only applies to the DH (the DH must bat once before he can be substituted). Finally, the DH CAN be substituted before he bats once if the opposing team changes their pitcher.
Supposedly Weaver used this only with a DH and in order to choose a batter based on whether there were runners on base. Basically his use of the phantom DH was almost worthless and not worth MLB changing the rules. And if they wanted to accomplish something by changing the rules, they should not have allowed a substitution even after the opposing pitcher was changed.
As a caveat, this trick could only be pulled if the O’s were playing away.
” In the years Powell played under manager Weaver, 1968 to 1977, he hit Lolich 13-for-70.”
A single at -bat error, if I may: In ’75 & ’76, Boog played for former teammate Frank Robinson and the Indians. On July 26, 1975, Powell came in for 1B Rico Carty in the 8th, dropped Ron LeFlore’s foul-ball and later, against Lolich, flew out to LF Ben Oglivie. No damage, Dennis Eckersley shut out the Tigers on seven hits.
As Lolich was in the NL with the Mets in 1976 Powell and Lolich did not go belly-to-belly then. Powell was with the Dodgers in 1977 (Lolich sat out that season to run a donut shop in Detroit), July of 1975 was Boog’s only appearance vs. Lolich post-Weaver.
Weaver was fortunate in working for the Orioles, a strong organization who had good people and for many years kept them in place. I read a comment talking about the minor league system, how they worked together and the goal was to “get them ready for Earl”. This shows the security he had and he could use various strategies knowing he had job security and didn’t have to worry as much about his job.
To show how good a manager he was, in 1973 he had an Oriole team that led the American League in stolen bases. Still had the good pitching and defense, but not a lot of power, yet he took that team to the 5th game of the ALCS that year.
Shane,
The nice-than-warranted comments on Rich Montague, managed by Gene Mauch, were likely simply being nice to a living player and living (still active) manager. Weaver was simply being gracious to his opponents, a trait more people could use in the current age.
Many thanks for this article. I’ve read two of the other Weaver books, but not the …Strategy. I’ll have to try to dig that up.
To expand on the roster construction theme, it seems another of his axioms was the “loaded gun” – keep a more-or-less regular on the bench for pinch-hitting purposes. Did you do any research on Weaver’s ph record vs. league ph record?
Also, where can I find some of your sci fi articles?
David, I didn’t dig into comparative pinch-hitting records, but now maybe I will. A quick first dip provides some bracing numbers. In 1982, Weaver’s last year before his (first) retirement, his team had a 113 sOPS+ rating, hitting 13 percent better than the average. For Baltimore pinch-hitters that year, the sOPS+ was 153. That is quite an improvement. (The O’s pinch-hitters actually batted worse than team average, as we’d expect, but they dropped far less than the average team did.)
As for my science fiction, my eponymous website (shane tourtellotte dot com) has a lot of my old stories posted, plus the one fact article I did for Analog not all that long ago. The site is getting old and dusty, much like my SF writing, but both could get revived, if I get the time and the inspiration.
Getting away from an 8 man bullpen is certainly possible. The assumption behind this is carrying 3-4 extra relief pitchers wins more games than 3-4 extra bench players. That assumption is questionable. I think this dates back to La Russa with Oakland. The thing about La Russa is he had a 4 1/2 man rotation, so half the time he only had 4 starting pitchers, and since he was the only one looking for useful short relievers he could get all he wanted on the cheap. It also helped that his starters could eat innings so he didn’t need to use his bullpen as much. Once everyone started doing this, it reached diminishing returns quickly especially since the goal seemed to change from “have a better bullpen” to “have the ideal bullpen with pitchers than cannot throw more than one inning.” There are teams that basically have one or no good relief pitchers and/or lack a useful lefty specialist despite carrying one or more LHPs for that purpose. I’m not sure why carrying 8 bad pitchers is superior than carrying 4 mediocre long relievers that can eat innings and 4 additional bench players.
I would have enjoyed this article regardless, but as a life long O’s fan, I appreciate the look at the Earl of Baltimore. There was nothing quite like him walking up to an ump and turning his cap backwards (so he could get his face that much closer to the ump). He may be gone, but it will be a long, long time before he is forgotten.
Earl Weaver was a tremendous manager, but I couldn’t put him at the top with his 1-3 WS record. Three times as favorites, the Orioles couldn’t finish the job.
To offer a counter, Weaver was 4-2 in League Championship Series, including winning the first three ALCSes by a combined 9-0. He was 26-20 in postseason play.
I wouldn’t put Weaver at the apex of all managers either, but he was very good, and consistently so, for a period that in terms of manager longevity is almost forever.
Tremendous article! I would like to read an article like this about Bobby Cox, especially an ejections chart.
I do not think it appropriate to judge any manager by his World Series record because of the limited sample size. The teams are so evenly matched that one blown call, or bad hop, could change things completely. Ask Tony Kubek or Bill Buckner, a fine player. What matters is getting to the post season.
I did not mean to suggest that he used catchers for this ploy. I just needed a hypothetical and these two catchers camevto mind
Back in the early ’80s, I saw a game at Memorial Stadium between the O’s and the Mariners. At one point , an ump called a balk on one of Earl’s pitchers. Earl stormed out to the mound to argue about it, and after a few choice words, Earl turned to his pitcher and motioned for the guy to give him his glove and ball. Earl toed the rubber and proceeded to demonstrate why he thought the balk call was wrong. He came to a set position and then emphatically pointed several times to his foot, jawing all the while. Then he gave the glove and ball back to the pitcher and trotted off the field, to (as you might imagine) mammoth applause.
I always figured Earl was John McGraw reincarnate, and I mean that in a good way. McGraw had the reputation for thinking about baseball 24/7, specifically thinking about ways he could use the rules (or lack of them) to his advantage, looking for any and every edge to win ballgames.
I looked for it one time in the stats and couldn’t find it, but I have a memory that after the DH was instituted, Earl would sometimes bat one of his better hitters ninth (my memory says it was Rich Dauer) as a sort of leadoff man for the leadoff man.
I don’t know that anyone else has ever used a 25-man roster as effectively.
I think it’s fair to say Earl was a baseball genius, in addition to just plain being fun to watch manage. I can’t think of anyone else I can say that about (LaRussa was just annoying, but maybe that’s because I’m a Pirates fan).
Hi Shane…thanks for this excellent piece. I did some exploring of “Weaver On Strategy” myself that you might enjoy…
https://prestonjg.wordpress.com/2016/05/30/looking-for-bullshit-in-earl-weavers-weaver-on-strategy/
I also wrote about the origins of the “phantom DH”:
https://prestonjg.wordpress.com/2009/09/07/how-earl-weaver-changed-the-dh-rule/