Optimizing the Swing, Part Deux: Paying Homage to Teddy Ballgame

With his colored ball display, Ted Williams showed how fanatical he was about hitting. (via Dan Gaken)
This is a follow-up to my previous THT article, which as you might guess was titled “Optimizing the Swing.” The initial motivation for the article was to determine whether a curveball can be hit farther than a fastball, assuming both are hit optimally. That led to a discussion of the parameters that define a batter’s swing and how those parameters can be adjusted to lead to maximum distance. But there are other definitions of “optimum” besides maximum distance, such as maximum on-base probability. That topic will be the primary focus of this article.
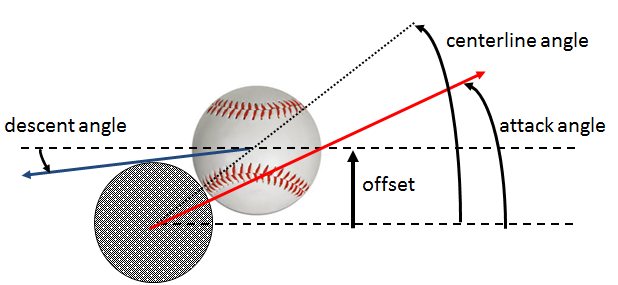
Before going on, I want to remind you of the diagram in the earlier article showing the geometry of the ball-bat collision. Recall that the important parameters are the descent angle of the incoming pitch, the attack angle of the batter’s swing (sometimes called the “swing plane”), and the offset. The latter is the vertical distance between the centers of the ball and bat and is a measure of the batter’s aim. Also shown is the dotted centerline connecting the centers of the bat and ball, with an orientation (the centerline angle) determined uniquely by the offset. “Squared-up” collisions are those where the attack angle approximately coincides with the centerline angle.
Aside from timing—i.e., getting the bat in the right place at the right time—the two parameters under the batter’s control are the attack angle and the offset, both of which can be adjusted to produce particular characteristics of the batted ball: exit speed, launch angle, and spin. In this article, I want to connect the batted ball characteristics with the probability of actual outcomes.
The study is partly computational and partly statistical. The computational part utilizes a model for the ball-bat collision to calculate the exit speed and vertical launch angle for given pitch parameters (speed, spin, and descent angle) and for given swing parameters (attack angle and offset). It is the same model used in the first article. The statistical part uses MLB Statcast data to obtain the probability of any particular outcome for given values of exit speed and launch angle. For the purposes of this article, I will consider only a fastball, with a speed at contact of 86 mph, a backspin of 2000 rpm, and a descent angle of 60. It would be very straightforward to apply the analysis to other pitch characteristics. As before, I assume a fixed bat speed of 70 mph.
I want to emphasize several caveats in the analysis. First, I am ignoring other characteristics of the batted ball besides exit speed and launch angle, such as spin and spin axis. It’s not that spin is not important. It’s simply that there are not enough Statcast data available to determine with good statistical precision the dependence of outcome on spin for given values of exit speed and launch angle. The results I will present are therefore averaged over all possible spins. Hopefully a future analysis can include the spin variable. Second, as in the earlier article I will assume the bat is horizontal and that contact occurs at the front plane of home plate. The latter therefore assumes perfect timing—the bat and ball meet at a precisely defined point. Later in the article, I will explore the consequences of imperfect timing, where the batter is a little behind or a little ahead of the pitch. Third, I am assuming the contact occurs close to the sweet spot of the bat (although I forgot to state this assumption in the earlier article). Impacts off the sweet spot (or with a lower bat speed) will result in exit speed below those calculated in my model.
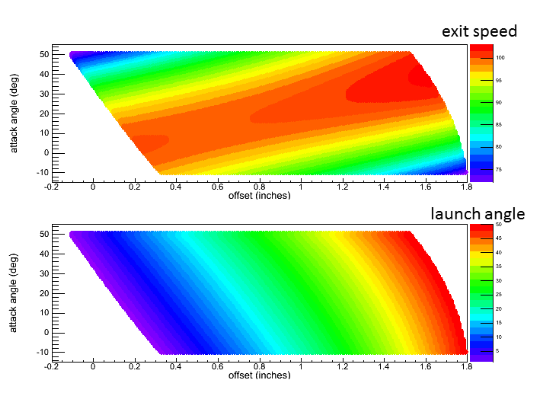
The primary results of the study are shown in a series of heat maps. The first plots show the results of the computational part of the study, in which exit speed (top) and launch angle (bottom) are given as a function of the two swing parameters, attack angle and offset. Lines of constant exit speed on the top plot are diagonals running from lower left to upper right. There is approximately a one-to-one correspondence between batted ball speed and the difference between the centerline and attack angles. The highest exit speeds (the red band) correspond to swings where the attack angle is approximately equal to the centerline angle. On the other hand, constant launch angles on the bottom plot are approximately diagonal lines extending from upper left to lower right. Actually the slope of these lines is such that the launch angle depends much more strongly on offset than it does on attack angle.
The second plot shows the results of the statistical study using Statcast data, in which on-base average is shown as function of exit speed and launch angle. The two regions of high on-base average are primarily red. One is the narrow strip extending from 110 mph/100 to ~66 mph/300. The high exit speed part of this strip are hard-hit line drives with small launch angles, leading to a high on-base average. For the batter, these types of hits are highly desirable. On the other extreme, we have softly hit bloopers that manage to clear the infield but fall in front of the outfielders. While the outcome is still very favorable to the batter, it is not so clear to me that anyone actually tries to hit a ball like that. The second important region occurs at high exit speed and launch angles in the 200-350 range. These are largely extra-base hits, primarily home runs.
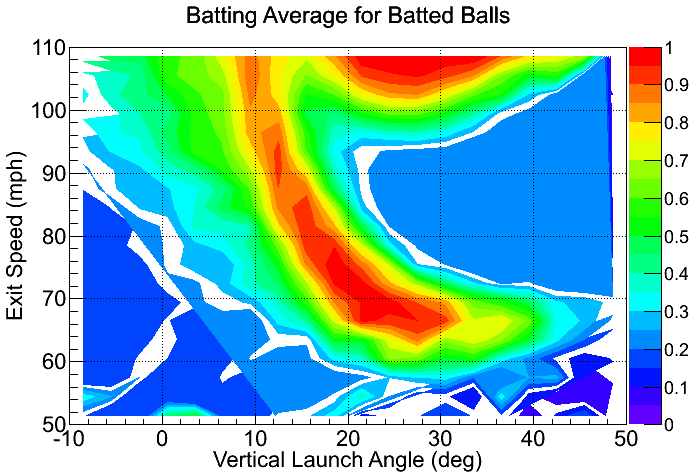
As an aside, it is interesting to look at balls hit with launch angles in the 200-300 range as a function of exit speed. At low speed we have bloop singles. At high speed we have home runs. In between, we have the “donut hole”, where the ball is hit at moderate exit speed but at too high launch angle to carry very far, leading to the proverbial “can of corn” for the outfielder.
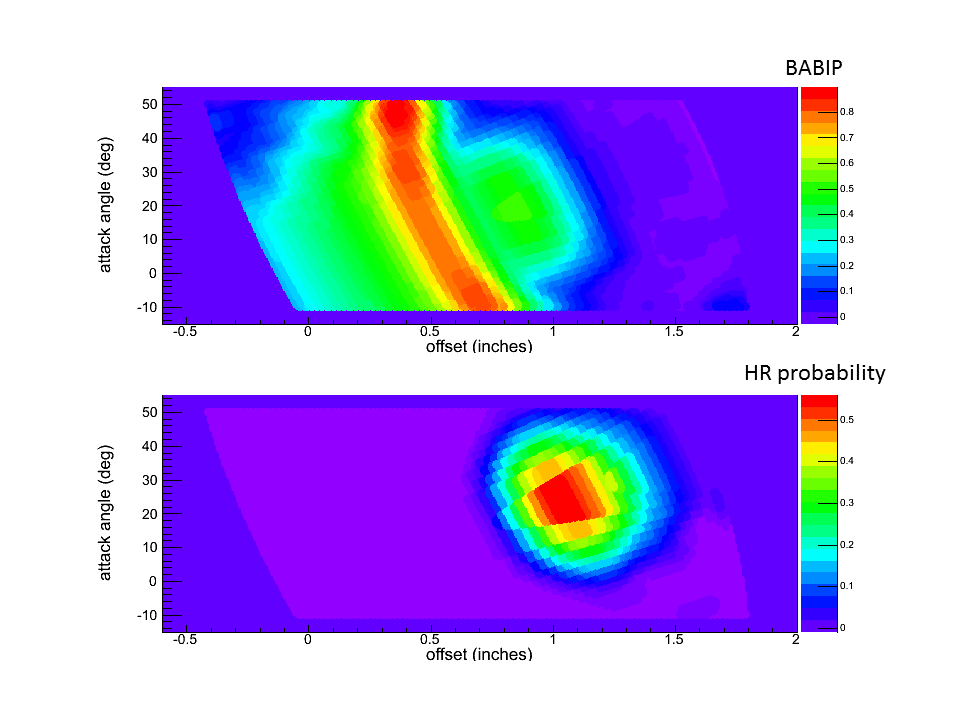
Now let’s put it all together by looking at the third set of heat maps, which combines the previous two. As a function of attack angle and offset, the top plot shows BABIP (on-base average with home runs excluded) and the bottom home run probability. For BABIP, the red/orange strip results in an on-base average greater than about 0.75 and corresponds to launch angles in the range 90-170. The optimum swing parameters for high BABIP are 100 and 0.5 inches for attack angle and offset, respectively, corresponding to an exit speed of 100 mph and launch angle of 120. On the other hand, home runs require a larger attack angle and larger offset, the optimum being 240 and 1.05 inches, respectively, corresponding to an exit speed of 101 mph and a launch angle of 290-300.
As an amusing aside, the bloop singles (~70 mph exit speed and 200-300 launch angle) are not shown on this plot. If you look at the first set of heat maps, you can easily see that these batted ball parameters are not accessible. Given that I have assumed an impact at the sweet spot with a fixed bat speed of 70 mph, I conclude those assumptions are not valied for these hits.
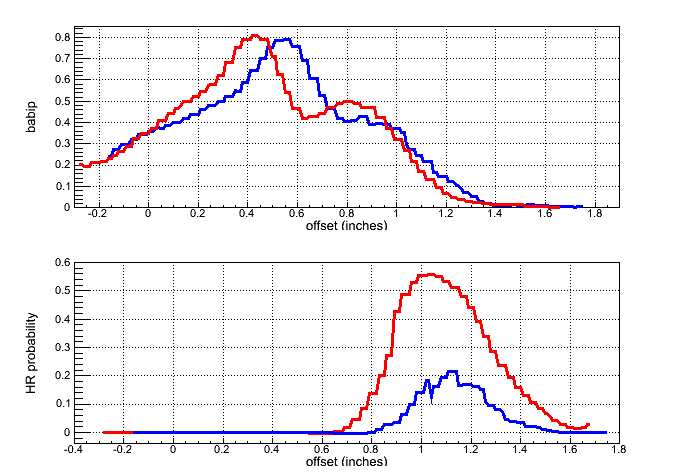
Armed with all this information, let’s talk about hitting strategies. In particular, I want to compare a “level swing” with a “home run swing”. The level swing is one where the attack angle coincides with the descent angle of the ball, which in our case is 60. That angle is very close to the optimum angle for high BABIP. The home run swing is one where the attack angle maximizes the probability of hitting a home run, which we have just found to be 240. In the next figure, I plot BABIP (top) and home run probability (bottom), as a function of offset for each of these two attack angles, blue corresponding to the level swing and red corresponding to the home run swing. Note that BABIP is essentially the same for the two different attack angles, albeit shifted in offset by about 0.1 inches. However, the home run probability is nearly a factor of three lower for the level swing than for the home run swing. Armed with this information, this raises the following question: Why not always go for the home run swing. If your aim is right, around one inch, you’ll get your home run with a reasonably high probability. If your aim is a little off and the offset is a bit smaller, you’ll get a line drive single. Either way, you can’t lose.
That brings me to one of the key points I want to make in this article: Timing! Thus far I have assumed that the contact always takes place at the front edge of home plate, meaning that the bat and ball both arrive at that location simultaneously. Let’s suppose that the batter swings at some attack angle, with the goal of having some desired offset at the front plane of home plate. If the batter is going for a line drive single, that offset might be about 0.5 inches; if he is going for a home run, it will be around one inch. Now suppose that the batter is a little late with the swing (say, a bit over three milliseconds late), so that the contact occurs four inches behind the front plane of home plate. If the attack angle is level, the actual offset will be identical to the desired offset. Such a swing is therefore very forgiving for small errors in timing.
However things are very different if the batter has a home run swing. Over those four inches, the ball will be about 0.4 inches lower and the bat will be about 1.8 inches lower. The net effect is that the offset will be larger than the desired offset by 1.4 inches. Likewise if the swing were too early by the same four inches, the offset would be smaller than desired by 1.4 inches. Think about that for a minute: 1.4 inches is about half the diameter of a baseball. It is huge! For example, if you are aiming for one inch and are late by three milliseconds, your offset will be 2.4 inches, which gives you a on-base probability of close to zero. Indeed, if the offset is larger as 2.7 inches (the sum of the ball and bat radii), the bat will miss the ball altogether.
So what’s a poor batter to do. It depends on what the batter is trying to do. If getting on base is the primary goal, then swinging level would appear to the best strategy. You’ll still hit a lot of home runs if the bat speed is high and the aim is good. Indeed that is exactly the approach advocated by Ted Williams, as written in his classic book The Science of Hitting. Someone who hit 521 career home run with a 0.482 lifetime on-base percentage must surely know whereof he speaks.

But to get the highest home run probability requires swinging with a larger attack angle, keeping in mind that you will fail often if the swing is mis-timed. A possible compromise is to pick some intermediate attack angle. For example, an attack angle of 120 reduces the home run probability by about 35 percent but also reduces the four-inch timing error to be about 0.4 inches. Moreover, such an attack angle is actually “level” for a typical curveball, which has a larger descent angle than a fastball.
There may well be other possible strategies, but my goal in this article is not to analyze these in detail. Rather, it is to set up a framework for doing such an analysis. While the development of the framework is still a work in progress, hopefully some useful initial steps have been taken.
“The study is partly computational and partly statistical. I will consider only a fastball, with a speed at contact of 86 mph, a backspin of 2000 rpm, and a descent angle of 60. As before, I assume a fixed bat speed of 70 mph.”
That is hilarious, partly computational and partly statistical. So in other words, all math all the time. As for your choices in speed, 92.8 – 93 mph is the average fastball in the major leagues, and average MLB bat speed is I believe 77-78 mph according to statcast.
Good analysis either way, but I think this merits a different set of parameters.
Eric…thanks for your comments. Some remarks:
1. Remember that the speed that matters (and that is put into the calculation) is the speed at home plate, not the release speed. The number I have chosen is actually an average of a bunch of fastballs using PITCHf/x data. It corresponds to a release speed of about 94 mph, just a bit over your number.
2. Statcast does not measure bat speed. It measures pitch speed and exit speed. If it does give bat speed, it does so using an algorithm that I provided to MLBAM. I don’t recall if they are posting that number yet, since I only gave it to them a couple of weeks ago. The number I use, 70 mph, is certainly not the largest bat speed. However, it does result in exit speeds from fastballs that are “typical”, maxing out at about 110 mph. There are higher exit speeds, requiring faster bat speeds. I chose to use typical numbers. I doubt very much that 77-78 mph is average.
3. Having said all of that, the qualitative nature of the results I have presented are not very sensitive to those details.
4. “all math all the time”: Not sure how to respond to that. Batting averages require all math all the time. Please excuse the snark, but I really don’t know what point you are trying to make.
damn
Alan, is it possible to share with that formula for bat speed you mentioned?
And also one thing I want to understand. In your article “Dynamics of the baseball–bat collision” (2000) there are formula (15) and (16) to calculate exit speed from vbat, vball and COR.
vf = vball * (e – R) / (R + 1) + vbat * (e + 1) / (R + 1).
Here R = mball / mbat = 5.1/32 =~ 0.16 in our case, e =~ 0.5, vball = 86, vbat = 70.
vf = 115.7 mph for level swing.
In the article you say that exit speed limit is 110 mph, which is lower. Is it because you use lower COR or due to anything else?
Some comments:
1. I gave some incorrect info in my earlier reply. The exit speed max’s out at about 102 mph (not 110). Sorry if I caused any confusion.
2. 100 mph is about the average for MLB home runs. As I said earlier, I wanted to use average numbers rather than maximum numbers
3. I again emphasize that the qualitative results in the article are not dependent on the precise values of pitch and bat speed.
4. Uni: The bat mass in the expression for R is not the actual mass but the effective mass, since the bat is an extended object. For a 32 oz bat, a value of 20 oz is typical, so that R=0.25. The expression q=(e-R)/(1+R) is about 0.2. I actually used a velocity-dependent COR, but that is just a detail.
5. I have not investigated how optimum swing plane depends on bat speed. I’ll get around to that soon.
One more comment:
6. An algorithm for swing speed is as follows:
swing_speed=(exit_speed – 0.2*pitch_speed)/1.2
where the pitch_speed is at home plate, which is about 0.9 of the release speed.
Really fascinating data and article. Thanks for sharing.
Just sticking to varying attack angle and offset (and leaving swing speed fixed), I’m curious about what the swing + miss or swing + fouled off percentages are. Since you’re computing offset + attack angle based on batted ball characteristics, I know there’s no way to do the same for misses (although perhaps balls that are fouled off?), but I think that is a very big part of optimizing the angle/offset strategy.
Common sense seems to dictate that aiming for a higher offset or attack angle will increase swing + miss percentage, while the odds of completely missing on a very flat swing would be lower.
This means even if the “home run” swing produces roughly half of the BABIP of the “line drive” swing, if the swing + miss percentage is twice as high, you’d have to factor that in from a batting average perspective. Again, common sense would say that with 2 strikes hitters should likely adopt a line-drive approach in most cases, but other game situation factors come into play. All of this also ignores a hitter’s ability to read pitches, know the strikezone, and their reaction time (as well as swing speed).
Taking all of that into account, it seems like there are probably many “local” optimal strategies depending on batter, pitcher, count, game situation, but that there almost certainly is not a one-size-fits all universally optimal strategy.
The ability for hitters to do those sorts of on-the-fly “calculations” for each pitch/plate appearance is an interesting aspect of baseball. It is sort of a missing link between physical abilities and game outcomes.
Thanks again,
Nolan
Russel Carlton did a variance decomposition of the swing and miss/contact rates and seemed to show that the variance distribution differed with each swing type. That would seem to be an important facet of the analysis as well. Worth some thought anyway.
http://www.foxsports.com/mlb/just-a-bit-outside/story/kansas-city-royals-contact-rate-strikeout-swing-and-miss-world-series-champions-112415?cmpid=feed:-sports-RAMP-Cxense
Thanks for the comments. I’ll go back an give Russell’s article a careful read.
Barry Bonds deliberately changed his swing and strategy to produce more home runs at the expense of line drives. I wonder how he would assess the argument presented here. We may find out next season as he becomes a batting coach…
More great insight into baseball. Thanks Alan.
Editorial note: Many of the launch angles mentioned in the text portion are either missing a decimal point or have an extra zero added for no reason.
Dave…thanks for the nice comments. Regarding the editorial comments, I had that all right in my submitted version but got messed up in the posting process, which is outside of my control.
Are there any commercially available machines/devices that measure offset (trackman maybe) of a batted ball? What did the authors of the previous study use? That might be something the Zepp folks might want to look into. Their device measures attack angle but not offset. Thanks for the article.
I think the answer is “no”. Certainly Trackman does not measure the offset. I suppose high-speed video might be able to do it, but even that would be quite crude. Not sure who you mean by “authors of the previous study”.
Can swing angle be determined for Mickey Mantle? I had always thought that he had an honest power swing, more level than those of batters trying to generate false power with an exaggerated uppercut swing designed to drive the ball up but at the risk, as you demonstrate, of often missing the sweet spot.
I suppose one could try to get the swing plane from video, at least qualitatively.
Alan – For posterity’s sake please request that the editors change the angle notations by omitting the trailing zeros. I’d hate to see a generation of young batters practicing their “level” swings of 60 degrees and citing your article as a reference. Merry Christmas.
Should be all set now. My apologies for missing that the first time. Thanks for keeping us on our toes!
And thank you, Paul, for making the necessary corrections.
Thanks, Peter. I have made that request.
Bat mass plays a major role as well. It’s too complicated for a thousand words, but the weight of the bat is in its own way as important as bat speed.
Bat swing weight is of course important too as well as swing speed. It is interesting if you change the bat speed by say 5 mph, how will it influence an optimal attack angle? Since more momentum into a swing will change VLA (not to mention spin which we agreed to omit here).
I’d expect 65 mph bat speed to slightly change 1st and therefore 3rd plots. Homerun swing angle will probably increase by 1-2 deg. Just a guess.
Alan, thanks for an enjoyable and well laid-out article. I think the framework you’ve laid out is terrific.
For the computational part of your study, did you capture the topspin of the batted ball for each attack angle/offset combination? It would be interesting to see which combinations (if any) produce both topspin and an exit speed/vertical launch angle combination in the “bloop” hit zone on your batting average plot. This might be partial evidence of an optimal strategy for BABIP for low-power hitters (recognizing that the Statcast data doesn’t include batted ball spin.)
I’m sending your article to Chris Davis. I suppose it’s a shot in the dark, but, maybe, just maybe, he’ll pay attention and finally get it: that he is putting himself at a huge disadvantage with his extreme uppercut. Any chance you could look at a couple videos of Davis’ swing and estimate his attack angle?