Perusing one run games
One run games can be the most exciting in baseball. A fan is either left with the satisfaction of winning by one, or the gut-twist of being oh, so close to victory. The effects of a one-run game are so polarizing for fans; win or lose, the emotional feelings of fans are more magnified than in other games.
But how much skill is involved in winning a one-run game? Many writers have tried to answer this question, some getting pretty close to figuring out just how much can be attributed to good teams beating out the competition—or just getting dealt the right cards at the right time.
We know that one-run game records do not correlate well from season to season. We know that there can be wild rankings of teams in this category, but that good teams still win these types of games more often than others.
One-run games can be tricky. It’s hard to infer much from teams’ corresponding records in those games, despite the common fan’s itch to take pride in a team’s superb one-run game record. Below are just some ideas or concepts I’ve come across, and pondered upon.
The proportion of one-run games over time


I’ve made a couple graphs above that display the proportion of one-run games, over time, in each league. Overall, one-run games consistently make up the highest proportion of games in both leagues—close to the 30 percent mark. That is good news if you’re a fan of close games.
The NL proportion looks to be trending upwards this year, while the AL looks about the same so far, compared to last season. In fact, the NL has already accumulated 489 one-run games, on pace to break the mark of any years’ total from the past decade.
It’s unclear why there is an increase in one-run games this year. One factor could be that runs per game in both leagues have decreased since last year.
A different Pythagoras
Pythagoras was meant to translate a team’s run differential into a win percentage figure. It works. But what about using it for components in a team’s record?
It doesn’t make much sense to use Pythagoras, for instance, when figuring out an expected record in one-run games. Because of the straight linearity, shouldn’t the expected record be what it is? The run differential can only go up or down by one per game; same with the team’s record in those situations. The run differential will equate to how many games above or below 0.500 that team’s record is in these one-run game situations. Bill James, years back, discussed these thoughts as well, though I haven’t had enough time yet to dig deep into his ideas on the subject.
But I guess the reasoning behind using the Pythagoras equation in any component of a team’s record is the idea that runs scored or allowed in those one-run games are theoretically distributed, and thus we would expect an X winning percentage from these two figures, no matter what kind of game they were scored/allowed in.
Regardless, we could probably make a different angled-Pythagoras model that is broken apart by each one-, two-, three-, etc. run games. That might be worth figuring out. Another way to slice up the games would be by run environment, or total runs scored in a game by both teams.
The better relationship
At SABR33, in 2003, David Smith presented on the topic of close games and whether a team’s record in close games is really a skill set of good teams. He came to the conclusion that records in one-run games are related closely to overall records. However, looking further at records in games ending with a two or more run differential shows a higher correlation to the team’s overall win percentage. It’s easier to gauge how good a team is based on their success in two-, three-, four-plus run games.
I used the same type of analysis—but using 2010 and current 2011 season data—to see if we can find any outliers in the midst below.
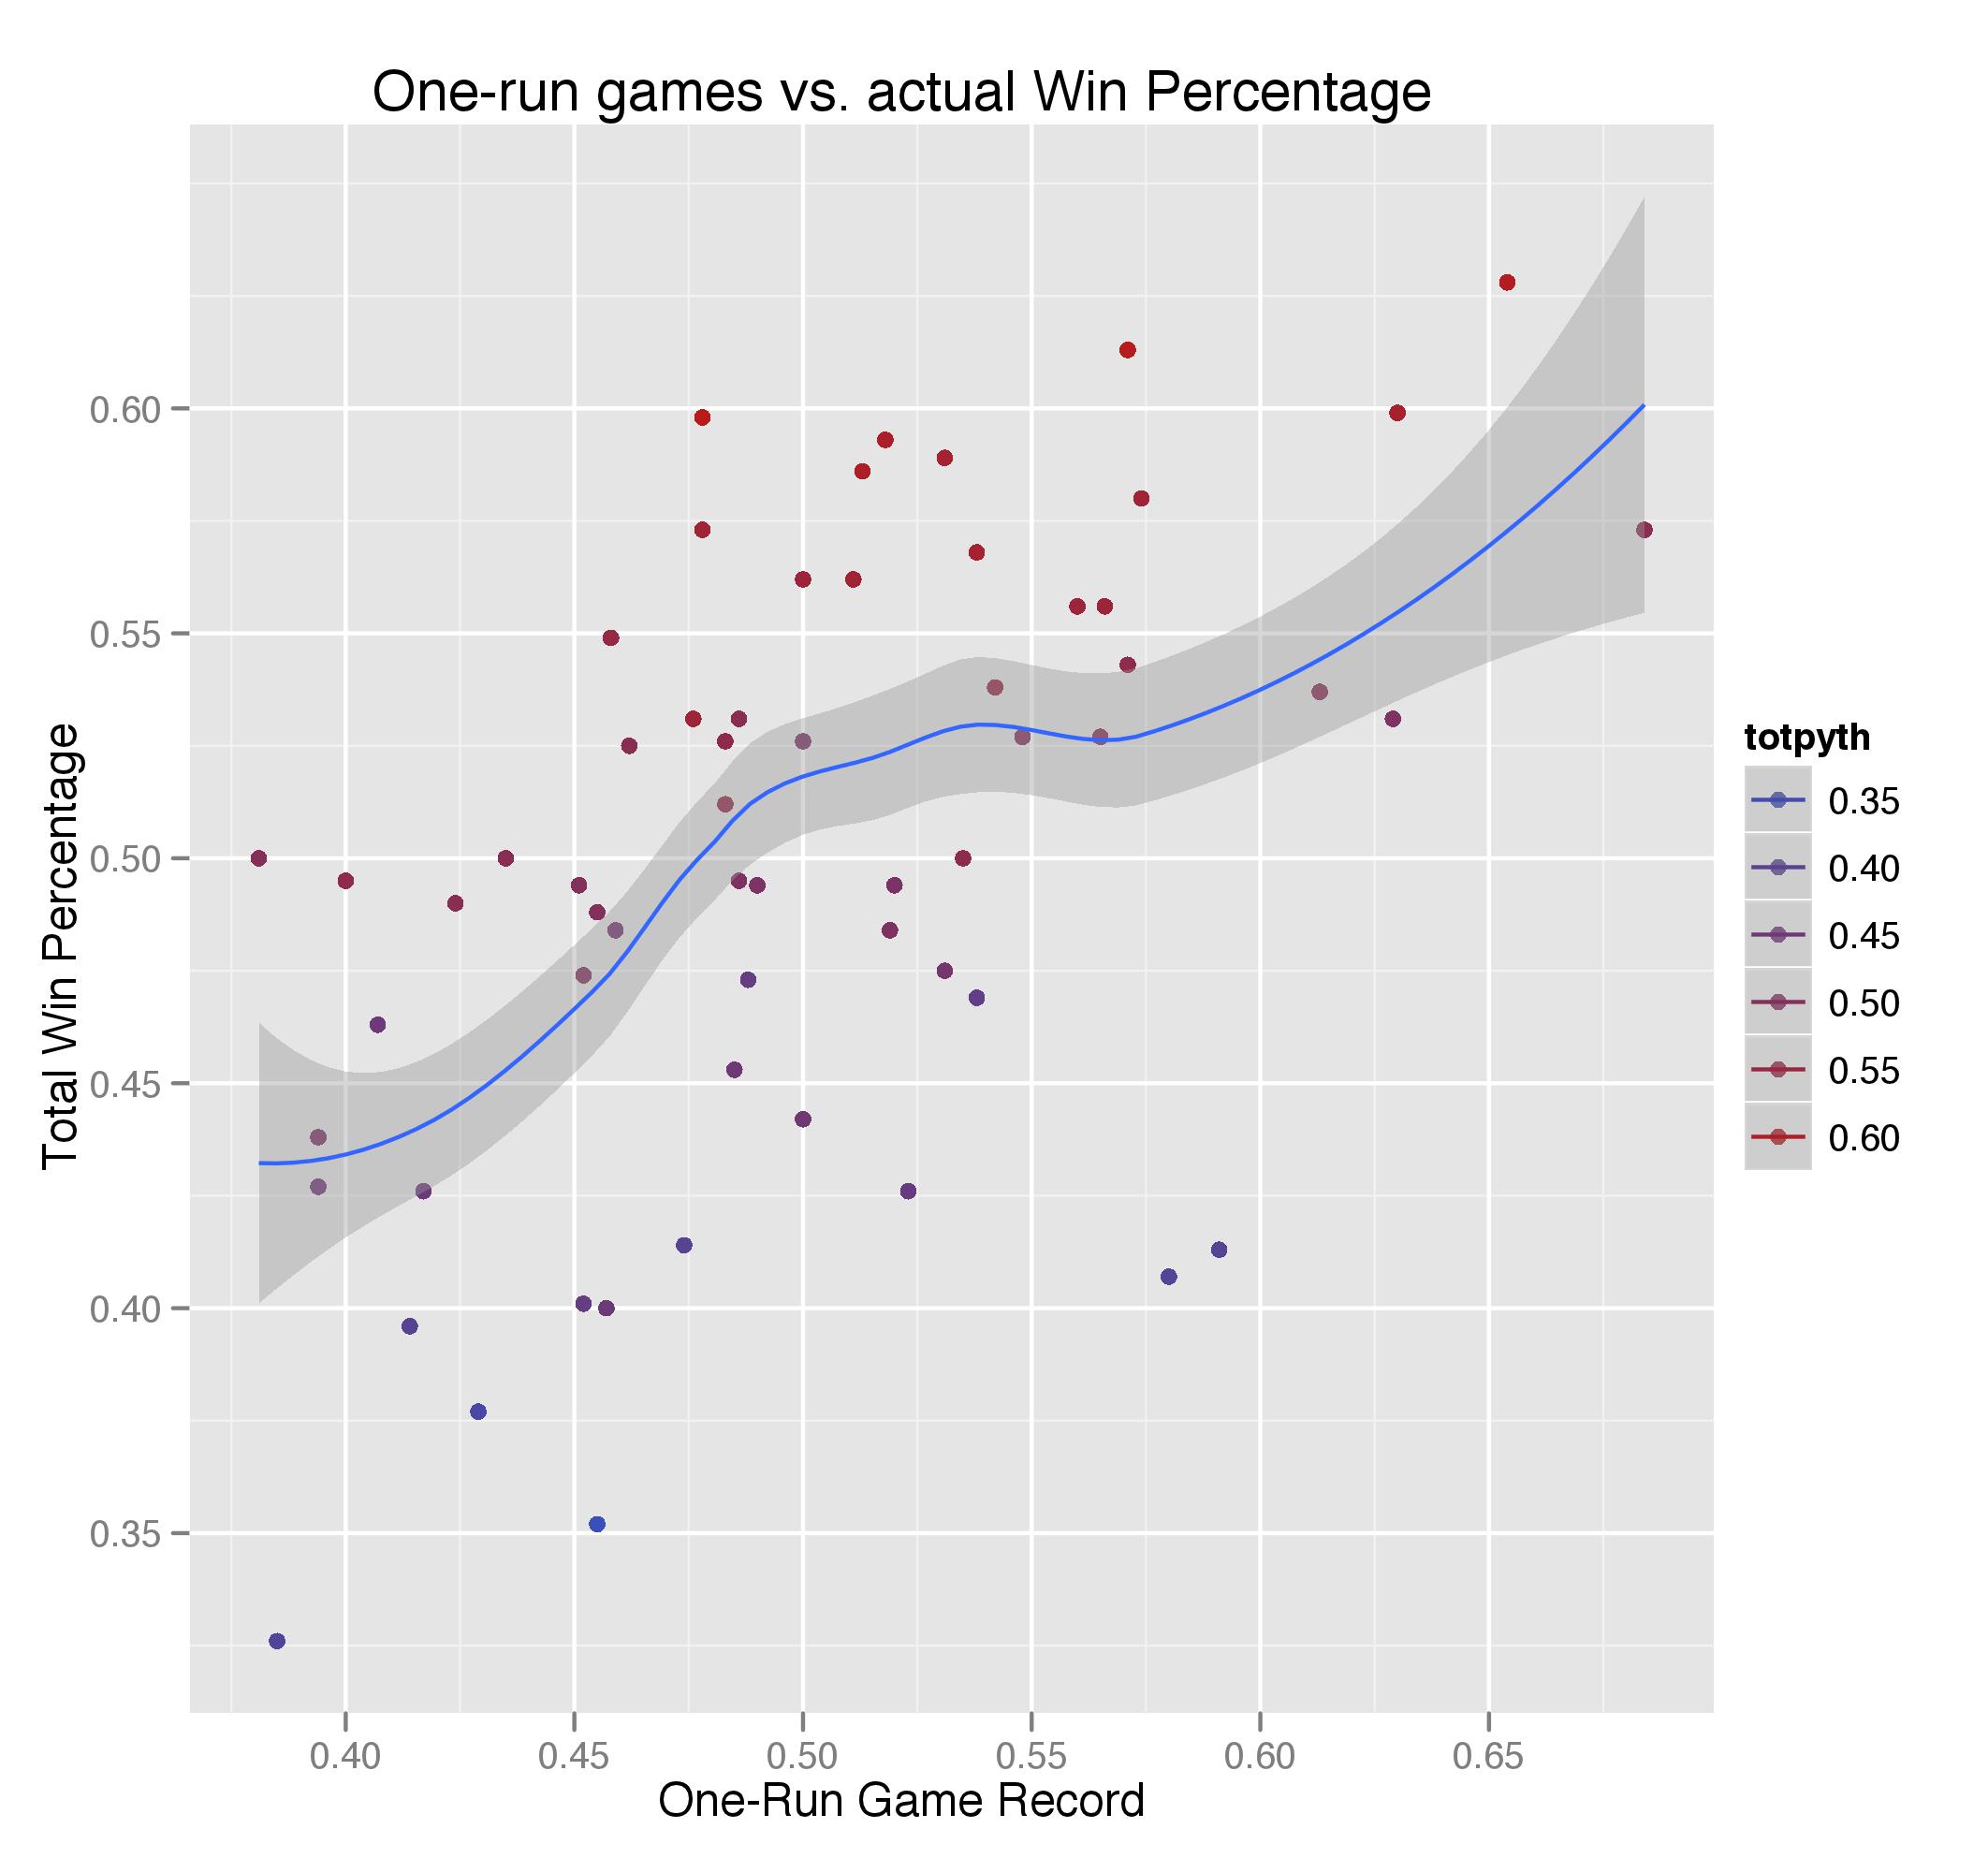
As you can see, a team’s record in one-run games is very much correlated with a team’s overall win percentage. The color of each data point corresponds to the team’s Pythagoras record. While we see a linear relationship, there are clear outliers, mainly in the area below 0.500.
There are two distinct points (closer to the bottom right corner) where a team had great success in one-run games, but did not translate to overall record. These two teams are actually both Baltimore Orioles—the 2010 and 2011 versions.
Another interesting area of the graph is in those points hovering around the 0.500 to 0.550 mark in one-run games. Despite this, it’s hard to know how well the team did overall in the season (i.e.—a big difference in total win percentage, from 0.425 to 0.590).

Now taking a look at more than one-run difference games against total win percentage, there’s an even greater linear relationship. Almost as straight as you can get. Also notice how the Pythagoras points are linear as well, since the color goes from dark blue to red in a positive fashion.
Lastly, I’ll leave you with some numbers from the reigning champs’ season so far. In one-run games, the Giants have had the best record from this study at 0.684 (or a 26-12 record). In games of higher run differences, they are square even at 0.500. In essence, they are in first place in the National League West due to their success in one-run games. We will see how that plays out, but maybe they have a knack for proving us wrong, just like last year’s improbable run.

References & Resources
Dave Studeman knows ten things about one-run games, some of them I mentioned above. Also, check out David Smith’s original work that I took inspiration from.
All data used for this article came from using Baseball Reference’s Play Index (games played through July 17, 2011).
One thing that has always struck me about analyzing one-run games is that there is a definitional problem. Not all games that end with a one-run decision are “one-run” games in the sense that people talking about teams “knowing how to win close games.” For example, if I’m ahead 5-0 and give up four runs in the 9th and end up winning 5-4, that is technically a one-run game but it’s not what people mean. By the same token, you can have a tie game late and one team scores several runs and wins by more than one run. If the focus is on a team’s skill in winning “close” games, it seems to me you should define it differently than simply counting up one-run decisions.
Second, I’m wondering if, especially with pitching becoming more dominant, better teams (generally those with better pitching) lose more close games because they rarely get blown out and, therefore, a larger percentage of their losses will be one-run. Conversely, lesser teams may have a better percentage of one run wins because they aren’t good enough to blow teams out (blow out being a relative term in baseball); since even bad teams win a certain number of games, sometimes many of those games will be one-run wins even though this is not indicative of the overall skill.
One other thing and this relates somewhat to the Giants. This is based on no real analysis, just general observation. Over the years, it seems that when a team is having a real good year, especially winning the World Series, they seem to have a knack for winning close games. It seems that, when teams like the Giants get on a roll, things happen so that they win these games. Whether this is random or a function of skill, I don’t know. Maybe it’s just the fact that playoff games are typically close and that, whichever team wins will, ipso facto, have won a lot of close games.
Marc: Your comments are very salutary and, in my estimation, correct. The author oversimplified.
Thanks for your feedback. I just had some additional comments:
I think it’s valid that binning games by run differential does sometime lose those games you mentioned (up by 5-0, but winning by one at the end). I just think it’s a different way of slicing games up into categories.
An issue I would have with this is the subjectivity of splitting these games that way. Say you are counting the number of games a team has been in where they have kept the lead up to the 7th inning (and what their record is in those games). Is the 7th inning the right choice as the marker, or 8th? etc., etc. With counting games by run difference you lose that subjectivity. Also I would argue that even if a team wins 5-4 but gave up those 4 runs in the late innings, it was still a close game: the losing team was still very close to winning despite not leading for most of the game. That’s why they play 9 innings, right?
In your second paragraph you mention worse teams will get blown out rather than blow teams out. I guess that’s true (like the Orioles example I gave in the article), but I’m not sure if the other way works. For instance, the Giants have really good pitching and they have won a large percentage of their one-run games, and are mediocre in their other games.
I thought it was a very good article. My point was, if you are saying there is such a thing as skill in winning close games, a 5-0 game in which you bring in the last pitcher of the bullpen and he gives up 4 runs doesn’t reflect any particular skill. I agree, however, that there are difficult boundary issues with trying to define close games more subjectively.