Pitching repertoires and BABIP
People like trends. I like trends, you like trends, heck, even your mom likes trends. Why? Because we are human, and viewing the world in trends is intuitive and makes the big bad world just a little less scary. While tempting, this impulse does not always produce the best analysis.
Consider hot streaks. All research indicates that the majority of hot streaks, especially in baseball, are not predictive. In fact, hot streaks have been referred to as a “cognitive illusion” by Thomas Gilovich, professor of psychology at Cornell University. But they certainly feel tangible, predictive, real.
A great deal of sabermetrics controverts our itch for trends. A chief example is defense independent pitching statistics, or DIPS. Perhaps the ultimate sobering sabermetric doctrine, DIPS stresses the lack of control that pitchers have over outcomes on balls in play.
Years after Voros McCracken’s breakthrough research, DIPS has been intensely scrutinized and has come out relatively unscathed. Despite the support for DIPS, I will admit that at times I still struggle with the concept. I am human after all, and it is reasonable, if not wise, to be skeptical of a theory that so strongly goes against common sense.
It is often said that pitching is about disrupting the timing of the batter. I do not know who first said this, but it sounds reasonable. [Ed.: It was Warren Spahn.] And what better types of pitchers personify this advice than pitchers who throw lots of changeups?
In reality, a changeup is really only effective when coupled with a fastball. In terms of movement, a changeup is very similar to a two-seam fastball. The only difference is velocity, usually around an eight-mph separation. It does not seem outrageous, then, that changeup-heavy pitchers might be a little better at preventing hits on balls in play than other pitchers.
There is certainly anecdotal evidence. Johan Santana, Clay Buchholz, Shaun Marcum, and Cole Hamels are just a few changeup-reliant pitchers who have sustained significantly better BABIPs than average over considerable sample sizes. But this kind of support does not mean very much, so I turned to PITCH-f/x data for help.
First, I found all pitchers in 2011 who have thrown at least 1350 pitches through Sept. 19. I used only 2011 data because the run environment from this season—and consequently the league-average BABIP—are lower than in years previous. I used the 1350-pitch threshold to eliminate relievers from the sample, because relievers are known to be able to sustain lower BABIPs than starters. This gave me a sample size of 157 starters, which is not a huge amount, but sufficient.
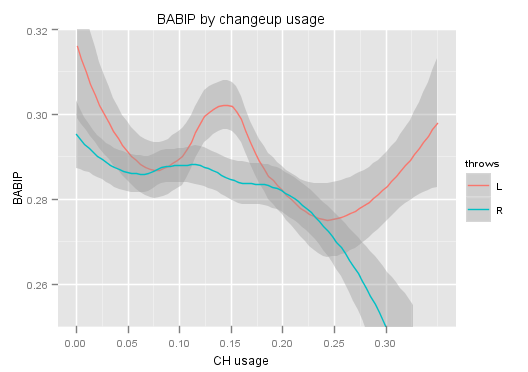
Here is a graph of the relationship between changeup usage and BABIP:

This is for all 157 pitchers in the sample, and the gray bands indicate confidence. As you can see, BABIP fluctuates a little until around a .17 usage rate, when BABIP starts to fall. For purposes of transparency, I have the league-average BABIP for the 157 starters as .287. This is slightly lower than the league average found elsewhere because I did not deal with sacrifices (included as outs).
After seeing this 17 percent threshold, I split the starters into two groups: Those who threw changeups at least 17 percent changeups, and those who do not. I will refer to the pitchers who threw at least 17 percent changeups as the “changeup heavy” group. I will refer to the pitchers who threw fewer than 17 percent changeups as the “changeup light” group.
The changeup heavy group (n=45) had a mean BABIP of .279, and the changeup light group (n=112) had a mean BABIP of .290. A two-sided t-test finds the difference in means to be statistically significant at a 98% level.
Group Breakdowns
As suggested by Dan Turkenkopf, I looked at the mean velocities of these two groups. For pitches classified as four-seam fastballs by Gameday, the changeup-heavy group averaged 90.05 mph, and the changeup-light group average 91.0 mph. A one mph difference was also observed with two-seam fastballs (including pitches classified as sinkers). For pitches classified as changeups, the changeup-heavy grouped averaged 81.97 mph and the changeup-light group averaged 83.38 mph.
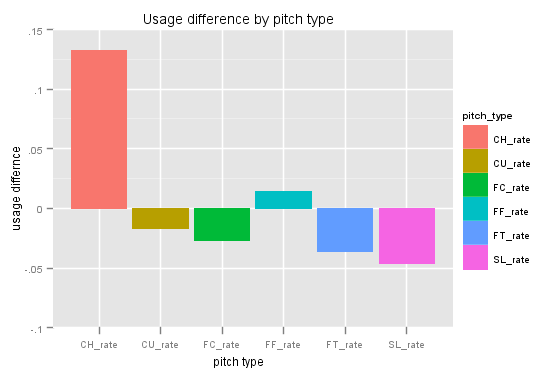
In terms of repertoires, here is how the two groups differed:

This graph shows difference in pitch usage for four-seams (FF), two-seams (FT), sliders (SL), curveballs (CU), cutters (FC), and of course changeups (CH). As you can see, the only major difference is with changeups (13.2 percent).
Batted Ball Differences
We know that batted ball profiles can help us predict BABIP. Pitchers at the extremes—tons of flyballs or tons of groundballs—are known to be able to sustain lower-than-average BABIPs. Therefore, if changeup heavy pitchers fall into one of these groups, then we have not really found anything interesting.
I am calculating these batted ball profiles using the data available from MLBAM stringers. There are four possible types of batted balls: Fly balls, ground balls, line drives, and pop-ups. This is different from Fangraphs, which includes pop-ups within fly balls.
In terms of groundball rates, the changeup-heavy group averaged 42.5 percent, and the changeup-light group averaged 43.5 percent. All other types of batted ball rates were within two percent for each group, meaning the batted ball profiles were essentially the same! Assuming these batted ball classifications are reliable, we can reason that batted ball differences are not the reason for the difference in BABIP skill.
So which batted balls are going for hits less often for changeup heavy pitchers? Both ground balls and fly balls go for hits less often for changeup heavy pitchers, though line drives become hits at a marginally higher rate. I have not tested these individual BABIP differences for statistical significance.
Limitations
As stated earlier, all classifications used were from MLBAM. This creates some uncertainty about the actual changeup rate for some of these pitchers. For example, if a pitcher throws both a splitter and a changeup, Gameday usually has a lot of trouble distinguishing the two (see: Ubaldo Jimenez, Freddy Garcia).
In addition, I have not adjusted for the counts in which these pitches were thrown. Ideally, each pitcher in the sample would have an identical distribution of counts. This is because the average BABIP is not same for each count; BABIP is going to be [presumably] higher in 2-0 counts than in 0-2 counts.
Therefore, if pitchers that are in the heavy changeup usage group are better at getting ahead in the count, then we are just implicitly measuring the effect of count distribution on BABIP. Other cautions include that I have not adjusted for team fielding, ballpark, league, or opposition. Also important to note is the inaccuracy of MLBAM batted ball stringers. However, if these errors are randomly distributed, or at least distributed in a manner that does not systematically favor the BABIP of one group vs. another, then these limitations are not huge concerns.
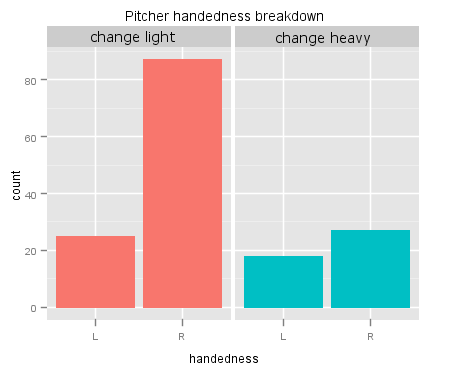
Another limitation, as pointed about by Josh Smolow, is that of handedness. Indeed, we do find that changeup-heavy pitchers are more likely to be lefties than changeup-light pitchers:

But does this really matter? For the pitchers in the dataset, lefties have an average BABIP of .291, and righties have an average BABIP of .285, a difference which is not statistically significant. If anything, this means that we may be underestimating the effect of having a changeup that you can throw 17 percent of the time.
Here is a graph of the relationship of BABIP by changeup usage, split up by pitcher handedness:

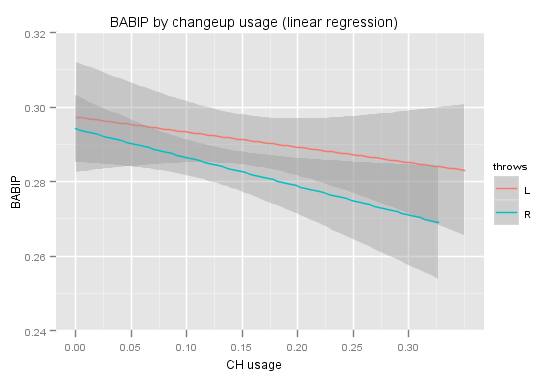
It may appear that lefties and righties are displaying very different relationships here to changeup usage, but part of that is because of the smoothing method used. If we present the data using a linear regression instead, the two groups look much more similar:

However, I have not looked into splitting up the data by the handedness of the batter. It is also important to note that the 17 percent changeup usage threshold used to create the two groups is arbitrary. At lower thresholds, the difference in means in not significant. I re-ran the t-test using different thresholds, and the difference in means is significant at at least a 92.5 percent level for every threshold from 17 to 24 percent (17 percent, 18 percent, 19 percent, etc.).
Keep in mind this is also a two-sided t-test, despite the fact that our alternative hypothesis is really one-sided, meaning that we can halve the p-value. This means that for a one-sided t-test, these results would be significant at above a 95 percent level (the standard level in the social sciences) for every threshold in the 17-to-24 percent range.
One bias to watch out for
As stated earlier, I split the starters into two groups, those who throw changeups at least 17 percent of the time, and those who don’t. So perhaps all we are measuring is the effect of having a pitch good enough to throw 17 percent of the time.
Well, were this to be true, we would see a similar BABIP split with other pitches that are thrown at least 17 percent of the time. But we don’t. Slider-, curveball-, and cutter-heavy pitchers (usage greater than 17 percent) do not display a statistically significant BABIP advantage.
Finishing Thoughts
Are changeup-heavy pitchers allowing weaker contact, or are these findings just the result of a confluence of luck and limited data? Unless we obtain a lot of HIT-f/x data, we won’t know the answer to this question. But based on the above information, I would feel comfortable saying that there is evidence supporting a BABIP-suppressing skill for changeup-heavy pitchers.
If we do accept that changeup-heavy pitchers have BABIP-suppressing skill, we also need to accept that this skill is not very large. In a way, that makes this just another win for DIPS.
References & Resources
PITCH-f/x data from MLBAM via Darrel Zimmerman’s pbp2 database and scripts by Joseph Adler/Mike Fast/Darrel Zimmerman, this study about hot streaks in baseball, and fangraphs.

Interesting study! I do have one question. Is HR rate different between the changeup heavy and light groups? What about compared to the league average?
Brent,
I have not looked at HR rate yet, but that’s definitely something to look into. If I had to guess, I would say that there is no significant difference.
Josh, just great stuff. Thanks.
Great idea and nice analysis, but I have a problem with the fact that you both calibrated and tested your hypothesis (that there is a difference in BABIP between pitchers who throw changeups more or less than 17% of the time) with the same data set. For statistical validity you should have reserved a clean data set for testing. Of course you can rectify this by now testing your 17% hypothesis on 2010 data – even if the run environment was different and the average BABIP was higher in 2010, the gap between the two sets should still exist at a significant level if the hypothesis is correct.
The other problem with 2010 is that a changeup classified in 2010 by the Gameday algorithm is not necessarily the same as a changeup classified by the 2011 version of the Gameday algorithm. MLBAM has made significant adjustments to the algorithm pretty much every year. I am giving them the benefit of the doubt and assuming that 2011 is more accurate than previous years.
If I re-run using 2010 data, I no longer find statistical significance for all pitcher at the .17 changeup usage threshold. However, there is still a significant difference (p-value = 0.03) for right handed pitchers at a similar changeup usage threshold (.14).
Because the algorithm is not the same in both years, a .14 CH usage rate in 2010 may very well be the same thing as a .17 CH usage rate in 2011 for many pitchers.
This makes me think two things: maybe this effect is only real for right handed pitchers (if it is real) and that this has something to do with platoon splits, which I can also look into.
I think you should look at platoon splits and overall batter strength, as well as pitcher FIP, K rate and HR rate.
As for platoon splits, it may be that pitchers who throw a lot of changeups face lots more same side batters. I don’t know if same side batters produce lower BABIP, but they may.
Also, if the K rate of the changeup heavy pitchers are better, that may also explain the lower BABIP to some degree as I THINK that higher K pitchers have lower BABIP (I am not sure).
Really what you want to do is to match up the pitchers according to (or control for) other things that may be causing the effect, like platoon, FIP, K rate. HR rate, and overall quality of opposing batters, perhaps even park, although I would think that there should be no bias there.
Good stuff though!
In one of the recent “Most Meritorious Player” threads on Baseball Think Factory, someone speculated that perhaps it wouldn’t be just the changeup per se, but a pitcher’s entire windup-delivery-and-repertoire package that might make possible an improvement upon the normal BABIP rate.
The example presented was Juan Marichal. Start with his windup: that preposterous leg kick. What was that if not a device to distract the batter, to present him with something he isn’t used to seeing?
Add on top of that the fact that Marichal didn’t just throw the standard range of pitches; instead he threw the kitchen sink: fastball, curve, slider, screwball, all at constantly varying speeds and locations and from constantly varying arm angles.
What was all that designed to do if not keep the batter guessing, to put him off his normal response sequence—in other words, to upset his timing? Might a Juan Marichal achieve better BABIP results than expected?
I chimed in that, if so, then perhaps looking closely at other pitchers with “what the heck is that” kind of windup/delivery routines, such as Luis Tiant or Stu Miller, as well as those with an endless repertoire of pitches, such as Murry Dickson, might be warranted?
MGL,
Unfortunately it’s a little hard to calculate these things from a pitch f/x database without some crazy mysql, but they are various ways I can try to approximate some of those variables like using contact rate instead K rate. More platoon split information is also definitely something to look into.
Steve,
I agree that a having a funky delivery may very well help decrease BABIP, the problem is just in developing a reasonable criteria for measuring these pitchers. It’s also something that you would have to identify from video, so that would be hard to look at. And about having an endless repertoire of pitches, that’s usually something that’s developed in an attempt to combat ineffectiveness when stuff declines (I think).