Regression with Changing Talent Levels: The Effects of Variance
Regression hits some players harder than others. (via Dan Gaken)
In my recent article comparing Elo and regression to the mean, I noted that weighting past results with an exponential “decay factor” so that more recent data gets more weight can impact the regression constant used to estimate true talent. Specifically, the effect was as follows:
It turns out the correct amount of regression to use is roughly half the original regression constant (actually n/(2n-1), where n is the maximum effective weight of the sample based on the decay factor, which is close to 1/2 as long as n isn’t too small).
There wasn’t space in the article to lay out the math behind that statement, but I went through it in a comment on TangoTiger’s blog for those interested.
The n/(2n-1) formula works well for creating a regression model that emulates Elo, which was the purpose of the previous article, but for practical purposes, the impact of weighting past results on the mathematics of regression to the mean is a bit more complicated than that.
There are two important caveats that are critical to understanding why the n/(2n-1) formula isn’t necessarily what we want to use in practice.
First, n/(2n-1) is a long-term limit. Applying an exponential decay to past results places a cap on the total effective sample size. No matter how much data you have, the total weight will never go above a certain point (because this type of weighting creates a geometric series).
As the effective sample size approaches the limit n, the regression constant approaches the limit C * n/(2n-1), where C is the original regression constant. With the sample sizes we typically work with for projecting baseball teams or players, though, the regression constant generally doesn’t have enough time to reach the long-term limit.
Second, the math behind that formula relies on the simplified assumption that talent levels are constant for each team or player in the sample. In reality, the need to weight past results implies the underlying talent levels are changing, which can have additional implications on the regression constant that make this a lot messier. This wasn’t an issue with trying to emulate Elo, which gives an un-regressed estimate, but for creating an actual regression-based model, it will be.
This second point is especially important. In the math linked in the comment on Tango’s blog, the takeaway is that the regression constant is linked closely with the amount of variance in the sample. The reason the regression constant changes when you weight for recency is that doing so distorts the amount of variance.
This is important because the complications involved with changing talent levels also center around distorting the amount of variance in the sample. This means that, while we could adjust the n/(2n-1) formula to work for any sample length and not just as a long-term limit, it would still have problems due to the distortions introduced by changing talent levels.
General Principle No. 1
The regression constant is closely related to the amount of variance in your sample. Factors that can affect the variance, such as weighting past results or changes in talent levels over time, can produce corresponding changes in the regression constant.
Estimating the Regression Constant
The basic method to calculate the regression constant is to split your sample into two halves and measure the correlation between them. If you’ve ever seen an article on how long it takes particular stats to “stabilize” (such as Russell Carleton’s or Derek Carty’s) the author was likely doing something along these lines.
There are a few other ways to do this besides just splitting the sample in half and running a correlation (such as intraclass correlation, Kuder-Richardson-20/KR-21 and Cronbach’s alpha*), but the general idea is the same: You use either correlation or variance to calculate a reliability score for your sample, and the reliability tells you how much to regress. In general, the reliability goes up as your sample size increases, and the regression constant represents the point at which the reliability of the sample reaches 0.5.
*I believe Carleton’s second article underreports the plate appearance thresholds by a factor of 1/2. It appears from the article that he interprets the reliability of a 500 PA sample as the split-half correlation with 250 PAs in each half, but the formulas he is using—KR-21 and Cronbach’s alpha—both give reliability for the full sample length, not half. If that is the case, it would help explain a noted discrepancy between Carleton’s and Carty’s numbers.

If terms of correlation, the reliability score (for half the sample length) is the correlation between the two halves of your sample, and the reliability will be 0.5 when the number of observations in each half equals the regression constant. In terms of variance, it is the proportion of total variance in the sample that comes from variance in talent rather than random variance, and the reliability will be 0.5 when an equal amount of variance comes from both talent and random variation.
The fact that we can use correlation or variance interchangeably is helpful because one framework might be better suited to a particular discussion. In our case, focusing on the variance of talent in the population will help us understand how the distortions in variance caused by changing talent levels can impact the regression constant.
General Principle No. 2
The regression constant represents the number of observations you need for the reliability of your sample to reach 0.5. The reliability of the sample can be expressed (and calculated) in terms of either correlation or variance, and the two approaches can be interchanged depending on which is more convenient.
Variance in the Sample
The relationship between variance and regression is based on a simple concept: The wider the distribution of talent across the league, the more players you have whose actual talent level is a given distance from average. And the more players whose true talent is a given distance from average, the more likely an observed performance at that level is due to talent rather than random variation.
As a result, a wider spread in talent translates to a lower regression constant. Mathematically speaking, this increases the proportion of observed variance that comes from talent as opposed to random variation, thus increasing the reliability of the sample. And of course the reverse is also true; a narrower spread in talent will lead to more regression.
When talent is constant for each player throughout your sample, the variance in talent won’t ever change. What about when talent levels start changing from day to day, though?
To start, let’s look at a simple hypothetical league of 11 hitters whose true talent in on-base percentage is spread evenly from .300 to .350. This is obviously an unrealistic distribution for major league baseball, but keeping things simple will help us see what happens when we introduce random changes in talent.
Now, let’s say that each hitter’s talent level changes randomly each day, and that those changes follow a normal distribution with a standard deviation of .001. This doesn’t change much on a day-to-day level, but what happens as these small changes start to add up?
To show this, I’ve simulated 100 days for our hypothetical league:
| Player | Original | After 1 day | After 100 days |
|---|---|---|---|
| Player 1 | 0.3000 | 0.2999 | 0.3142 |
| Player 2 | 0.3050 | 0.3049 | 0.3053 |
| Player 3 | 0.3100 | 0.3088 | 0.2960 |
| Player 4 | 0.3150 | 0.3148 | 0.3104 |
| Player 5 | 0.3200 | 0.3199 | 0.3125 |
| Player 6 | 0.3250 | 0.3246 | 0.3193 |
| Player 7 | 0.3300 | 0.3309 | 0.3520 |
| Player 8 | 0.3350 | 0.3355 | 0.3509 |
| Player 9 | 0.3400 | 0.3405 | 0.3543 |
| Player 10 | 0.3450 | 0.3433 | 0.3264 |
| Player 11 | 0.3500 | 0.3506 | 0.3517 |
The small changes become more substantial over time, but more importantly, something happens to the spread in talent across the sample. The variance of true talent started at 0.000275, but after 100 days of random changes in talent, that jumps to 0.000470.
Of course, with an 11-player sample, that jump could just be random chance, but even if we repeat the simulation with more players, we see the same thing. A jump to 0.000470 is a bit higher than expected (the expected variance in talent after 100 days under these conditions would be around 0.000375), but the fact that it increases remains.
This is because the original talent levels and the random changes in talent are uncorrelated. When you combine two uncorrelated variables, their variances also combine. In other words, we would expect the spread in talent after 100 days to approximately equal the variance in original talent (0.000275) plus the variance of 100 days worth of random talent changes (100 * 0.001^2 = 0.0001).
This is a problem. The implication is that, if changes in talent are uncorrelated with talent levels, the spread in talent across the population should be constantly increasing. Which, if you think about it, makes sense. If the players at the extreme ends of the talent spectrum are just as likely to get even better or even worse as they are to move toward the center, then those extreme ends will drift further and further apart as half the top players keep getting better and half the bottom players keep getting worse.
But this doesn’t match what we see. The spread in talent in the majors doesn’t appear to be constantly increasing like we’d expect from this model.
Our model, then, needs an update. We can correct for the constantly increasing spread in talent by constantly resetting the variance back to its original level. This is done by moving each player’s new talent level slightly toward the center of the distribution after each talent change.
This has the effect of creating a slight negative correlation between a player’s talent level and subsequent changes in talent—that is, players at the top end of the talent spectrum are more likely to fall back toward the center than to continue moving further away—which cancels out the effect of the additional variance.
| Player | Original | After 100 days | Variance Corrected |
|---|---|---|---|
| Player 1 | 0.3000 | 0.3142 | 0.3168 |
| Player 2 | 0.3050 | 0.3053 | 0.3099 |
| Player 3 | 0.3100 | 0.2960 | 0.3028 |
| Player 4 | 0.3150 | 0.3104 | 0.3138 |
| Player 5 | 0.3200 | 0.3125 | 0.3154 |
| Player 6 | 0.3250 | 0.3193 | 0.3206 |
| Player 7 | 0.3300 | 0.3520 | 0.3457 |
| Player 8 | 0.3350 | 0.3509 | 0.3448 |
| Player 9 | 0.3400 | 0.3543 | 0.3474 |
| Player 10 | 0.3450 | 0.3264 | 0.3260 |
| Player 11 | 0.3500 | 0.3517 | 0.3454 |
| Variance | 0.000275 | 0.00047 | 0.000275 |
This sounds similar to regression to the mean itself, and in fact, the calculations to offset the growth in talent variance are done the same way as the calculations used in regressing observed results. However, regression to the mean is a purely statistical phenomenon that occurs even without changes in talent. It tells us that a player’s true talent level tends to be closer to the mean than his observed performance, not that his talent level itself is changing in any way.
What this suggests is that, given that talent levels are changing from day to day, the underlying talent levels themselves will also tend to drift toward the center going forward.
General Principle No. 3
When there are changes in talent over time, one of two things should happen: Either the spread in talent across baseball will increase steadily over time, or individual player talent levels will tend to drift back toward the center. If there is no evidence of the former occurring, then we can assume the latter must be true.
How Talent Changes Affect Variance
When we look at observed performance, there is a wider spread in performance over the short term than the long term. For example, a month into this season, there were a handful of hitters with wOBAs over .500, and another handful of everyday starters with wOBAs under .200. By the end of the season, those extremes will have narrowed considerably as the players on the extreme ends of the spectrum drift toward the center.
If true talent also tends to drift toward the mean, then we would expect to see something similar happen with the underlying talent levels. And if we take the average talent level for each player in our example over the entire 100 days rather than just looking at talent one day at a time, we do indeed see the spread narrow:
| Player | Original Talent | Average Talent |
|---|---|---|
| Player 1 | 0.3000 | 0.3108 |
| Player 2 | 0.3050 | 0.3085 |
| Player 3 | 0.3100 | 0.3090 |
| Player 4 | 0.3150 | 0.3153 |
| Player 5 | 0.3200 | 0.3139 |
| Player 6 | 0.3250 | 0.3205 |
| Player 7 | 0.3300 | 0.3432 |
| Player 8 | 0.3350 | 0.3419 |
| Player 9 | 0.3400 | 0.3458 |
| Player 10 | 0.3450 | 0.3353 |
| Player 11 | 0.3500 | 0.3466 |
| Variance | 0.000275 | 0.000257 |
The variance in talent among players stays at .000275 for any particular day, but when we combine the 100 days and take each player’s average talent level over that span, the variance shrinks. Even though the variance in talent across the league remains the same from one day to the next, the players who are near the top or bottom of the league in true talent on any given day are more likely to be less extreme throughout the rest of the sample, on average.
As these players drift back toward the center and new players replace them at the extreme ends of the spectrum, nobody averages out as wide as the day-to-day extremes over the whole sample. The longer you observe the sample and the more time you give players’ true talent levels to change, the smaller the spread gets between them.
This reaches the crux of how changing talent levels impact regression. Decreased talent variance means lower reliability, and lower reliability means more regression.
In our example, the regression constant for our 11-player population would be approximately 800 PA. (The random binomial variance after 800 PA is ~.000275, which means that’s the point where the total observed variance is half random and half true talent variance.) But that is only if we are projecting talent for the immediate future. If we are instead projecting talent over the next 100 days, where we expect the variance in talent to tighten, suddenly we have to add ~850 PA of regression (the point where random binomial variance equals .000257).
The regression constant is generally treated as the same value whether you have one plate appearance or a thousand (hence the term “constant”), which works well when talent levels never change. When talent levels are changing from day to day, though, that no longer holds.
General Principle No. 4
The regression constant is generally treated as a constant value regardless of how much observed data you have, but changes in talent over time can cause the regression constant to increase as the variance in talent across the population shrinks.
Calculating Changes in Variance Over Time
We know that when talent levels change from day to day, the spread in talent across the league can shrink as your sample length grows. But how exactly is that relationship defined? How do we know how much the variance in talent shrinks?
It depends on two factors: the length of time covered by your sample, and how much talent changes from day to day (as measured by the correlation between talent levels from one day to the next). The longer your sample length, or the more talent changes from day to day, the more the spread in talent will narrow.
Once we know these two factors, we can calculate how much the spread in talent diminishes using the following formula:
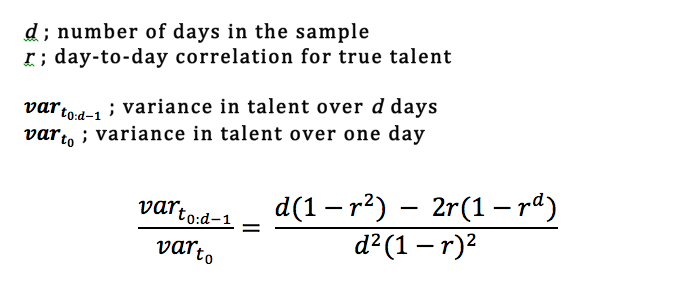
Again, there isn’t space in this article to cover why this formula works, but I’ve written a supplement going through the math for those interested. If you prefer, you can also download the mathematical explanation in PDF form along with some R code to test the formula against simulated data.
In our 11-player example, the day-to-day correlation in talent is about 0.998. If we plug d=100 and r=0.998 into the above formula, we get that the variance in talent after 100 days should be about 94 percent of the original variance in talent. That comes out to about 0.000259, or right around what we got in our sim.
General Principle No. 5
The amount that variance in talent is reduced over time depends on two factors: the length of time covered by your sample and the correlation between talent levels from one day to the next.
Estimating the Day-to-Day Correlation
This formula allows us to calculate the expected variance in talent at any sample length, which in turn lets us adjust the regression constant to any sample length. If we have data covering a full season but want to project talent levels for the immediate future, we can convert the variance in talent over 180 days to the variance in talent over one day and then recalculate the regression constant based on the new variance.
In order to use the formula, though, we need to know the day-to-day correlation for talent. In practice, this value can be tricky to estimate since we don’t know how much talent is changing from day to day, but there are a couple ways we can do it.
One is to take samples of varying lengths and see how much the variance in talent (which we can estimate using the same reliability scores used to estimate the regression constant) diminishes over time.
As an example, I took the on-base percentage for all player-months from 2000-2016 where a hitter had at least 90 PA, and from that I get that the variance in OBP talent across the population is 0.000962. Then, I took all player-seasons over the same span where a hitter had at least 500 PA, and from that I get an OBP talent variance of 0.000910.
Going from d=30 to d=180 (the approximate number of days in a month and a season) lowers the variance in talent by a factor of 94.54 percent. That corresponds to a day-to-day correlation of 0.9989, where the variance in talent for one day is 0.000974, the talent variance over 30 days is 98.86 percent of the one-day value, and the talent variance over 180 days is 93.44 percent of the one-day value.
(This takes some playing around with the formula—it’s kind of messy to solve for two values of d, but you can set up the formula in Excel, R, etc. to quickly guess-and-check values and home in on the solution.)
Another way to estimate the day-to-day correlation is to measure the correlation between samples at varying intervals.
For example, if I take the monthly OBP data and find players with consecutive qualifying months, I get a correlation of 0.2506 for OBP one month to the next. If I then look at the same players two months apart, the correlation drops to 0.2432. Adding an extra 30-day gap between the samples lowered the correlation by a factor of 0.9704, which is equivalent to lowering it by a factor of 0.9704^(1/30) = 0.9990 each day. This value tells us how much the underlying talent levels correlate from one day to the next.
Using our two methods, we get r=0.9989 and r=0.9990. I should warn you, it is pretty lucky that our two methods yielded such similar values. You might occasionally get an estimate of 0.9950 using one method or set of data and r>1 using another (r>1 is clearly wrong, but sometimes you will run across something like the correlation actually going up when you go from one month apart to two months apart due to randomness in the data).
This is largely because we are dealing with ratios of very small numbers, and a small amount of randomness in the measurements can have an amplified effect. You can mitigate the randomness somewhat by looking at the data in as many ways as possible, such as comparing the correlation at several different intervals or looking at the variance at several different sample lengths, but you’ll inevitably have to deal with a degree of uncertainty in these estimates.
General Principle No. 6
The correlation of talent from one day to the next is key to calculating how much the spread in talent narrows over time, and thus to calculating a regression constant for varying sample lengths. This value can be tricky to estimate precisely, but we can get a general idea by evaluating how the variance or correlation of observed data changes over time. For many baseball stats, something on the order of 0.999 should be relatively close to the right value.
Conclusions
The regression constant is closely related to the amount of variance in your sample—the greater portion of that variance that comes from the spread in talent, the lower the regression constant, and vice versa.
We saw in the Elo vs. Regression article that weighting past results lowers the regression constant. This is because weighting past results lowers the random variation in the data, which in turn increases the proportion of overall variance that comes from talent.
However, weighting past data also implies that the underlying talent levels are changing over time (or, alternatively, that you are weighting for no reason). This also affects the variance, but in the opposite direction of weighting. That is, while weighting past data increases the proportion of variance attributable to talent, the changes in talent implied by weighting decrease that proportion.
This dampens the effect of weighting on the regression constant. The interaction of these two effects is complex and is not covered in this article, but the impact of variance discussed here is important to understanding that interaction.
That means this is still an intermediate step in understanding how changes in talent impact the math of regression to the mean. Before we can tackle the full effect, we need to understand why there is an effect and what factors contribute to this effect.
The most important factor in these calculations is the correlation of talent from one day to the next. This allows us to translate the day-to-day changes in talent into a quantifiable impact on variance, which in turn lets us measure the impact on the regression constant.
References & Resources
- Adam Dorhauer, 3-D Baseball, “Math Behind Regression Talent Changes”
- Github, “Math Behind Regression with Changing Talent Levels”
- Adam Dorhauer, The Hardball Times, “Elo vs Regression to the Mean: A Theoretical Comparison”
- Russell Carleton, FanGraphs, “525,600 Minutes: How Do You Measure a Player in a Year?”
- Tom Tango, Tangotiger Blog, “Regression v. Elo” comments, particularly those by Jared Cross
- Wikipedia, “Geometric Series”
- Derek Carty, Baseball Prospectus, “Resident Fantasy Genius: When Hitters’ Stats Stabilize”
- Harry Pavlidis, The Hardball Times, “It makes sense to me, I must regress”
- Russell Carleton, Baseball Prospectus, “Baseball Therapy: It’s a Small Sample Size After All”
- Tom Tango, The Book Blog, “Updated r=.50 numbers”
“In terms of variance, it is the proportion of total variance in the sample that comes from variance in talent rather than random variance, and the reliability will be 0.5 when an equal amount of variance comes from both talent and random variation.”
Very interesting. But, why from a correlation standpoint are you using .5 rather than .7, if the goal is to explain half the variance? Much more importantly, what is the basis for the declaration that ALL variance not accounted for in the reliability measurement can by definition be only “random” as opposed to merely unobserved?
It’s a bit of a simplification to assume variance splits neatly into “talent” and “random”. If you want to build a more precise projection system, you could try to account for additional sources of variance, like differing parks, weather, opposing pitchers/hitters, etc, but for the purposes of investigating the math behind it, it helps to stick to simpler assumptions.
In general, I think most projection systems try to avoid adding complexity whenever they can help it since you can usually get pretty close by using simplified assumptions, and each layer of added complexity can bring more risks (i.e. potential bugs or results you can’t really explain or understand) than potential gains in accuracy.
*****
r=.5 vs r=.7 has to do with what you are measuring. In this case, when you split a sample into two halves and the correlation between the two sets of observed data is .5, that implies the correlation between the underlying talent levels and the observed data in each half is .7.
The general idea is that 50% of the variance in each half is explained by the variance in talent, so that’s half the variance that will persist between samples. When you look at two different observed samples with the same relationship to the underlying talent levels, that means 50% of the variance in one sample explains 50% of the variance in the other sample, and you end up with the variance in one sample explaining 25% of the variance in the other sample. Hence r=.5 between observed samples implying that half the variance in each sample is explained by talent (r=.7 between the observed and the underlying talent). That’s why regression to the mean uses r=.5 for the regression constant rather than r=.7.
This is largely incorrect. Because these reliability estimates are generally collected by within-sample pairs, the assumption is that the underlying talent is the same in each sample, because it’s the same player. That’s probably not true in the strong sense, but if you do the methodology right, you can get it to where you can say “close enough” and the entire point of what we’re trying to measure in reliability rests on the assumption that talent is essentially the same.
Reliability analysis unto itself doesn’t answer the question of how well performance tracks underlying true talent. It measures how well two chunks of PA track _each other_. It’s the methodology that you use that allows you to say “these two chunks represent the same talent level.” If you do it right and get an R of .707, then the variance attributable to “talent” is 50 percent (.707^2 = .5), because — in theory — the talent level in both samples correlates at 1.0.
When weighting things for the purposes of regression toward the mean, you would weight that sample at .7 observation and .3 mean, but if you want to speak about variance, you would say that 50 percent is “talent.” If your methodology makes it convenient to want to weight things 50/50, you can find the place where reliability is .5, and that’s fine, but this is a place where R and R-squared/variance are different numbers.
The correlation between two observed samples, which each has random variation in the data, is going to be lower than the correlation between one observed sample and the underlying probabilities used to generate that sample, even if the same probabilities are used to generate both samples.
Say you have two unfair coins, one of which comes up heads 1/3 of the time, and the other of which comes up heads 2/3 of the time. You know which coin is which.
Flip each coin ten times and record the number of heads in one column, and the probability of getting heads in another column. Keep repeating the experiment over and over, so you end up with something like this:
p H
.33 5
.67 7
.33 2
.67 8
.33 4
.67 9
…
Now, do that same experiment, but instead of recording the probability of landing heads in the first column, flip each coin ten more times and record the the number of heads in the second sample next to the number of heads in the first sample:
H1 H2
5 6
7 6
2 1
8 4
5 4
9 8
…
Are you suggesting that you should get the same correlation between the two columns in the first table (correlating observed results to the underlying probabilities) as in the second table (correlating observed results to another sample of observed results)? Because that is definitely not the case. The correlation for the first column is higher. Running a simulation, I get a correlation of .745 for the first table and .555 (which is .745^2) for the second.
The formatting of the table columns got squished together in the comment, but hopefully it’s clear enough what they should be.
Adam is correct.
When true-to-observed correlation is .71, then observed-to-observed correlation (given same trials) will be the square of that (or r=.50).
The tripping block for me is this ” that means 50% of the variance in one sample explains 50% of the variance in the other sample, and you end up with the variance in one sample explaining 25% of the variance in the other sample.”
Variance in performance is a function of variance in talent and error. We’re assuming (falsely, but it’s an assumption of convenience) that talent is unchanging across what we’re sampling. We’re also assuming that none of that error is measurement error (again, probably false, but that’s what we’re doing) and that all the error is random.
Let’s say we have two columns of observations, Perf1 and Perf2.
Perf1 = Talent + error1.
Perf2 = Talent + error2.
We assume that error1 and error2, at the player level, are uncorrelated. Since the total error variance is going to be a function of how many observations (which we artificially set equal in all cells) and how many players are in the sample (ditto), error variance is equal in both columns. Maybe this is too stylized a world that I’ve created, but in this world, the relationship between Perf1 and True Talent is going to be the exact same as Perf2 and True Talent.
So, Perf1 and Perf2 may share 50 percent of the variance between them, but in this world, we know exactly where that variance comes from (talent peeking its head above the random noise) and that the exact same underlying talent is powering both relationships.
There are some major concerns that I have about this one. I appreciate the idea of trying to model the idea that true talent levels are not static and the use of decay-type modeling seems reasonable as an approach that might work to shed light on the problem.
I buy that performance on an individual level will (over a large enough sample) shrink toward true talent level. If true talent levels were static (they aren’t, and I get that’s why you wrote the piece) then over a billion PA, everyone’s performance would be correlated with their true talent around 1.0. The leap here, and I don’t think it’s a very well founded leap, is the idea that if there are changes in individual talent level, that they will necessarily be biased toward shrinking back toward the grand mean. I get the case that a random-walk model would eventually increase the overall observed variance (and eventually, that would just flood the entire league with variance), but there are other things that could be happening here.
One is that there’s probably an assumption of Gaussian normality about the league wide talent pool that we’re violating. Talent in MLB is not normally distributed. There are just more scrubs than stars. Another is that the data set (i.e., MLB performance data) is censored in a biased way. If your performance drops too far below the grand mean, you get DFAed and replaced by someone who’s (probably) better than you. (If you’re well above the mean, you are given $100 million.) That’s going to “artificially” limit the league-wide variance essentially by setting a lower bound. There’s also no reason to assume that the amount of league-wide variance on true talent is constant. That might be functionally true (worth a look), but I don’t know that we can assume that a priori. You could have a league that is very stars-and-scrubs or one that’s more egalitarian.
I think my biggest concern is applying this at the individual level. If I had no other information on a player other than he is “Player X” I might buy the idea that if his true talent level is going to move in some direction, it would be toward the mean. That’s for lack of information, rather than conviction. As soon as I knew something simple like his age, I’d have a much better guess as to which direction I expect his true talent level to go. It’s entirely possible that some of the movement in underlying talent levels can be explained through this regression toward the mean idea. Here, I am guessing without evidence, but my gut feel on this one is that those individual level covariates are going to be much more important.
***
One other issue worth clarifying. You pointed back to my work on reliability using KR-21 and Cronbach and believe that my initial thresholds are basically half of what they should be. This is a bit of a mis-understanding of what I’m doing with KR-21/Cronbach.
Traditionally, Cronbach is used as a model of measure internal consistency. For example, as a psychologist, I might develop a 24-question form to assess people for signs of depression. As part of my initial validation studies for the measure, I would want to see that the measure had internal consistency. I could split the questions up evens-and-odds and see how the 12 evens correlate with the 12 odds. That’s basic split-half. (Cronbach/KR-21 amplify this process by essentially taking all possible combinations of 12 and 12 and coming up with an average correlation.) In practice, there’s no reason that I’d actually split my measure into 12 and 12. but if I were ever held at gunpoint and forced to do it, I could at least feel confident that the evens would give me roughly the same answer as the odds. (Whether it was a correct answer or not is another matter.) If I got a result that was “good enough” from Cronbach, I’d say “This 24-item questionnaire is internally consistent” because in that case, I want to show that the 24-item questionnaire works.
When I developed that reliability model, I more or less used Cronbach in the reverse way that it’s normally used. If I wanted to see how reliable a sample of 100 PA was, the obvious choice for a criterion to measure against would be another sample of 100 PA. So, I gather together samples of 200 PA. From there, I run Cronbach/KR-21, which splits the sample of 200 in half into two 100 PA chunks and then gives a reliability estimate.
I could say “This 200 PA sample is a coherent whole and that the two underlying 100 PA chunks belong together.” I could also say “If I split these into two 100 PA samples, they would mirror each other well enough that it’s clear that they’re measuring the same thing.” I would argue that the fundamental definition for “reliable” is that given a sample of X PA and then another sample of X PA in the same (or for our purposes, roughly the same ) set of circumstances, a player’s performance would be very similar. If I was holding a sample of X PA in my hand, I feel confident that another sample of X PA drawn from the same water would give me the same results.
Most people start with the larger whole and want to see that the component chunks hang together (and so they report the N of the larger whole.) I started with a chunk and wanted to know if a same-sized analogous chunk would perform similarly, and so I report the N of the chunk, which is half the size of the whole.
“I could split the questions up evens-and-odds and see how the 12 evens correlate with the 12 odds. That’s basic split-half. (Cronbach/KR-21 amplify this process by essentially taking all possible combinations of 12 and 12 and coming up with an average correlation.)”
The average correlation given by Cronbach’s alpha/KR-21 is adjusted to a sample length of 24, though. It would be like taking all possible combinations of 12 and 12, averaging the correlations, and adjusting them from 12 observations to 24 using the Spearman-Brown prediction formula. If you did actually split the sample into 12 and 12, it would give a lower correlation than what Cronbach/KR-21 give.
I looked this one up and apparently, I have been doing this one wrong. Somewhere along the line when I learned Cronbach, I didn’t get the part about Spearman-Brown.
So, that means everything is even slower to stabilize than I thought. Great.
I’m curious why you think it’s more relevant to look at change in talent over time than other effects. Specifically, I think going from one ballpark to another and facing different starting pitchers is more likely to affect outcome than changes in talent from day to day. This is why I think it would be better to evaluate performance with an implicit model that uses the results of individual matchups rather than an explicit model that assumes zero variance in opponent talent and only addresses park effects with post box adjustments.