Research Notebook: Acquiring NCAA Baseball Stats with R

It’s true, you too can pull college stats into R! (via Minda Haas Kuhlmann)
In the latest release of my baseballr package I’ve included a function that makes it easy for a user to pull data from the NCAA’s website for baseball teams across the three major divisions (I, II, III).
The function, ncaa_scrape, requires the user to pass the function three parameters:
- school_id: Numerical code used by the NCAA for each school
- year: A four-digit year
- type: Whether to pull data for batters or pitchers
For the latter two, the inputs are easy. The issue for most will be knowing what the school_id is that the NCAA website uses for the school they are interested in. To help, I decided to include a massive lookup table in the package so a user could easily identify the necessary school_id.
I thought it would be helpful to walk through how I built that file and then show how to use the ncaa_scrape function to start acquiring actual statistics.
Building a lookup table for all NCAA schools
Let’s load the following R packages:
require(baseballr)
require(dplyr)
require(rvest)
require(xml2)
The first thing we need to do is build a function that allows us to obtain the numerical codes that the NCAA uses for each of the conferences across their three divisions.
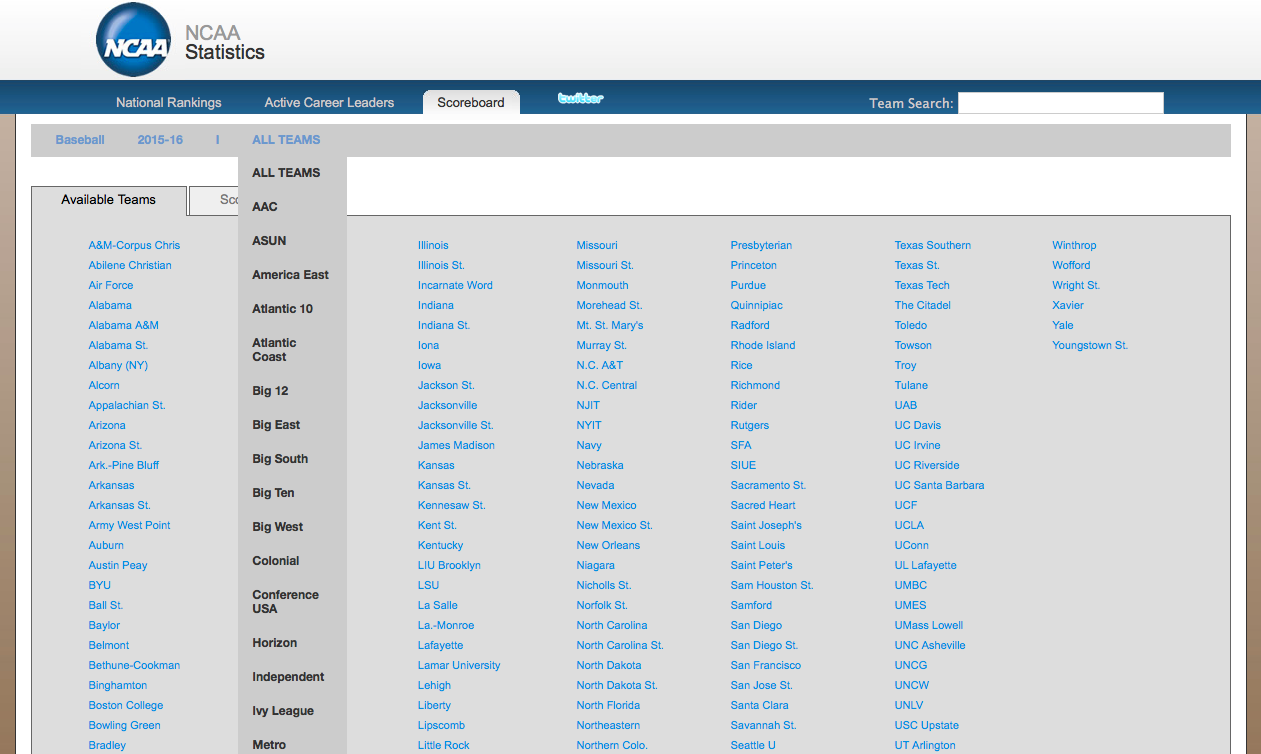
If you look at the url structure used at the site, there is a parameter–conf_id–that allows you to view conferences and the teams associated with each conference individually:
http://stats.ncaa.org/team/inst_team_list?academic_year=2016&conf_id=-1&division=1&sport_code=MBA
When set to -1 the site will show all schools in a given division. The only list I could find that details each conference is a javascript drop down that becomes available when you hover over “ALL TEAMS.”
Let’s write a function to grab the urls and url names for all conferences from the site:
conference_table <- function(year, div) {
  url <- paste0("http://stats.ncaa.org/team/inst_team_list?academic_year=", year, "&conf_id=-1&division=", div, "&sport_code=MBA")
  read <- read_html(url)
  links <- html_nodes(read, "a") %>%
    html_attr("href")
  link_names <- html_nodes(read, "a") %>%
    html_text()
  table <- as.data.frame(cbind(link_names, links))
  names(table) <- c("conference", "links")
  table$conference <- as.character(table$conference)
  links_conferences <- table %>%
    filter(grepl("changeConference", links))
  conference_ids <- sub("\\).*", "", sub(".*\\(", "", links_conferences$links))
  conference_ids <- as.data.frame(conference_ids)
  names(conference_ids) <- "conference_id"
  table <- cbind(links_conferences, conference_ids)
  table <- table %>%
    mutate(year = year, division = div, conference_id = as.numeric(as.character(conference_id))) %>%
    select(year, division, everything(), -links) %>% .[-1,]
  table
}
The function needs the user to pass two values: a four-digit year and the division they are interested in (either 1, 2, or 3).
The function takes those inputs and constructs the url based on the inputs. After the html is read and parsed we can extract the names of the conferences and then the links attached to each conference (link_names and links, respectively, in the function).
Now, this is pulling all the links available on the page, so the next step is to combine these two sets of data into a single table and then filter out irrelevant links. Links that include “changeConference” will have the numerical conference codes that we are looking for. After a little string manipulation we will be left with a table that looks like this (for division 1 in 2016):

Now, in some cases the composition of conferences can change from prior years. In order to account for this we can loop over each year and division combination to ensure that we know which schools were members of which conference each year.

To do that we construct a table with all year/division combinations that we are interested in:
year <- c(2013, 2014, 2015, 2016)
division <- c(1,2,3)
div_yr <- expand.grid(year, division)
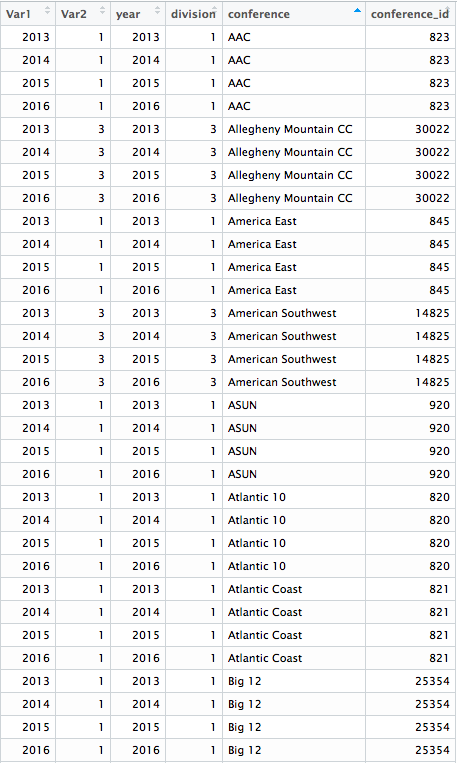
Then, we group the div_yr table by year and division (Var1 and Var2 respectively) and use the do function to loop over all the possible combinations and combine the results into a single table:
conference_code_lu <- div_yr %>%
  group_by(Var1, Var2) %>%
  do(conference_table(.$Var1, .$Var2))
The result will look like this:
Next, we need another function that will scrape the teams and the team urls within each conference. You’ll notice it looks very similar to the conference_table function:
teams <- function(year, conference, div) {
    url <- paste0("http://stats.ncaa.org/team/inst_team_list?academic_year=", year, "&conf_id=", conference, "&division=", div, "&sport_code=MBA")
    read <- read_html(url)
    links <- html_nodes(read, "a") %>%
      html_attr("href")
    link_names <- html_nodes(read, "a") %>%
      html_text()
    table <- as.data.frame(cbind(link_names, links))
    table$links <- as.character(table$links)
    table$link_names <- as.character(table$link_names)
    table <- table %>%
      filter(grepl("team", links)) %>%
      filter(!grepl("inst_team", links)) %>%
      filter(!grepl("schedule", links))
    table$links <- gsub("/team/", "", table$links)
    table$links <- sub("/.*", "", table$links)
    table$year <- year
    table$division <- div
    table$conference_id <- conference
    names(table) <- c("school", "school_id", "year", "division", "conference_id")
    table
}
The major difference is this function also takes the conference_id we just acquired and customizes the url so that we are only scraping the available data for that conference. That allows us to ensure that teams are associated with the right conferences in a given year.
Armed with this function, we can now loop over our conference_code_lu table and apply the new function to all the possible values:
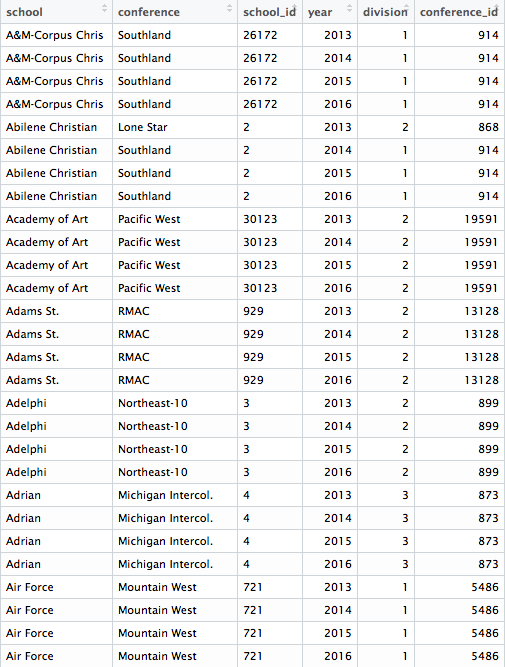
master_ncaa_team_lu <- conference_code_lu %>%
  group_by(year, division, conference, conference_id) %>%
  do(teams(.$year, .$conference_id, .$division)) %>%
  ungroup() %>%
  select(school, conference, everything()) %>%
  mutate(school_id = as.numeric(school_id)) %>%
  arrange(school)
The result is a tidy lookup table that includes each school, their conference, both their school and conference IDs, as well as the year and the division:
Acquiring NCAA Team Statistics
Now that we have our lookup table, acquiring actual NCAA baseball statistics is a piece of cake.
Let’s say we want all batter statistics for Vanderbilt from the 2015 season. To acquire the data you simply feed the ncaa_scrape function the relevant information:
ncaa_scrape(736, 2015, "batting")
Want statistics for Vanderbilt’s pitchers? No problem, just change the type parameter to “pitching”:
> ncaa_scrape(736, 2015, "batting") %>%
+     select(year:SlgPct)
   year     school   conference division Jersey            Player Yr Pos GP GS    BA OBPct
1  2015 Vanderbilt Southeastern        1     43      Wiel, Zander Jr INF 72 71 0.316 0.406
2  2015 Vanderbilt Southeastern        1     20   Reynolds, Bryan So  OF 72 71 0.318 0.388
3  2015 Vanderbilt Southeastern        1     10      Toffey, Will Fr INF 71 67 0.294 0.380
4  2015 Vanderbilt Southeastern        1      8    Wiseman, Rhett Jr  OF 71 71 0.317 0.415
5  2015 Vanderbilt Southeastern        1      7   Swanson, Dansby Jr INF 71 71 0.335 0.423
6  2015 Vanderbilt Southeastern        1      1       Coleman, Ro So INF 66 53 0.295 0.402
7  2015 Vanderbilt Southeastern        1      2   Campbell, Tyler Jr INF 63 61 0.229 0.297
8  2015 Vanderbilt Southeastern        1      3    Kendall, Jeren Fr  OF 60 56 0.281 0.394
9  2015 Vanderbilt Southeastern        1     25     Ellison, Karl So   C 45 43 0.215 0.291
10 2015 Vanderbilt Southeastern        1     18    Rodgers, Nolan So  OF 44 17 0.247 0.396
11 2015 Vanderbilt Southeastern        1      5      Delay, Jason So   C 37 29 0.283 0.373
12 2015 Vanderbilt Southeastern        1     44      Wright, Kyle Fr   P 32  6    NA    NA
13 2015 Vanderbilt Southeastern        1     22   Pfeifer, Philip Jr   P 29 10    NA    NA
14 2015 Vanderbilt Southeastern        1     16      Murfee, Penn Fr INF 29 16 0.256 0.330
15 2015 Vanderbilt Southeastern        1     15    Fulmer, Carson Jr   P 26 25    NA    NA
16 2015 Vanderbilt Southeastern        1     35       Bowden, Ben So   P 26  0    NA    NA
17 2015 Vanderbilt Southeastern        1     24 Sheffield, Jordan Fr   P 22  6    NA    NA
18 2015 Vanderbilt Southeastern        1     21 Kilichowski, John So   P 21 14    NA    NA
19 2015 Vanderbilt Southeastern        1     13   Buehler, Walker Jr   P 18 18    NA    NA
20 2015 Vanderbilt Southeastern        1     55      Green, Tyler Fr INF 17  3 0.238 0.304
21 2015 Vanderbilt Southeastern        1     11      Sabino, Liam Fr INF 17  3 0.240 0.231
22 2015 Vanderbilt Southeastern        1     39       Smith, Kyle Jr  OF 16  0 0.062 0.211
23 2015 Vanderbilt Southeastern        1     40    Snider, Collin Fr   P 16  0    NA    NA
24 2015 Vanderbilt Southeastern        1     31     Johnson, Ryan Fr   P 15  5    NA    NA
25 2015 Vanderbilt Southeastern        1     45   Ferguson, Tyler Jr   P 15  3    NA    NA
26 2015 Vanderbilt Southeastern        1     36   McCarty, Aubrey Fr INF 10  0 0.167 0.167
27 2015 Vanderbilt Southeastern        1      6     Parker, Drake Fr  OF  8  0 0.200 0.200
28 2015 Vanderbilt Southeastern        1     28  Ruppenthal, Matt Fr   P  8  0    NA    NA
29 2015 Vanderbilt Southeastern        1     19       Mundy, Joey Fr INF  7  0 0.333 0.429
30 2015 Vanderbilt Southeastern        1     33    Chari, Tristan Fr   C  6  0 0.500 0.600
31 2015 Vanderbilt Southeastern        1     23     Abraham, Joey Fr   P  6  0    NA    NA
32 2015 Vanderbilt Southeastern        1      -            Totals  -   -  -  - 0.290 0.379
33 2015 Vanderbilt Southeastern        1      -   Opponent Totals  -   -  -  - 0.216 0.314
   SlgPct
1   0.571
2   0.462
3   0.420
4   0.566
5   0.623
6   0.394
7   0.286
8   0.530
9   0.282
10  0.288
11  0.394
12     NA
13     NA
14  0.385
15     NA
16     NA
17     NA
18     NA
19     NA
20  0.238
21  0.320
22  0.125
23     NA
24     NA
25     NA
26  0.167
27  0.200
28     NA
29  0.333
30  0.500
31     NA
32  0.455
33  0.300
Acquiring the pitching data is just as easy:
> ncaa_scrape(736, 2015, "pitching") %>%
+     select(year:ERA)
   year     school   conference division Jersey             Player Yr Pos GP App GS  ERA
1  2015 Vanderbilt Southeastern        1     43       Wiel, Zander Jr INF 72  NA NA   NA
2  2015 Vanderbilt Southeastern        1     20    Reynolds, Bryan So  OF 72  NA NA   NA
3  2015 Vanderbilt Southeastern        1     10       Toffey, Will Fr INF 71  NA NA   NA
4  2015 Vanderbilt Southeastern        1      8     Wiseman, Rhett Jr  OF 71  NA NA   NA
5  2015 Vanderbilt Southeastern        1      7    Swanson, Dansby Jr INF 71  NA NA   NA
6  2015 Vanderbilt Southeastern        1      1        Coleman, Ro So INF 66  NA NA   NA
7  2015 Vanderbilt Southeastern        1      2    Campbell, Tyler Jr INF 63  NA NA   NA
8  2015 Vanderbilt Southeastern        1      3     Kendall, Jeren Fr  OF 60  NA NA   NA
9  2015 Vanderbilt Southeastern        1     25      Ellison, Karl So   C 45  NA NA   NA
10 2015 Vanderbilt Southeastern        1     18     Rodgers, Nolan So  OF 44  NA NA   NA
11 2015 Vanderbilt Southeastern        1      5       Delay, Jason So   C 37  NA NA   NA
12 2015 Vanderbilt Southeastern        1     44       Wright, Kyle Fr   P 32  29  3 1.23
13 2015 Vanderbilt Southeastern        1     22    Pfeifer, Philip Jr   P 29  27  9 3.55
14 2015 Vanderbilt Southeastern        1     16       Murfee, Penn Fr INF 29  NA NA   NA
15 2015 Vanderbilt Southeastern        1     15     Fulmer, Carson Jr   P 26  19 19 1.83
16 2015 Vanderbilt Southeastern        1     35        Bowden, Ben So   P 26  26 NA 2.89
17 2015 Vanderbilt Southeastern        1     24  Sheffield, Jordan Fr   P 22  22  6 2.85
18 2015 Vanderbilt Southeastern        1     21  Kilichowski, John So   P 21  17 10 2.83
19 2015 Vanderbilt Southeastern        1     13    Buehler, Walker Jr   P 18  16 16 2.95
20 2015 Vanderbilt Southeastern        1     55       Green, Tyler Fr INF 17  NA NA   NA
21 2015 Vanderbilt Southeastern        1     11       Sabino, Liam Fr INF 17  NA NA   NA
22 2015 Vanderbilt Southeastern        1     39        Smith, Kyle Jr  OF 16  NA NA   NA
23 2015 Vanderbilt Southeastern        1     40     Snider, Collin Fr   P 16  16 NA 2.41
24 2015 Vanderbilt Southeastern        1     31      Johnson, Ryan Fr   P 15  15  5 3.02
25 2015 Vanderbilt Southeastern        1     45    Ferguson, Tyler Jr   P 15  15  3 6.30
26 2015 Vanderbilt Southeastern        1     36    McCarty, Aubrey Fr INF 10   5 NA 3.00
27 2015 Vanderbilt Southeastern        1      6      Parker, Drake Fr  OF  8  NA NA   NA
28 2015 Vanderbilt Southeastern        1     28   Ruppenthal, Matt Fr   P  8   8 NA 2.70
29 2015 Vanderbilt Southeastern        1     19        Mundy, Joey Fr INF  7  NA NA   NA
30 2015 Vanderbilt Southeastern        1     33     Chari, Tristan Fr   C  6  NA NA   NA
31 2015 Vanderbilt Southeastern        1     23      Abraham, Joey Fr   P  6   6 NA 7.94
32 2015 Vanderbilt Southeastern        1     32      Stone, Hayden So   P  3   3  1 9.64
33 2015 Vanderbilt Southeastern        1     34 Spagnuolo, Brendan Fr   P  1   1 NA 9.00
34 2015 Vanderbilt Southeastern        1      -             Totals  -   -  -  NA NA 2.84
35 2015 Vanderbilt Southeastern        1      -    Opponent Totals  -   -  -  NA NA 5.75
You can also acquire data from the same school across multiple years. You need to use both the ncaa_scrape function as well as the dplyr package.
You first create a table with each year you want and the school_id for the school. This can be built with the expand.grid function. Then, that table is grouped by the two relevant variables and fed into the do function. This will take the ncaa_scrape function and apply it to all relevant combinations of year and school_id found in the table you just made with expand.grid:
year <- c(2014, 2015, 2016)
school_id <- 736
division <- 1
v_table <- expand.grid(school_id, year)
v_table %>%
  group_by(Var1, Var2) %>%
  do(ncaa_scrape(.$Var1, .$Var2, "pitching"))
|=================================================================|100% ~0 s remaining     Source: local data frame [100 x 43]
Groups: Var1, Var2 [3]

    Var1  Var2  year     school   conference division Jersey          Player    Yr   Pos
   <dbl> <dbl> <dbl>      <chr>        <chr>    <dbl>  <chr>           <chr> <chr> <chr>
1    736  2014  2014 Vanderbilt Southeastern        1      3    Conde, Vince    Jr   INF
2    736  2014  2014 Vanderbilt Southeastern        1     20 Reynolds, Bryan    Fr    OF
3    736  2014  2014 Vanderbilt Southeastern        1      7 Swanson, Dansby    So   INF
4    736  2014  2014 Vanderbilt Southeastern        1     10   Norwood, John    Jr    OF
5    736  2014  2014 Vanderbilt Southeastern        1     43    Wiel, Zander    So   INF
6    736  2014  2014 Vanderbilt Southeastern        1      8  Wiseman, Rhett    So    OF
7    736  2014  2014 Vanderbilt Southeastern        1      9  Turner, Xavier    So   INF
8    736  2014  2014 Vanderbilt Southeastern        1     18  Rodgers, Nolan    Fr   INF
9    736  2014  2014 Vanderbilt Southeastern        1      1     Coleman, Ro    Fr   INF
10   736  2014  2014 Vanderbilt Southeastern        1      5    Delay, Jason    Fr     C
# ... with 90 more rows, and 33 more variables: GP <chr>, App <int>, GS <int>, ERA <dbl>,
#   IP <dbl>, H <int>, R <int>, ER <int>, BB <int>, SO <int>, SHO <int>, BF <chr>,
#   `P-OAB` <chr>, `2B-A` <int>, `3B-A` <int>, Bk <int>, `HR-A` <int>, WP <int>, HB <int>,
#   IBB <int>, `Inh Run` <int>, `Inh Run Score` <int>, SHA <int>, SFA <int>,
#   Pitches <chr>, GO <int>, FO <int>, W <int>, L <int>, SV <int>, KL <int>, teamid <dbl>,
#   conference_id <dbl>
The end result is a dataframe with all three years of data combined together.
You could also include a series of school_ids in that table that you feed into the do(ncaa_scrape) function if you wanted to pull multiple schools at once. The example below will provide data for both Florida and Vanderbilt from 2014-2016:
year <- c(2014, 2015, 2016)
school_id <- c(235, 736)
v_table <- expand.grid(school_id, year)
v_table %>%
  group_by(Var1, Var2) %>%
  do(ncaa_scrape(.$Var1, .$Var2, "pitching"))
|=================================================================|100% ~0 s remaining     Source: local data frame [197 x 43]
Groups: Var1, Var2 [6]

    Var1  Var2  year  school   conference division Jersey          Player    Yr   Pos
   <dbl> <dbl> <dbl>   <chr>        <chr>    <dbl>  <chr>           <chr> <chr> <chr>
1    235  2014  2014 Florida Southeastern        1     12  Martin, Richie    So   INF
2    235  2014  2014 Florida Southeastern        1     17  Gushue, Taylor    Jr     C
3    235  2014  2014 Florida Southeastern        1      2  Turgeon, Casey    Jr   INF
4    235  2014  2014 Florida Southeastern        1     23     Reed, Buddy    Fr    OF
5    235  2014  2014 Florida Southeastern        1     20   Alonso, Peter    Fr   INF
6    235  2014  2014 Florida Southeastern        1     33 Mattson, Braden    Jr     C
7    235  2014  2014 Florida Southeastern        1      5    Powers, Zack    Jr   INF
8    235  2014  2014 Florida Southeastern        1     66    Larson, Ryan    Fr    OF
9    235  2014  2014 Florida Southeastern        1     16  Shafer, Justin    Jr    OF
10   235  2014  2014 Florida Southeastern        1     11    Tobias, Josh    Jr   INF
# ... with 187 more rows, and 33 more variables: GP <chr>, App <int>, GS <int>, ERA <dbl>,
#   IP <dbl>, H <int>, R <int>, ER <int>, BB <int>, SO <int>, SHO <int>, BF <chr>,
#   `P-OAB` <chr>, `2B-A` <int>, `3B-A` <int>, Bk <int>, `HR-A` <int>, WP <int>, HB <int>,
#   IBB <int>, `Inh Run` <int>, `Inh Run Score` <int>, SHA <int>, SFA <int>,
#   Pitches <chr>, GO <int>, FO <int>, W <int>, L <int>, SV <int>, KL <int>, teamid <dbl>,
#   conference_id <dbl>
References & Resources
- Code available in my GitHub repo
How would you scrape all the teams at once?
I often get errors when doing more than 2 teams at once
Quick comment on R: the dplyr function slice() allows you to select rows of a data frame similar to select() with columns. For instance, slice(-1) removes the first row.