Rethinking the Strike Zone: It’s Not a Square

Calling a clean strike zone isn’t easy, but what if we’ve had the shape wrong all along? (via Andrew Malone)
The strike zone isn’t a square. And it’s not a rectangle either. It’s a superellipse.
Back in 2012, Lookout Landing’s Matthew Carruth (who runs StatCorner.com) correctly pointed this out.
This series, kicking off today, will hopefully reshape the way we think of the strike zone, starting off by throwing out our preconceptions of what the strike zone’s true shape is, followed by reshaping the way we slice up the strike zone. One day, hopefully in the near future, when an analytically-inclined baseball broadcast shows you a weird, rounded rectangle as the strike zone, you’ll understand why.
We’re not talking about the rule book strike zone, which is very clearly a precise rectangle. We’re talking about the practical strike zone, a probabilistic zone that implies a likelihood of a pitch being called a strike when the batter doesn’t swing.
A common definition of where the outer edge of the strike zone should be is to find the point where pitches taken have a 50/50 chance of being called a strike. We’ll use the same definition today, as well as explore what the zone would look like at different probability thresholds.
For clarity, we’ve flipped the x-axis for left-handed batters, such that negative values are always inside (closer to the batter) and positive values are always outside, farther away from the batter. A px (horizontal location) value of zero should represent the true center of the plate.
Before we delve into depicting and calculating the strike zone, we need a very precise definition of the center with respect to the x-axis (horizontal), measured as the “px” or “plate_x” value. One could naively assume the zero value in the PITCHf/x data would be the true center. This would not be correct. Well, to be more precise, one could argue that it is correct; however, we’ll take a (not-so-brief detour) and make a judgement call as to the true center. Again, we’re less concerned with what the physical center of the plate is. We’re looking for either (a) the point at which the probability of a called strike is greatest (hard to measure) or (b) the mid-point between the edges, where probabilities fall to 50 percent. We’ll be using method (b).
A picture is worth a thousand formulae:

What you’re looking at is a graph of called-strike percent, split by the four pitcher-batter handedness matchups, within a narrow band of vertical locations (2.0 feet to 2.8 feet above the plate). This is largely to eliminate the effect vertical location has on the probability of a pitch being a called strike.
We see the orange line (left-handed pitcher, right-handed batter) and the purple line (right-handed pitcher and right-handed batter) are almost identical, indicating the dominant factor is the handedness of the batter. Left-handed batters have a slightly different horizontal zone when facing left-handed pitchers (blue line) than when facing right-handed pitchers (green line), but the difference is negligible, lending further evidence to the assumption that the key factor is the side of the plate where the batter is standing, rather than which arm the pitcher throws with. I’m a huge fan of simplification, so let’s collapse these into a view that only cares about the handedness of the batter, ignoring the pitcher entirely:
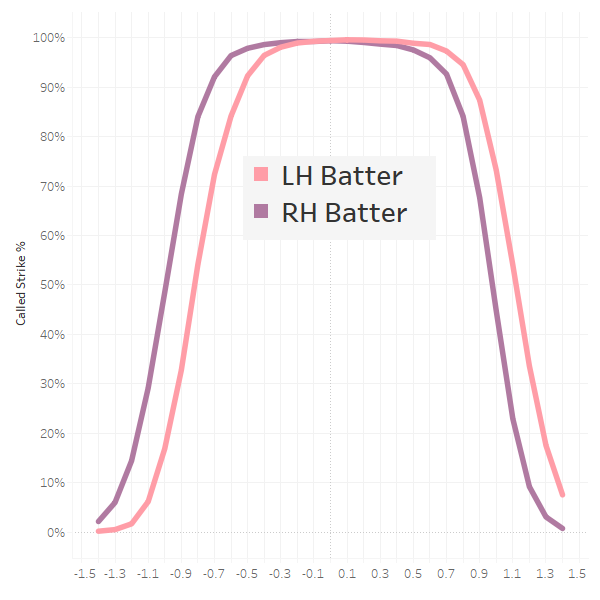
The first thing that jumps out of the picture is that the lefty strike zone is decidedly different than the righty one. Keep in mind that we’ve flipped the axis for lefty hitters, so negative values are always closer to the batter. The strike zone for a left-handed batter typically extends about 0.1 feet farther away as compared to a right-handed hitter, whereas a right-handed hitter will have a strike zone that ends about 0.2 feet closer to him. To find the true center, we’ll take a few separate measurements, each with a progressively wider vertical slice of the strike zone and take a look at the midpoints. The average pitch has a height of 2.3 feet, so we’ll start at 2.2 feet to 2.4 feet and expand from there.
| Height Min | Height Max | RH Inside Edge | RH Outside Edge | RH Mid | LH Inside Edge | LH Outside Edge | LH Mid |
|---|---|---|---|---|---|---|---|
| 2.2 | 2.4 | -1.000 | 0.975 | -0.013 | -0.825 | 1.125 | 0.150 |
| 2.0 | 2.6 | -1.000 | 0.975 | -0.013 | -0.825 | 1.125 | 0.150 |
| 1.8 | 2.8 | -0.975 | 0.950 | -0.013 | -0.800 | 1.100 | 0.150 |
| 1.6 | 3.0 | -0.950 | 0.925 | -0.013 | -0.775 | 1.075 | 0.150 |
| 1.4 | 3.2 | -0.925 | 0.900 | -0.013 | -0.725 | 1.050 | 0.163 |
| 1.2 | 3.4 | -0.900 | 0.875 | -0.013 | -0.675 | 1.025 | 0.175 |
| 1.0 | 3.6 | -0.850 | 0.825 | -0.013 | -0.600 | 1.000 | 0.200 |
The horizontal strike zone for right-handed batters is extremely consistent, regardless of vertical location, and very close to a value of zero. We can confidently call the center -0.0125, which we will use as our adjustment. For left-handed batters, the strike zone drifts away the more vertical real estate we include. This was pretty stable within the vertical strike zone, so we’ll assume the “true” center of the plate for a left-handed batter is 0.15 feet to the outside.
Let’s Look at Some Cool Hex Charts
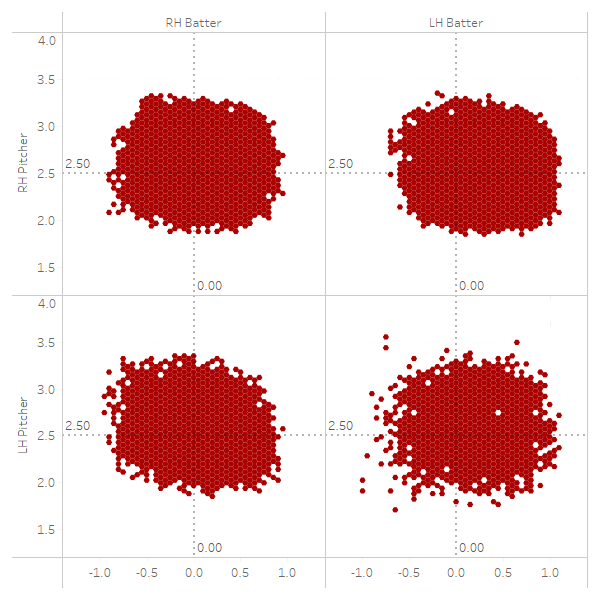
I’m an avid board game player, of the heavy euro strategy variety. They often employ a technique wherein all the tiles/areas of the game are split into “hexes.” These work exceptionally well at dividing up an arbitrary area into even spaces, as opposed to square grids, which can have very sharp edges. We’ll employ this technique today to visualize the strike zone at various probability thresholds, split by the four pitcher-batter handedness permutations. Each hexagon will be filled in if it’s greater than the specified threshold and blank if it’s below. After experimenting with a few methods, this produced the clearest visuals, as opposed to a heat map, with layers of probabilities.
Strike Zone = Called Strike has a >= 50% Probability
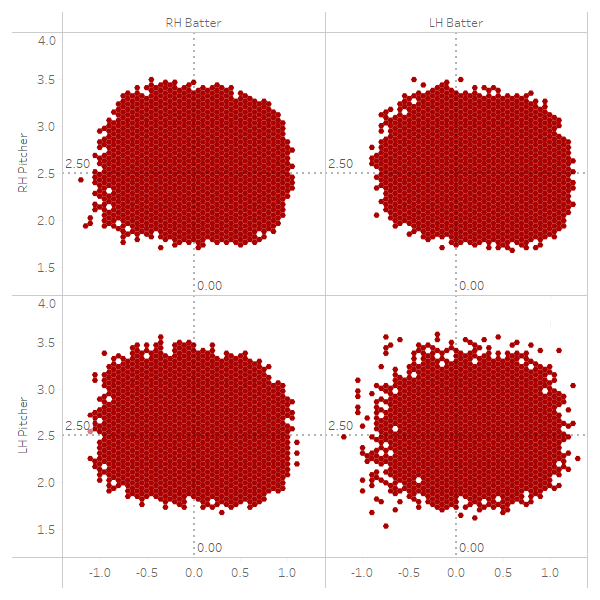
The first thing I want to draw your attention to is how the strike zone is shifted to the outside for left-handed batters, as discussed above. Righty-righty up and in is more sparse than lefty-righty up and in. Similarly, up and in to a left-handed batter is more likely to be called a strike from the opposite-handed pitcher. Note that lefty-lefty match-ups have by far and away the smallest sample sizes, leading to the noisier chart.
Before we attempt to classify this into a specific shape, let’s first indulge ourselves in a few more hex charts:
Strike Zone = Called Strike has a >= 60% Probability
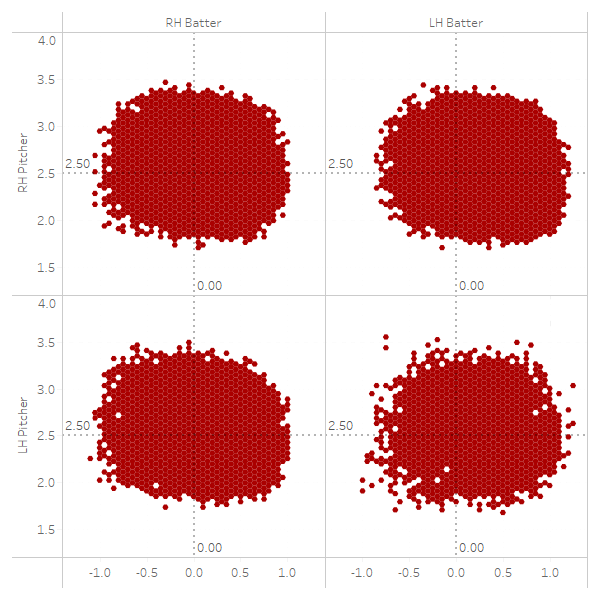
Strike Zone = Called Strike has a >= 70% Probability
Strike Zone = Called Strike has a >= 80% Probability
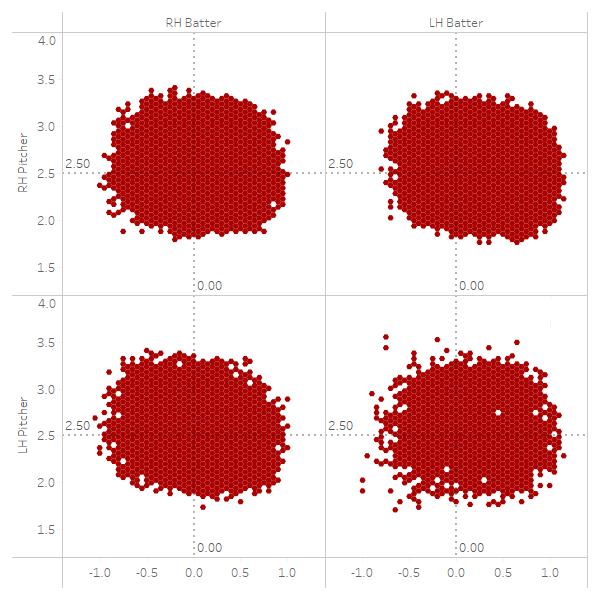
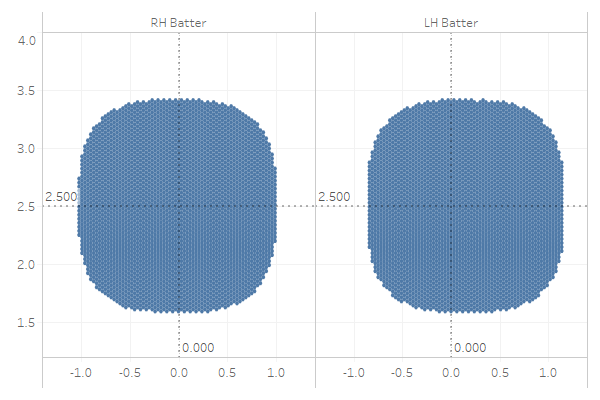
Each set of hex charts show a consistent shape–something close to a rounded rectangle, which isn’t an overly complex shape to describe mathematically. One could argue it is an ellipse, but to my eye, especially at the 50 percent, 60 percent and 70 percent probability levels, the edges are much closer to flat lines than curves. Let’s take one final look, this time at the 50 percent threshold, but ignoring the handedness of the pitcher:
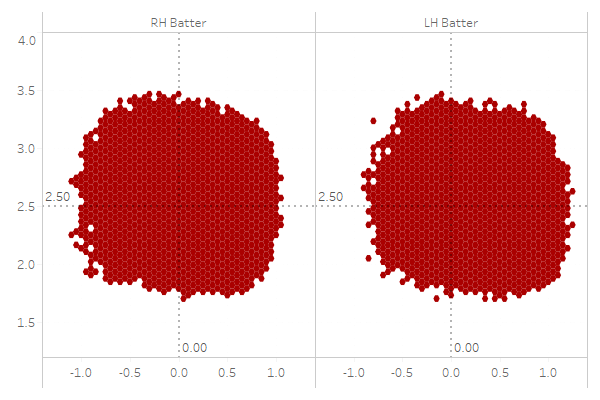
I want to draw your eye to the RH batter between approx 2.7 feet and 2.0 feet high. I can see an argument for describing that as a gentle arc, or one for describing it as a line. The top of the right-handed batter strike zone is probably more of an arc, whereas the bottom is more of a line. Zooming out a bit, to my eye, an ellipse will not accurately describe either shape.
The strike zone is supposed to be a rectangle. Umpires, when they have to judge both the vertical and horizontal probabilities at the same time, are more likely to err. When only one or the other is in question, it is far more linear. Thus, it makes sense that in the middle of both the vertical and horizontal strike zones, we would see something more resembling the rule-book strike zone. As we approach the edges of both, this should approximate more of an exponential function.
So if it’s not a rounded rectangle nor an ellipse, what should we call this shape?
Math (that I don’t really fully understand) to the rescue! It’s a superellipse!
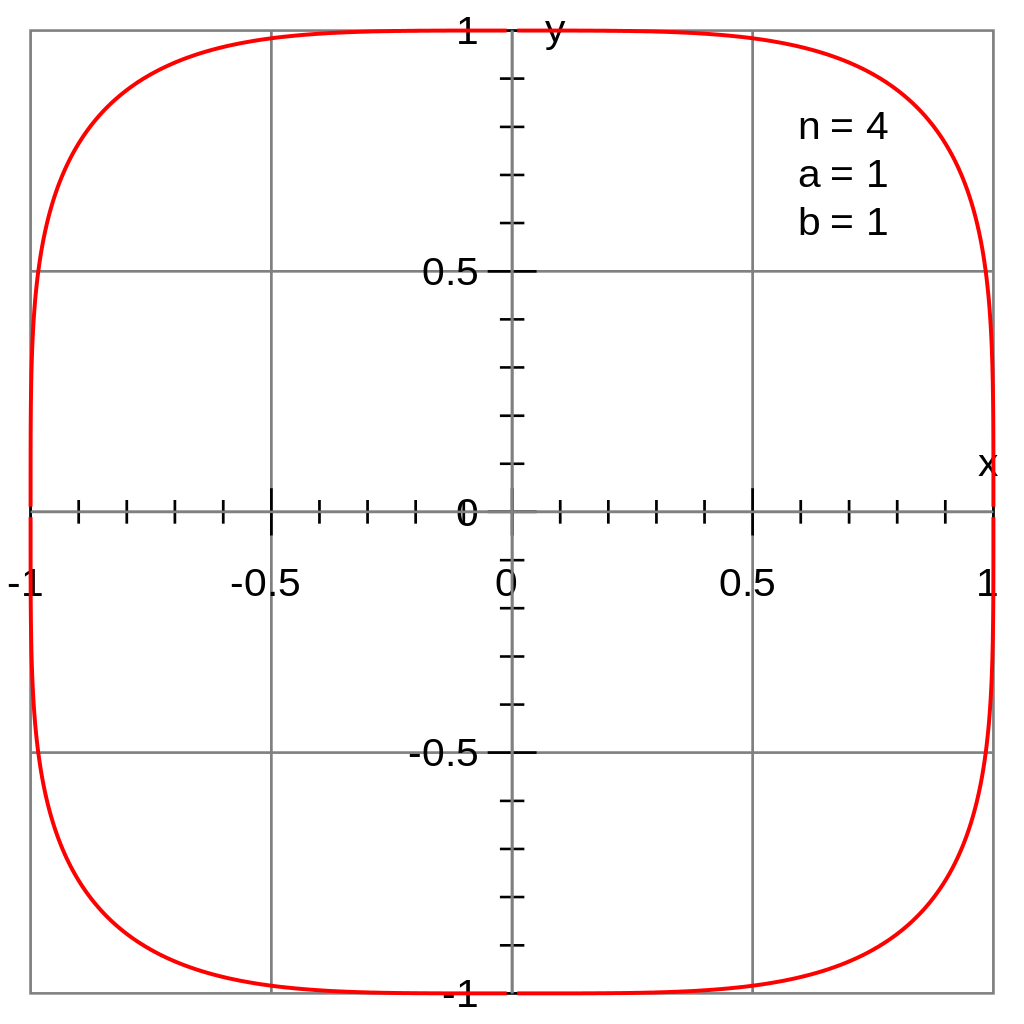
We’ll need to make sure the height and width are proportional, but to my untrained eye, that looks like a pretty good approximation. Basically, a superellipse will look like a rounded rectangle when n >2. When n=2, we have an ordinary ellipse. Thus, our task is to find the appropriate value of n that will give us a picture closest to the above strike zones. The value of n is arbitrary and changes the shape.
This is the formula we’ll be using to define the strike zone:
x = Adjusted px, shifted +0.125 for right-handed batters and -0.15 for left-handed batters. This is considered to go from +1 to -1.
z = Centered around 2.5, going from 1.6 to 3.4 for an implied range of -0.9 to 0.9
n = The number we’ll play with to change the shape of the curve
ZONE: |(x/1)|n + |((z-2.5)/0.9)|n <=1
The | | bars just mean absolute value. If you were to change the width of the horizontal zone to, say, 0.9 feet, you would divide x by 0.9. Similarly, if you wanted to expand the vertical zone to +/- 1, you would divide (z-2.5) by 1.0 instead of 0.9. Here’s what it looks like with n=4, using the same hex-chart viz for consistency (with greater hex density).
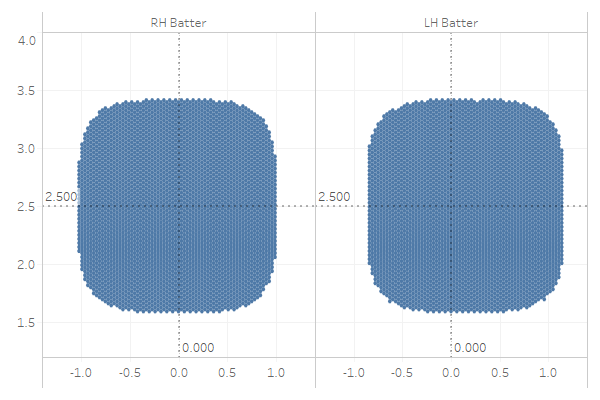
That looks a little too… square. Let’s try with n=3:
Much better! That actually does a pretty good job of approximating the strike zone with a simple formula that can be easily computed in Excel. Note that I couldn’t get the vertical scales to match up perfectly; however, as noted above, if the shape looks like it should be squashed or squeezed, this can be easily done by adjusting the denominators for x and z (1.0 and 0.9, respectively). This is the formula I ended up with:
Simplified In Zone: |x|3 + |((z-2.5)/0.9)|3 <=1
Note Regarding the Vertical Center
This model assumed the vertical center of the zone was at 2.5 feet. Future research will modify this to be variable based on the batter’s height. Ideally, our formula stated above should include the batter’s height as a variable to get a more accurate zone. For now, this is currently a blind spot.
Conclusion
Umpires are fallible; they’re human, after all. Accurately calling a ball or strike along one axis is really hard. When two axes are involved, this become exponentially more difficult. This is why the corners of the strike zone are more accurately described by circles, and the interior edges are more accurately described by a gently sloping arc that is close to a straight line. We’ve glossed over some of the eccentricities of lefty-versus-lefty and righty-versus-righty that don’t conform tightly to our model. However, the proposed In Zone metric should more closely model the 50 percent zone than a simple rectangle or ellipse would.
Throwing to the absolute corner gives you a significantly lower probability of getting a called strike than you would naturally assume based on the rule book strike zone. Telecasts that show you pitches “painting” the corner should also make you aware that the corners are tough places to get called strikes. Pitchers who throw to the corners do so at their own peril. Batters and pitchers, as well as we the fans, should look at the strike zone as a sifting set of probabilities that form a beautiful superellipse, where n is approximately 3, b = 0.9 and a =1.
Editor’s Note: Wayne Boyle, Sean O’Rourke, Jeff Long, and Harry Pavlidis have contributed important research in this space. The citations for that work were improperly omitted from the original version of this piece, but are included now. We regret the omission.
References and Resources
- Wayne Boyle, Baseball Prospectus, “Prospectus Feature: The Universal Strike Zone“
- Wayne Boyle, Sean O’Rourke, Jeff Long, and Harry Pavlidis, Baseball Prospectus, “Robo Strike Zone: It’s Not as Simple as You Think“
- Matthew Carruth, Lookout Landing, “The Strike Zone“
- Jon Roegele, The Hardball Times, “The 2017 Strike Zone“
- The Last Data Bender, “Even Hexier Than Before“
- Wolfram MathWorld, “The Rounded Rectangle“
- Wikipedia, “Superellipse“
This is very helpful, and its most important implications are not the ones the article is directly engaged with. In fact, by repeatedly invoking the locations in the corners where the umpires make “mistakes” (i.e. don’t call the rule book strike zone) it may even obscure the most important question about how baseball is played and how we would want it to be played. That is, the corners of the strike zone, the ones where the umpires do not accurately call the rule book strike, are also the hardest to hit strikes in the game. Everyone implicitly already knows this, and in fact has already known it for decades if not centuries. Would we really want a game where this was “fixed” and where there were that many more strikes in the corners – tilting the game that much further toward the pitcher, and toward a further reduction in action?
The problem with the position that we want a machine called, rather than human called, strike zone, is that the imperfection in the strike zone called by human umpires actually brings the strike zone out of the realm of the ideal, and closer to the actually capacity of human beings to perceive and hit the ball – for the same reason they are the pitches it is hardest for the umpire to perceive them as strikes! Instead we get a few more higher and lower strikes at middle of the plate, a few more inside and outside strikes at mid height, and many more balls at the corners – advantages to the hitter that baseball desperately needs to preserve!
If we were to move to a machine called strike zone – and there are still arguments for it – we would need to redefine the rule book strike zone in this direction, to make sure that the machine knew how to “cheat” in the same ways. Otherwise we would go that much further in the direction of making baseball a TTO game tilted extremely to the advantage of the pitcher, and making it far less appealing to watch.
It’s not a matter of teaching the machines to “cheat.” It’s a matter of, as you say, redefining the strike zone and then teaching the machine to perfectly call that new definition.
The problem with human umpires isn’t that they never call strikes in the corners; the problem is that they are incredibly inconsistent (both between umps and individually) at anything that isn’t right over the plate.
Yeah, discussions only occasionally engage with this, but if we get robots to call the precise zone it will be a very different game. For the reasons you say, but another is the current effect of count on the called zone — it currently gets much smaller in pitcher’s counts, and larger in hitter’s. If we take that away we’ll have more walks and strikeouts. Of course pitchers will adapt too, but that’s the direction of the effect.
Isn’t it actually a pentagonal prism?
I doubt any umps actually visualize it as such tho.
Do any of those various programs that call them actually use the prism?
Eli, first of all great article. Second, I wanted to suggest that you try the following formula |x|^(3) + |((z-2.625)/0.8)|^2.5 <=1 for perhaps a better fit to the data. Since it appeared that the top of the zone was about 3.4 and the bottom was about 2.8 in your earlier hex graphs I nudged it up about an 1/8th of a foot. Also I changed the x exponent to a fractional exponent, 2.5. The exponents do not need to be identical and can be fractional. Independently varying the x and z exponents allows for the vertical and horizontal edges of the strike zone to be more of a curved or linear edge depending on the value chosen and can per. I used 2.5 as the exponent for z because it resulted in a slightly more curved sides of the strike zone that I think visually matches the data a tiny bit better.
Cool! Didn’t realize you could vary the exponents. My hope is that someone who understands geometry better than me (not hard, to be honest), will figure out a more accurate formula. Thanks for reading and the feedback.
We know that umpires have this sigmoid shape at a single edge, and a rounded rectangle shape for a slice across either acid. It seems like a solid model would be that the whole zone is the product of those for the two axes, leading naturally to this rounded rectangle shape.
That’s not mathematically a superellipse, right, that’s just a graphical approximation?
Insofar as a strike occurs when any part of the ball passes through any part of the pentagonal prism volume, it makes sense that the area encompassing all strikes as they cross the front of the plate is not square, but will depend on the distribution of pitch trajectories, which have neither up/down nor left/right symmetry.