Sacrificing in 2005 Redux
For just a moment I hesitated while writing the article “Not So Sweet Surrender.” I knew that discussing the merits of the sacrifice among baseball fans would be a bit like debating the various theories of mass extinction at the end of the Permian period among paleontologists—that is, a discussion overflowing with opinion but absent a whole lot of concrete information. But in the end I plunged into the water and laid out some basic facts regarding sacrifice attempts, successes and how they relate to the standard argument against sacrificing used by many sabermetricians.
But like a paleontologist who often needs to go back into the field to uncover more fossils in order to provide a more robust interpretation, a sabermetrician or “performance analyst” usually needs to build on his data in order to be more certain in his analysis.
And so it is in that spirit that this week I present a few more fossils related to sacrifices from the play-by-play data for 2005 and answer a few of the questions on the minds of readers.
Slicing Through the Strata
Several readers noted that I mentioned in the initial article that the sacrifice success rate for pitchers was less than that for position players but failed to quantify that statement. The following table lists the attempts, successes (defined as a successful sacrifice or the defense recording zero outs on the play) and the percentage by position.
Pos        Att    Succ     Pct
1B          47      41   0.872
LF         138     119   0.862
DH          27      23   0.852
2B         264     224   0.848
C          170     143   0.841
CF         230     193   0.839
RF          77      62   0.805
SS         305     244   0.800
3B         128     101   0.789
PH          82      62   0.756
P          887     582   0.656
          2355    1794   0.762
Interestingly, first basemen and designated hitters come out first and third, although the sample size is small. Could the element of surprise as a lumbering power hitter lays down a bunt play a role here?
Also, you can see that all three outfield spots were successful more frequently than shortstops, while catchers ranked a somewhat surprising fifth. Neither of these are results I would have expected, since middle infielders are often assumed to be better handlers of the bat.
Pitchers were expected to come in last, although the fact that they were 10% worse than any position player was a larger gap than expected. Overall, position players were successful 82.6% of the time (1,212 of 1,468), a full 17% better than pitchers. As hinted at in the previous article, however, more than half this difference can be attributed to the fact that managers “ask” pitchers to bunt much more frequently with two strikes than they do position players, resulting in many more strikeouts. When those attempts are subtracted, pitchers are successful 76% of the time.
Of course once we slice the data by position we might as well do so for inning and score as shown in the following two tables.
By Inning
       Att    Succ     Pct
 1     155     140   0.903
 2     250     174   0.696
 3     318     224   0.704
 4     215     165   0.767
 5     305     212   0.695
 6     221     177   0.801
 7     276     214   0.775
 8     304     235   0.773
 9     201     168   0.836
10      50      45   0.900
11      28      18   0.643
12      24      17   0.708
13       4       3   0.750
14       1       0   0.000
15       2       2   1.000
16       1       0   0.000
By Score
Score    Att    Succ     Pct
<=-5      21      16   0.909
  -4      23      17   0.739
  -3      54      39   0.722
  -2     138     100   0.725
  -1     377     290   0.769
   0     809     633   0.782
   1     352     257   0.730
   2     284     219   0.771
   3     158     118   0.747
   4      80      64   0.800
 >=5      59      41   0.750
What you’ll notice here is that managers don’t seem to have a preference for what inning they sacrifice in (except perhaps the first), while they certainly do have a preference based on the score. It’s interesting that almost a third (31%) of all sacrifice attempts in 2005 occurred before the fourth inning.
Earl Weaver would not be pleased.
What this likely reflects is the convergence of two factors: first, the prevalent idea that “getting on top” early puts the opponent at a greater disadvantage (perhaps psychologically and strategically) than the score would otherwise indicate, and second, the fact that starting pitchers come to bat a greater percentage of the time in the early innings than they do later in the game. While I haven’t looked into the first factor (although others have), the following table backs up the second factor by showing that over 60% of pitchers’ sacrifices occur in the fourth inning or before and 80% occur before the sixth inning.
Inning    Att     Pct
    1       4   0.005
    2     188   0.212
    3     212   0.239
    4     133   0.150
    5     180   0.203
    6      88   0.099
    7      55   0.062
    8      20   0.023
    9       3   0.003
   12       4   0.005
The high success rate in the first inning is due to the fact that pitchers aren’t typically sacrificing in the first inning, when the work is usually being done, and done quite well I might add, by the second hitter in the lineup.
The following graph shows the sacrifice attempts by score differential.
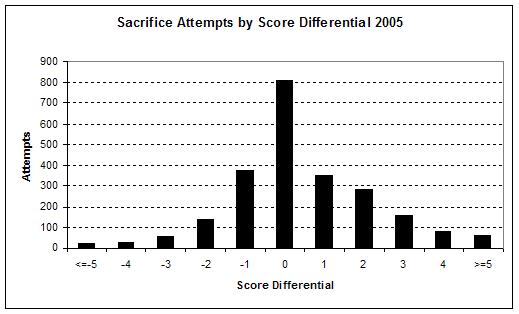
No surprise here. Over a third of all sacrifice attempts occur when the score is tied and managers are reluctant to sacrifice when down by more than one run (just 10% of attempts). Managers will continue to sacrifice, however, when ahead, and they even did so about 140 times when up by four or more runs. You can never have enough runs.
Along with the breakdown by inning and position, several readers wanted to know what individuals were the most successful because I’d teased them with a list of players who had the most attempts. The following two tables show the leaders and trailers in sacrifice percentage for those with 10 or more attempts.

Leaders
                    Att    Succ     Pct
Dave Roberts         13      13   1.000
Derek Jeter          10      10   1.000
Kenny Lofton         10      10   1.000
Luis Castillo        19      19   1.000
Miguel Cairo         12      12   1.000
Nick Punto           10      10   1.000
Nook Logan           16      15   0.938
Tadahito Iguchi      13      12   0.923
Juan Uribe           13      12   0.923
Omar Vizquel         25      23   0.920
Cory Sullivan        12      11   0.917
Angel Berroa         12      11   0.917
Aaron Miles          11      10   0.909
Randy Winn           11      10   0.909
Kyle Davies          11      10   0.909
Juan Castro          11      10   0.909
Nick Green           11      10   0.909
Alex Sanchez         10       9   0.900
Andy Pettitte        17      15   0.882
Jack Wilson          15      13   0.867
Trailers
                    Att    Succ     Pct
Doug Davis           10       2   0.200
Jon Lieber           10       3   0.300
Josh Beckett         11       4   0.364
Mark Redman          10       4   0.400
Ramon Ortiz          15       6   0.400
Eric Milton          12       5   0.417
Chris Carpenter      20      10   0.500
Victor Zambrano      10       5   0.500
Pedro Martinez       12       6   0.500
Esteban Loaiza       13       7   0.538
Jeff Francis         11       6   0.545
Brad Halsey          11       6   0.545
AJ Burnett           16       9   0.563
Greg Maddux          12       7   0.583
Ben Sheets           11       7   0.636
Roy Oswalt           11       7   0.636
Royce Clayton        15      10   0.667
Woody Williams       12       8   0.667
Brandon Webb         19      13   0.684
Cristian Guzman      13       9   0.692
Not a lot of surprises in these lists either. The leaders are speedy position players with good bat control, with the exception of pitchers Andy Pettitte and Kyle Davies, and the trailers are a bunch of pitchers, with the exception of Royce Clayton and Cristian Guzman. (Did anything go right for him in 2005?) I was a bit surprised to see Greg Maddux on the list, although obviously the small number of attempts doesn’t lead to any forceful conclusions.
Run Expectancy and Scoring Probability
There were several readers who expressed a bit of consternation over the following cryptic paragraph in the initial article:
“Of course the above is based on the assumption that an average hitter is at the plate. Pitchers are the most often called upon to sacrifice, and they are anything but average. We can adjust for that as well by adjusting the probability of success based on an average pitcher’s performance.”
The questions that arose from this were generally related to how this bit of magic was done and if it was done by adjusting the Run Expectancy or Scoring Probability matrices for pitchers. The short answer is yes. The long answer follows.
You’ll remember that both matrices (I showed the Scoring Probability matrix for the period 1999-2002 in the initial article) are based on the average hitter, therefore taking into account both pitchers and position players. If the matrices only included pitchers, then obviously the values in the matrix (the number of expected runs and the probability of scoring runs) would be lower since pitchers don’t move runners around the bases as efficiently as other hitters. As a result the break-even percentages for attempting a sacrifice, stolen base or any other strategic option would correspondingly be lower since the cost of failure is lower with a pitcher at the plate. In economic terms, the opportunity cost for each pitcher plate appearance is less than that for an average hitter, so it is more often beneficial to sacrifice an out for a base.
Because of this fact it’s clearly not fair to decide whether pitchers should sacrifice by looking at the standard matrices. So what I did was adjust the individual cells of each matrix for pitchers by multiplying their average outcomes by the run expectancy or probability of scoring given each outcome and then summing the results.
To illustrate this process let’s look at the situation when a runner is on first and there is nobody out. According to the Scoring Probability matrix, in this base/out situation, there is a 43.7% chance of scoring in the remainder of the inning. Since this is too high when a pitcher is at the plate, we’ll first break down the average pitcher’s outcomes by plate appearance like so:
Out      .798
Single   .120
Double   .027
Triple   .002
Homerun  .008
Walk     .047
This represents the performance of an average pitcher from 1999-2002.
We can then multiply each of these probabilities by the probability of scoring given each outcome. For example, a pitcher makes an out .798 of the time, so we’ll multiply that by .283 which is the resulting scoring probability if the sacrifice fails (with failure being defined as resulting in a runner on first with one out) for a value of .226. We can then do likewise for each of the outcomes shown above.
Outs       0.798   0.283   0.226
1B         0.120   0.641   0.077
2B         0.027   0.876   0.024
3B         0.002   1.000   0.002
HR         0.008   1.000   0.008
BB         0.047   0.641   0.030
Total                      0.367
Granted we need to make a few assumptions here regarding the base/out situation after each outcome, but overall this will give us the approximate probability of each base/out situation occurring after the pitcher’s plate appearance.
We can then add all of these up to come up with the scoring probability of 36.7% when a pitcher is at the plate. In other words, the chances of scoring drop by 7%. You’ll note that this drop is confined to the impact of the pitcher since we’ve use the standard probabilities in the calculation above to represent the outcomes for the remainder of the inning.
This lower number is then used in the calculation of the break-even percentage as Pv in the equation:
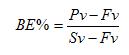
where Pv = Present Value, Fv = Failure Value, and Sv = Success Value.
So with a man on first and nobody out, the BE% for an average hitter would be calculated as:
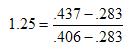
while for a pitcher the calculation would be:
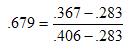
In other words, with a pitcher hitting, the sacrifice attempt needs to be successful 67.9% of the time, while for an average hitter it’s “always” more cost effective to swing away.
Several other readers, however, pointed out that these matrices, are based on the aggregate of all situations, and all hitters don’t reflect the many nuances of the game, many of which drive these strategic decisions. Absolutely correct. If you wanted to create a perfect model there wouldn’t be a single matrix but rather dynamic matrices that would morph to include the effects of team, park, pitcher, speed on the bases, defensive positioning, score, weather and the next hitters in the lineup, as well as every other data point you can think of. Just as physicists use models to describe physical reality, the standard matrices are simply a model or approximation of the more complex reality on the diamond. The analyses derived from them are therefore useful for narrowing the range of possible answers to specific questions, which we hope at least get us in the ballpark so to speak.
Finally, thinking along these lines, another astute reader pointed out that while I included in my definition of a successful sacrifice events when no outs were recorded by the defense, I then compared this to the break-even percentage, which does not include these “very successful” sacrifice attempts. Once again, that is absolutely the case and the calculations in the previous article were first-order approximations.
In order to be more precise one would have to calculate derivative matrices that weighted the actual outcomes from sacrifice attempts. For example, in 2005 with a runner on first and nobody out we can break down the percentage of sacrifice attempts that were successful under my definitions as follows:
When calculating the break-even percentage, our Sv, instead of the typical .406 (runner on second and one out), would be raised to:
However, 5% of all unsuccessful attempts resulted in a double play, so the failure value Sv would be calculated as:
instead of .283. Plugging these new values into the break-even formula for an average hitter gives us:
So instead of never being a good idea to sacrifice in this situation, it would in fact make sense if you were successful more than 19 times out of 20. Applying this same procedure to a pitcher you get a break-even percentage of .549, so sacrificing with a pitcher does indeed continue to literally be a “percentage play.”
Overall this procedure has the effect of lowering the break-even percentages and thereby making the sacrifice a more attractive option. I didn’t perform these calculations in the initial article, but had I done so the break-even percentages for the following situations would have been attractive for average hitters:
Base/Out  Break-Even%
12/0       .723
 2/0       .777
Once again, however, this doesn’t factor in the many other variables mentioned previously. But of course that’s one of the beauties of baseball. As much as baseball being a game of discrete events lends itself to analysis, there’s always plenty more that eludes us. For now anyway.