Smoothing the ‘80s and ‘90s (Part 3)
So far, we’ve looked at a couple of sets of players with regard to how their season-by-season stat lines might have looked, had the 1988-92 period and the 1994-2000 period been more consistent in run-production conditions. Now we’re going to get fully into great-player-only territory. I had anticipated that this entry would complete the series, but once into it, I realized that doing justice to the very best players of the era will consume two chapters. So, Part 4 is forthcoming!
Bear in mind that the stat lines that appear in black font are actuals, and the lines that appear in blue are adjusted. For our methodology, see the References and Resources section below.
Legendary Leadoff Men
Biggio has forged the most singular career progression of all time from a defensive spectrum standpoint, and has a fairly unusual offensive profile as well. After all, not too many career leadoff guys are dead-pull right-handed hitters with pretty good home run power, and are so-so hitters for average, with not-especially-good walk/strikeout rates. Of course, the added bonus of Biggio’s many HBPs meaningfully gooses up his OBP, and for much of his career Biggio’s base stealing was a serious asset as well. All in all he was indeed an extremely good top-of-the-order man in his prime, but the Astros have left him in the role far longer than they should have.
Year   Age   AB    R    H   2B   3B   HR  RBI   BB   SO   BA  OBP  SLG  OPS
 1988   22  124   15   27    7    1    4    5    7   31 .217 .260 .380 .639
 1989   23  447   70  118   23    2   17   65   50   68 .264 .345 .436 .782
 1990   24  560   58  158   26    2    5   46   54   83 .283 .348 .364 .713
 1991   25  552   86  167   25    4    5   50   54   75 .302 .366 .390 .756
 1992   26  619  104  176   35    3    8   42   95  100 .284 .386 .388 .774
 1993   27  609   97  174   42    5   23   63   76   96 .285 .373 .484 .857
 1994   28  433   81  135   41    5    5   52   57   54 .312 .402 .470 .871
 1995   29  548  113  162   28    2   20   71   74   79 .296 .400 .464 .864
 1996   30  600  104  169   23    4   14   69   69   67 .282 .381 .401 .782
 1997   31  613  135  185   35    8   20   75   77   99 .302 .409 .484 .893
 1998   32  640  113  204   48    2   18   81   59  105 .319 .396 .485 .881
 1999   33  633  113  182   53    0   15   67   81   99 .288 .378 .440 .818
 2000   34  374   62   98   12    5    7   32   56   68 .262 .381 .381 .763
 2001   35  617  118  180   35    3   20   70   66  100 .292 .360 .455 .816
 2002   36  577   96  146   36    3   15   58   50  111 .253 .313 .404 .716
 2003   37  628  102  166   44    2   15   62   57  116 .264 .326 .412 .738
 2004   38  633  100  178   47    0   24   63   40   94 .281 .324 .469 .793
 2005   39  590   94  156   40    1   26   69   37   90 .264 .308 .468 .776
 2006   40  548   79  135   33    0   21   62   40   84 .246 .298 .422 .719
Career    10345 1742 2916  633   54  281 1104 1097 1619 .282 .366 .435 .801
Henderson’s hitting was, interestingly, similar to Biggio’s at that: also a dead-pull right-handed flyball hitter, and inconsistent in his ability to hit for average. What set Henderson apart, of course, was the uncanny ability to draw walks, as well as the fact that for the great majority of his career Henderson’s speed truly was game-changing. Just a tremendous player, especially when he was able to get the bat going in high gear: check out that 1990 line … wow.
Year   Age   AB    R    H   2B   3B   HR  RBI   BB   SO   BA  OBP  SLG   OPS
 1979   20  351   49   96   13    3    1   26   34   39 .274 .338 .336  .674
 1980   21  591  111  179   22    4    9   53  117   54 .303 .418 .399  .817
 1981   22  423   89  135   18    7    6   35   64   68 .319 .409 .437  .846
 1982   23  536  119  143   24    4   10   51  116   94 .267 .397 .382  .780
 1983   24  513  105  150   25    7    9   48  103   80 .292 .411 .421  .832
 1984   25  502  113  147   27    4   16   58   86   81 .293 .396 .458  .854
 1985   26  547  146  172   28    5   24   72   99   65 .314 .420 .516  .935
 1986   27  608  130  160   31    5   28   74   89   81 .263 .357 .469  .826
 1987   28  358   78  104   17    3   17   37   80   52 .291 .420 .497  .917
 1988   29  560  128  175   33    2    8   54   83   57 .312 .401 .420  .821
 1989   30  546  123  153   28    3   15   62  127   72 .281 .417 .428  .845
 1990   31  495  129  165   36    3   36   66   98   63 .333 .443 .636 1.079
 1991   32  474  114  130   19    1   23   62   99   77 .275 .400 .464  .864
 1992   33  400   84  116   20    3   19   50   96   59 .290 .427 .498  .926
 1993   34  480  113  138   23    2   23   59  118   67 .287 .428 .487  .914
 1994   35  294   61   75   12    0    5   18   66   42 .254 .392 .352  .743
 1995   36  403   62  118   29    1    8   50   66   61 .294 .393 .432  .825
 1996   37  462  101  109   16    2    8   27  115   84 .235 .388 .332  .720
 1997   38  400   78   97   13    0    7   31   89   79 .243 .381 .330  .711
 1998   39  538   93  124   15    1   13   53  108  106 .231 .360 .334  .693
 1999   40  434   82  134   28    0   11   39   75   76 .309 .411 .449  .860
 2000   41  417   69   95   13    2    4   30   81   70 .228 .353 .296  .649
 2001   42  379   70   86   17    3    8   42   81   84 .227 .363 .351  .714
 2002   43  179   40   40    6    1    5   16   38   47 .223 .359 .352  .711
 2003   44   72    7   15    1    0    2    5   11   16 .208 .313 .306  .619
Career    10962 2295 3056  515   66  315 1118 2140 1673 .279 .397 .424  .821
The Supreme Second Hitter
He did bat in the second slot most of the time, but Alomar also batted leadoff quite a bit, as well as hitting third. His offensive skillset was just so amazingly well-rounded that he was an excellent fit in any of those spots.
His image seemed to me to be too strongly tainted by that spitting-in-the-ump’s-face incident, and Alomar kind of hit the wall all of a sudden in his mid-30s instead of enjoying a long and graceful final phase. But few players in history have been so utterly lacking in weakness of any kind; I’d vote him into Cooperstown.
 Year  Age  AB   R    H    2B   3B   HR   RBI  BB   SO   BA   OBP  SLG  OPS
 1988   20  550   91  150   26    6   12   45   48   88 .273 .331 .406 .736
 1989   21  630   89  191   30    1    9   61   54   80 .303 .357 .396 .753
 1990   22  592   87  174   30    5    8   65   49   76 .294 .347 .400 .747
 1991   23  644   96  195   45   11   12   75   58   91 .302 .360 .461 .820
 1992   24  577  114  183   30    8   10   83   88   55 .317 .408 .450 .858
 1993   25  587  108  190   36    6   19   92   79   69 .324 .404 .501 .905
 1994   26  388   72  116   24    4    7   35   47   38 .300 .375 .438 .813
 1995   27  512   66  150   23    7   12   61   43   42 .294 .349 .436 .784
 1996   28  582  122  187   41    4   20   87   83   60 .322 .406 .509 .915
 1997   29  408   59  133   22    2   13   55   37   40 .326 .382 .483 .864
 1998   30  583   79  161   34    1   13   52   54   65 .276 .338 .403 .741
 1999   31  558  127  177   38    3   22  111   91   89 .317 .413 .513 .925
 2000   32  604  102  183   38    2   17   82   59   76 .304 .365 .458 .824
 2001   33  575  113  193   34   12   20  100   80   71 .336 .417 .541 .958
 2002   34  590   73  157   24    4   11   53   57   83 .266 .331 .376 .707
 2003   35  516   76  133   28    2    5   39   59   77 .258 .334 .349 .683
 2004   36  171   18   45    6    2    4   24   14   31 .263 .319 .392 .711
Career     9068 1493 2719  506   82  212 1119  997 1131 .300 .369 .444 .813
Champion Batting Champions
An all-time great top-of-the-order guy, despite his complete lack of speed. One of the interesting things about Boggs is how much his offensive profile—the lefty-swinging, contact-oriented slap hitter with exceptional strike zone discipline—was a throwback approach, something of a lost art. Boggs was better at it than nearly anyone else, of course, but for decades, up through the 1950s, there were a lot of hitters of this same basic type: Richie Ashburn, Billy Goodman, Johnny Pesky, Ferris Fain, Elmer Valo, Augie Galan, Stan Hack, Arky Vaughan, Buddy Myer, Lu Blue, and Johnny Bassler all come to mind. Right-handed-hitting specimens (not as common, likely owing to the BA-inhibiting platoon disadvantage) included Johnny Temple, Luke Appling, and George Burns.
There have continued to be a few of these guys in recent decades; Mike Hargrove, Brett Butler, and Mark Grace all fit this profile to some degree, and in the final phases of both of their careers, Rod Carew and Pete Rose did as well. But we don’t see nearly as many hitters of this type as our grandfathers saw.
It’s interesting to consider why this is, given that the tremendous OBPs these guys generate is a highly potent offensive weapon. Most likely what happened is that the expanded strike zone of 1963-68 suddenly made the work-the-count technique far more difficult to make successful for a hitter without serious power, and coaches and organizations stopped teaching it and looking for it in prospects. When the strike zone was made smaller again, the cultural DNA that had produced these hitters had been significantly altered. And of course in today’s game with its extreme bias toward power, almost nobody except little guys with great speed are taught to slap the ball the other way.
Year   Age   AB    R    H   2B   3B   HR  RBI   BB   SO   BA  OBP  SLG   OPS
 1982   24  338   51  118   14    1    5   44   35   21 .349 .410 .441  .851
 1983   25  582  100  210   44    7    5   74   92   36 .361 .448 .486  .934
 1984   26  625  109  203   31    4    6   55   89   44 .325 .409 .416  .825
 1985   27  653  107  240   42    3    8   78   96   61 .368 .449 .478  .926
 1986   28  580  107  207   47    2    8   71  105   44 .357 .455 .486  .942
 1987   29  551  108  200   40    6   24   89  105   48 .363 .465 .588 1.053
 1988   30  592  139  222   49    6    6   63  126   36 .375 .485 .511  .995
 1989   31  628  123  212   56    7    4   59  108   54 .338 .435 .468  .903
 1990   32  626   97  194   48    5    8   69   88   72 .309 .395 .440  .834
 1991   33  552  101  187   46    2   10   55   90   34 .339 .432 .485  .917
 1992   34  519   67  138   24    4    9   54   75   33 .265 .358 .379  .737
 1993   35  559   82  168   27    1    2   59   73   50 .300 .381 .363  .744
 1994   36  362   56  121   18    1   10   51   56   27 .335 .424 .473  .897
 1995   37  456   70  145   21    4    5   58   68   46 .317 .406 .411  .817
 1996   38  496   74  151   27    2    2   38   62   30 .305 .382 .380  .761
 1997   39  350   51  100   22    1    4   26   44   35 .286 .366 .385  .750
 1998   40  431   47  118   22    4    6   48   42   50 .275 .339 .388  .728
 1999   41  289   37   85   13    1    2   27   35   21 .295 .371 .367  .738
Career     9189 1527 3019  591   62  123 1017 1389  742 .329 .417 .447  .863

Like Boggs, better than just about anybody else at doing what he did, but Gwynn’s style is more typical among high-average hitters: forget working the count, just whack the first or second pitch for a line drive. And he made it look so easy.
Year   Age   AB    R    H   2B   3B   HR  RBI   BB   SO   BA  OBP  SLG  OPS
 1982   22  190   33   55   12    2    1   17   14   16 .289 .338 .389 .728
 1983   23  304   34   94   12    2    1   37   23   21 .309 .358 .372 .730
 1984   24  606   88  213   21   10    5   71   59   23 .351 .409 .444 .853
 1985   25  622   90  197   29    5    6   46   45   33 .317 .363 .408 .771
 1986   26  642  107  211   33    7   14   59   52   35 .329 .379 .467 .846
 1987   27  589  119  218   36   13    7   54   82   35 .370 .447 .511 .958
 1988   28  527   70  169   24    5    9   76   52   42 .320 .381 .436 .817
 1989   29  611   89  210   30    7    5   67   57   32 .344 .400 .441 .840
 1990   30  579   86  183   32   10    5   78   44   24 .316 .365 .433 .798
 1991   31  536   75  174   30   11    5   67   34   20 .325 .365 .450 .815
 1992   32  526   84  171   30    3    8   45   47   17 .325 .380 .437 .816
 1993   33  488   69  174   42    3    8   59   35   20 .356 .399 .502 .901
 1994   34  414   73  160   33    1   11   59   44   18 .387 .446 .550 .996
 1995   35  529   76  191   31    1    8   83   32   14 .361 .398 .470 .868
 1996   36  446   62  154   25    2    3   46   36   16 .346 .394 .431 .825
 1997   37  586   90  214   46    2   15  110   40   26 .365 .405 .530 .935
 1998   38  457   60  144   33    0   15   64   32   17 .315 .360 .482 .842
 1999   39  407   54  135   25    0    9   57   27   13 .332 .373 .461 .834
 2000   40  126   16   40   11    0    1   16    8    4 .316 .359 .428 .787
 2001   41  102    5   33    9    1    1   17   10    9 .324 .384 .461 .845
Career     9286 1379 3139  544   86  136 1128  773  433 .338 .389 .459 .848
Rough Tough Right-handers
Brown always reminded me a whole lot of Mike Scott. Both pitchers kind of scuffled through their 20s (Scott struggling more than Brown) before suddenly developing a lights-out hard sinker and being damn near unhittable for a while. Of course, Scott’s super-sinker was widely suspected to be a spitball, and maybe I missed it but I don’t recall hearing that much innuendo about Brown’s.
A high-velocity sinker is just about the perfect pitch, inducing strikeouts without the home run tendency of the high fastball. Hitters everywhere are eternally grateful that precious few pitchers are able to master such a nasty weapon. It’s precisely that element of his repertoire that makes young King Felix so ominously exciting.
 Year  Age    G   IP    W    L    H   HR   BB   SO  ERA
 1986   21    1    5    1    0    6    0    0    4 3.60
 1987   22
 1988   23    4   23    1    1   34    3    8   13 4.48
 1989   24   28  191   12    9  173   13   71  110 3.54
 1990   25   26  180   12   10  181   17   61   93 3.80
 1991   26   33  211    9   12  241   22   91  101 4.65
 1992   27   35  266   21   11  271   14   77  183 3.51
 1993   28   34  233   15   12  226   15   73  146 3.69
 1994   29   26  170    7    9  212   16   46  114 4.47
 1995   30   26  172   10    9  150    9   44  109 3.34
 1996   31   32  233   17   11  182    7   30  148 1.75
 1997   32   33  237   16    8  208    9   61  190 2.50
 1998   33   36  257   18    7  218    7   45  239 2.21
 1999   34   35  252   18    9  204   17   54  205 2.78
 2000   35   33  230   13    6  176   19   43  200 2.39
 2001   36   20  116   10    4   94    8   38  104 2.65
 2002   37   17   64    3    4   68    9   23   58 4.81
 2003   38   32  211   14    9  184   11   56  185 2.39
 2004   39   22  132   10    6  132   14   35   83 4.09
 2005   40   13   73    4    7  107    5   19   50 6.50
 Career     486 3256  211  144 3067  215  875 2334 3.24
The career Schilling’s has mimicked is that of Dazzy Vance: a big, strong, high-heater right-hander who struggled to stay healthy in his 20s, but finally managed to keep it together and became a major star in his 30s, with his signature strength being a mind-boggling strikeout-to-walk ratio.
 Year  Age    G   IP    W    L    H    HR   BB   SO  ERA
 1988   21    4   15    0    3   23    4   10    4 10.37
 1989   22    5    9    0    1   10    3    3    6  6.58
 1990   23   35   46    1    2   39    1   19   34  2.68
 1991   24   56   76    3    5   82    3   39   75  4.02
 1992   25   42  226   14   11  171   14   60  155  2.48
 1993   26   34  235   16    7  232   25   56  191  4.13
 1994   27   13   82    2    8   84    9   26   54  4.16
 1995   28   17  116    7    5   93   11   24  106  3.31
 1996   29   26  183    9   10  145   15   46  169  2.96
 1997   30   35  254   17   11  202   23   53  296  2.76
 1998   31   35  269   15   14  229   21   56  278  3.02
 1999   32   24  180   15    6  154   23   40  141  3.29
 2000   33   29  210   11   12  198   24   41  156  3.54
 2001   34   35  257   22    6  237   37   39  293  2.98
 2002   35   36  259   23    7  218   29   33  316  3.23
 2003   36   24  168    8    9  144   17   32  194  2.95
 2004   37   32  227   21    6  206   23   35  203  3.26
 2005   38   32   93    8    8  121   12   22   87  5.69
 2006   39   31  204   15    7  220   28   28  183  3.97
 Career     545 3110  207  138 2809  321  663 2942  3.37
Masters of the Middle Infield
His power production was crazily inconsistent, though this exercise demonstrates that Larkin’s great 1996 performance was really pretty much a replication of his 1991. He was prone to injury, but when in the lineup, there were a lot of ways this guy could beat you.
Year   Age   AB    R    H   2B   3B   HR  RBI   BB   SO   BA  OBP  SLG  OPS
 1986   22  159   27   45    4    3    3   19    9   21 .283 .321 .403 .724
 1987   23  439   64  107   16    2   12   43   36   52 .244 .301 .371 .672
 1988   24  594   99  180   35    5   15   61   41   25 .303 .349 .457 .805
 1989   25  329   51  115   15    4    5   39   20   24 .349 .387 .467 .854
 1990   26  621   92  192   27    6    9   73   50   52 .309 .360 .416 .775
 1991   27  469   96  145   30    4   26   75   56   68 .309 .382 .553 .936
 1992   28  539   83  168   35    6   15   85   64   61 .311 .384 .485 .869
 1993   29  383   57  120   20    3    9   51   50   34 .313 .393 .451 .844
 1994   30  424   72  116   22    5    8   48   59   54 .273 .361 .407 .768
 1995   31  491   90  153   27    6   14   61   56   45 .312 .383 .476 .859
 1996   32  512  108  149   30    4   30   82   88   48 .292 .396 .542 .938
 1997   33  222   31   69   16    3    4   18   43   22 .311 .423 .460 .883
 1998   34  533   86  161   32   11   15   66   73   64 .302 .386 .489 .874
 1999   35  578  100  166   28    4   11   69   85   53 .287 .379 .407 .786
 2000   36  392   66  120   25    5   10   38   44   29 .307 .377 .472 .849
 2001   37  156   29   40   12    0    2   17   27   25 .256 .366 .372 .738
 2002   38  507   72  124   37    2    7   47   44   57 .245 .305 .367 .672
 2003   39  241   39   68   16    1    2   18   22   32 .282 .342 .382 .724
 2004   40  346   55  100   15    3    8   44   34   39 .289 .353 .419 .772
Career     7935 1316 2338  443   78  205  954  901  806 .295 .367 .448 .814
Few players present a more startling image through this exercise, as Sandberg’s real peak years coincided exactly with the 1988-92 period. He was one helluva player, wasn’t he. Those 51 homers would be far and away the all-time single-season most by a second baseman.
Year   Age   AB    R    H   2B   3B   HR  RBI   BB   SO   BA  OBP  SLG  OPS
 1981   21    6    2    1    0    0    0    0    0    1 .167 .167 .167 .333
 1982   22  635  103  172   33    5    7   54   36   90 .271 .310 .372 .682
 1983   23  633   94  165   25    4    8   48   51   79 .261 .316 .351 .667
 1984   24  636  114  200   36   19   19   84   52  101 .314 .366 .520 .887
 1985   25  609  113  186   31    6   26   83   57   97 .305 .365 .504 .869
 1986   26  627   68  178   28    5   14   76   46   79 .284 .333 .411 .744
 1987   27  523   81  154   25    2   16   59   59   79 .294 .366 .442 .808
 1988   28  624   84  169   25    8   24   75   55   96 .271 .329 .454 .783
 1989   29  612  113  182   27    5   38   83   60   90 .298 .360 .547 .907
 1990   30  622  126  195   33    3   51  109   51   89 .313 .365 .623 .988
 1991   31  591  113  176   35    2   33  109   88   94 .298 .389 .533 .922
 1992   32  619  109  193   35    8   33   95   69   77 .311 .380 .556 .936
 1993   33  455   66  140   20    0   10   45   36   64 .307 .359 .418 .776
 1994   34  221   33   51    8    5    5   22   21   37 .232 .299 .380 .679
 1995   35
 1996   36  550   78  131   26    4   23   85   50  108 .238 .301 .425 .726
 1997   37  444   50  115   25    0   11   59   26   87 .258 .299 .387 .686
Career     8406 1348 2407  413   77  319 1085  755 1268 .286 .345 .467 .813
One of the oddest juxtapositions in history is Ripken’s other-wordly durability right next to his glaring inconsistency with the bat; the two attributes just don’t seem to fit together, but there they are. Did he have a year in 1991, or what?
Year   Age   AB    R    H   2B   3B   HR  RBI   BB   SO   BA  OBP  SLG   OPS
 1981   20   39    1    5    0    0    0    0    1    8 .128 .150 .128  .278
 1982   21  598   90  158   32    5   28   93   46   95 .264 .317 .475  .792
 1983   22  663  121  211   47    2   27  102   58   97 .318 .373 .517  .890
 1984   23  641  103  195   37    7   27   86   71   89 .304 .374 .510  .884
 1985   24  642  116  181   32    5   26  110   67   68 .282 .350 .469  .819
 1986   25  627   98  177   35    1   25   81   70   60 .282 .354 .461  .815
 1987   26  624   97  157   28    3   27   98   81   77 .252 .338 .436  .773
 1988   27  580   95  157   27    1   29   88  103   73 .271 .381 .474  .855
 1989   28  652   87  172   33    0   27  101   58   76 .264 .323 .438  .761
 1990   29  605   85  155   31    4   27   91   83   70 .257 .346 .454  .800
 1991   30  657  108  217   50    5   44  124   54   49 .331 .381 .621 1.003
 1992   31  643   79  166   32    1   18   78   65   53 .258 .326 .394  .720
 1993   32  640   86  164   27    3   26   89   64   60 .256 .323 .430  .754
 1994   33  440   66  136   18    3   12   69   29   38 .309 .352 .444  .797
 1995   34  546   66  140   31    2   15   81   48   55 .256 .316 .406  .722
 1996   35  635   87  173   38    1   24   94   54   72 .272 .329 .446  .776
 1997   36  610   73  161   28    0   15   78   51   68 .264 .321 .386  .708
 1998   37  596   60  158   25    1   13   56   47   63 .265 .319 .375  .694
 1999   38  329   47  110   25    0   16   53   12   29 .334 .357 .560  .917
 2000   39  307   40   77   15    0   14   52   21   34 .250 .298 .432  .731
 2001   40  477   43  114   16    0   14   68   26   63 .239 .278 .361  .639
Career    11550 1646 3183  608   45  454 1693 1109 1296 .276 .339 .454  .793
Bodacious Backstops
Yes, he’s demonstrated lousy strike zone discipline, but that’s the only chink in Pudge’s armor: a remarkably productive hitter for average, with very nice power; overall an excellent run producer.
And that run production has come from a highly durable catcher. And his defense? Well … this has always been my favorite Pudge factoid … in 1999, the 29 major league teams other than the Texas Rangers surrendered an average of 116 stolen bases in their 162 games, or .72 per game, and threw out base stealers at a 30.3% rate. Meanwhile, Rodriguez allowed—get this—just 34 stolen bases in the 141 games he was behind the plate, or .24 per game, and threw them out at a 54.7% rate.
For good measure, he picked off an additional 10 baserunners.
Oh, and Pudge himself stole 25 bases.
 Year  Age   AB    R    H   2B   3B   HR  RBI   BB   SO   BA  OBP  SLG   OPS
 1991   19  283   26   77   18    0    4   29    5   44 .271 .284 .374  .658
 1992   20  424   42  113   18    1   10   40   24   77 .266 .306 .385  .691
 1993   21  472   56  128   29    4   11   65   28   72 .271 .313 .418  .731
 1994   22  360   52  105   18    1   15   53   28   39 .291 .343 .468  .811
 1995   23  488   52  145   30    2   11   62   15   45 .297 .317 .434  .751
 1996   24  633  107  186   44    3   17   79   35   51 .294 .331 .456  .787
 1997   25  592   90  182   32    4   18   71   35   83 .307 .346 .467  .813
 1998   26  574   81  181   38    4   19   84   29   82 .315 .348 .495  .843
 1999   27  594  107  193   27    1   32  104   22   59 .325 .349 .535  .884
 2000   28  359   61  122   25    4   24   77   17   45 .340 .371 .639 1.010
 2001   29  442   70  136   24    2   25   65   23   73 .308 .342 .541  .883
 2002   30  408   67  128   32    2   19   60   25   71 .314 .353 .542  .895
 2003   31  511   90  152   36    3   16   85   55   92 .297 .366 .474  .839
 2004   32  527   72  176   32    2   19   86   41   91 .334 .382 .510  .892
 2005   33  504   71  139   33    5   14   50   11   93 .276 .291 .444  .736
 2006   34  547   74  164   28    4   13   69   26   86 .300 .332 .437  .769
Career     7717 1118 2326  464   43  267 1080  421 1102 .301 .338 .476  .814
Piazza, on the other hand, has always been a pretty weak thrower, but with a bat like his such a problem can be tolerated. In his prime he was, as he’s often described, simply the best-hitting catcher in major league history, and he’s putting together a nicely productive twilight phase as well.
 Year  Age   AB    R    H   2B   3B   HR  RBI   BB   SO   BA  OBP  SLG   OPS
 1992   23   70    5   17    3    0    1    8    4   13 .238 .280 .341  .621
 1993   24  546   80  173   25    2   38  111   45   88 .316 .369 .580  .948
 1994   25  401   59  125   17    0   22   85   30   60 .312 .360 .517  .878
 1995   26  430   76  146   16    0   29   86   36   74 .339 .390 .579  .969
 1996   27  542   80  179   15    0   33   97   74   86 .330 .411 .538  .949
 1997   28  550   96  195   30    1   36  114   63   71 .355 .421 .611 1.032
 1998   29  556   81  179   36    1   29  102   53   74 .321 .381 .546  .927
 1999   30  529   92  157   24    0   36  114   47   65 .297 .354 .547  .901
 2000   31  477   83  151   25    0   34  104   53   64 .317 .386 .585  .971
 2001   32  503   81  151   29    0   36   94   67   87 .300 .382 .573  .955
 2002   33  478   69  134   23    2   33   98   57   82 .280 .357 .544  .901
 2003   34  234   37   67   13    0   11   34   35   40 .286 .379 .483  .862
 2004   35  455   47  121   21    0   20   54   68   78 .266 .361 .444  .805
 2005   36  398   41  100   23    0   19   62   41   67 .251 .321 .452  .773
 2006   37  399   39  113   19    1   22   68   34   66 .283 .339 .501  .841
Career     6567  967 2007  318    7  400 1232  709 1017 .306 .373 .539  .912
Cleanup Corner Outfielders
Surly personality considerations aside, based strictly upon on-field performance: if his career hadn’t come to its sudden and premature end, would Belle be on his way to the Hall of Fame?
Extraordinarily productive though he was, I’m inclined to think not. This exercise illustrates the degree to which his peak-performance numbers were enhanced by the high-scoring conditions, and for all his RBIs, Belle led his league in OPS and OPS+ just once. I think he properly belongs where he will remain, in the Hall of Very Good.
Year   Age   AB    R    H   2B   3B   HR  RBI   BB   SO   BA  OBP  SLG   OPS
 1989   22  220   24   51    9    4    9   40   12   58 .231 .271 .430  .701
 1990   23   23    1    4    0    0    1    3    1    6 .179 .213 .345  .558
 1991   24  466   65  135   34    2   36  103   25  105 .289 .326 .602  .927
 1992   25  590   88  157   25    1   44  122   53  135 .267 .327 .534  .860
 1993   26  593   92  171   37    3   42  128   75   99 .288 .367 .571  .939
 1994   27  408   83  143   33    2   33   93   53   66 .350 .425 .681 1.107
 1995   28  541  112  168   49    1   45  116   67   74 .310 .387 .656 1.043
 1996   29  597  114  182   36    3   44  137   91   81 .304 .396 .594  .990
 1997   30  629   83  169   42    1   27  107   49   97 .269 .321 .469  .790
 1998   31  603  104  194   45    2   44  140   74   78 .322 .396 .625 1.021
 1999   32  605  100  176   34    1   34  108   93   76 .291 .385 .517  .902
 2000   33  554   66  152   35    1   21   95   48   63 .275 .332 .454  .787
Career     5828  932 1701  379   22  379 1193  641  939 .292 .362 .559  .921
What’s most remarkable to me about Manny isn’t his immense power, but instead how he’s able to relentlessly hit for a very high average while striking out as often as he does. Precious few have managed to sustain that combination. What it requires, of course, is hitting the ball extremely hard when you do put it in play. It’s Mickey Mantle/Dick Allen territory, a place reachable by only the strongest and quickest of bats.
 Year  Age   AB    R    H   2B   3B   HR  RBI   BB   SO   BA  OBP  SLG   OPS
 1993   21   53    5    9    1    0    2    5    2    8 .169 .198 .312  .511
 1994   22  288   47   76   21    0   15   55   39   67 .263 .350 .496  .846
 1995   23  480   78  145   25    1   28   99   69  104 .302 .389 .533  .922
 1996   24  545   87  165   42    3   30  103   78   97 .303 .390 .557  .947
 1997   25  556   91  179   38    0   24   81   73  107 .321 .400 .517  .917
 1998   26  566  100  163   33    2   41  134   70  112 .288 .366 .570  .936
 1999   27  517  121  169   32    3   40  152   88  122 .327 .425 .632 1.057
 2000   28  434   85  149   32    2   34  113   79  109 .344 .445 .665 1.110
 2001   29  529   93  162   33    2   41  125   81  147 .306 .398 .609 1.007
 2002   30  436   84  152   31    0   33  107   73   85 .349 .442 .647 1.089
 2003   31  569  117  185   36    1   37  104   97   94 .325 .423 .587 1.010
 2004   32  568  108  175   44    0   43  130   82  124 .308 .395 .613 1.008
 2005   33  554  112  162   30    1   45  144   80  119 .292 .382 .594  .976
 2006   34  449   79  144   27    1   35  102  100  102 .321 .444 .619 1.064
Career     6543 1207 2034  425   17  448 1454 1010 1396 .311 .403 .586  .989
And then we have this guy, who generates terrific power by swinging so hard that it seems certain his arms are about to tear loose from his shoulder sockets and go helicoptering down the left field line, the bat still tightly clenched in their hands, blood spraying everywhere—and yet he’s never struck out much at all. An amazing player, with one of the very most entertaining at-bats.
Year   Age   AB    R    H   2B   3B   HR  RBI   BB   SO   BA  OBP  SLG   OPS
 1988   19   81   13   20    1    0    5   13    7    7 .244 .305 .448  .753
 1989   20  371   37   94   20    0    6   35   27   35 .254 .305 .359  .664
 1990   21  492   73  148   33    1   13   73   44   43 .301 .359 .450  .809
 1991   22  176   27   35   13    2    3   24   19   16 .200 .278 .341  .619
 1992   23  564   95  191   37    3   42  109   49   42 .338 .391 .640 1.030
 1993   24  493   66  144   20    5   22   72   46   66 .292 .352 .487  .840
 1994   25  319   56   86   15    1   24   72   47   46 .270 .364 .554  .918
 1995   26  211   42   67    8    0   15   42   51   42 .317 .449 .559 1.009
 1996   27  514  109  158   31    1   38  111  131   61 .308 .448 .594 1.042
 1997   28  441   79  108   21    1   19   66  111   73 .244 .397 .426  .823
 1998   29  433   67  128   25    2   20   78   87   43 .296 .414 .502  .916
 1999   30  544   95  160   19    0   31   93   93   59 .294 .397 .499  .896
 2000   31  496   97  158   23    3   39  101   93   66 .319 .426 .613 1.039
 2001   32  515   98  160   28    2   36  100   94   67 .311 .417 .583 1.000
 2002   33  492   82  151   26    0   25   84   72   53 .307 .395 .512  .908
 2003   34  576  126  190   37    2   39  132   86   55 .330 .417 .604 1.021
 2004   35  573  117  166   30    1   36  121   92   83 .290 .388 .534  .922
 2005   36  584  104  170   27    0   34  123   78   76 .291 .375 .512  .887
 2006   37  151   22   45    5    0    6   25   13   16 .298 .354 .450  .804
Career     8026 1406 2379  419   25  453 1474 1240  950 .296 .391 .524  .915
A Thumping Third Baseman
Hitters don’t come a whole lot more well-rounded and consistently productive than this one. But for the past three years he’s been dogged by chronic injuries; the extent to which he pulls through this, or breaks down, may very well determine whether Chipper gets a plaque.
 Year  Age   AB    R    H   2B   3B   HR  RBI   BB   SO   BA  OBP  SLG   OPS
 1993   21    3    2    2    1    0    0    0    1    1 .665 .7481.008 1.756
 1994   22
 1995   23  520   80  135   21    3   21   79   67   92 .260 .344 .432  .776
 1996   24  593  105  180   30    5   27  101   80   82 .303 .386 .509  .895
 1997   25  592   92  171   39    3   19  102   70   82 .289 .364 .461  .825
 1998   26  595  113  182   27    5   31   99   88   86 .306 .396 .525  .921
 1999   27  562  107  176   39    1   41  101  116   87 .313 .430 .603 1.033
 2000   28  574  109  175   36    1   33  102   87   59 .305 .396 .541  .938
 2001   29  572  113  189   33    5   38  102   98   82 .330 .428 .605 1.033
 2002   30  548   90  179   35    1   26  100  107   89 .327 .437 .536  .973
 2003   31  555  103  169   33    2   27  106   94   83 .305 .405 .517  .922
 2004   32  472   69  117   20    1   30   96   84   96 .248 .362 .485  .847
 2005   33  358   66  106   30    0   21   72   72   56 .296 .414 .556  .970
 2006   34  411   87  133   28    3   26   86   61   73 .324 .411 .596 1.007
Career     6354 1137 1913  371   31  339 1148 1025  968 .301 .398 .529  .928
Aces of Atlanta
Sort of a laboratory test of the differing challenge, and of the differing value contribution, between a top starter and a closer.
To be fair, Smoltz was moved to the bullpen not because the Braves believed he would deliver more value there, but because of their (quite understandable) concerns about his fragile health. Closing (not surprisingly) then proved to be a less than rigorous challenge for the exceptionally talented Smoltz. Having since demonstrated that he’s still up to the more demanding role of starting, in retrospect it appears the Braves were too cautious, too slow in returning Smoltz to the rotation; it’s worth pondering just how much value they squandered in devoting three full seasons to having, if you will, a man doing a boy’s job.
 Year  Age   G    IP    W    L    H   HR   BB   SO  ERA
 1988   21   12   64    2    7   77   13   33   39 5.79
 1989   22   29  208   12   11  166   19   73  177 3.11
 1990   23   34  231   14   11  213   26   91  180 4.07
 1991   24   36  230   14   13  213   20   78  156 4.01
 1992   25   35  247   15   12  213   22   81  227 3.01
 1993   26   35  244   15   11  206   25   98  214 3.72
 1994   27   21  135    6   10  116   14   44  105 3.84
 1995   28   29  193   12    7  161   14   66  179 2.95
 1996   29   35  254   24    8  193   17   51  256 2.73
 1997   30   35  256   15   12  227   19   58  224 2.80
 1998   31   26  168   17    3  141    9   40  161 2.69
 1999   32   29  186   11    8  163   13   37  145 2.96
 2000   33
 2001   34   36   59    3    3   53    7   10   57 3.36
 2002   35   75   80    3    2   59    4   24   85 3.25
 2003   36   62   64    0    2   48    2    8   73 1.12
 2004   37   73   82    0    1   75    8   13   85 2.76
 2005   38   33  230   14    7  210   18   53  169 3.06
 2006   39   35  232   16    9  221   23   55  211 3.49
 Career     670 3162  193  137 2756  272  913 2743 3.26
Pretty much the Warren Spahn of our era, I guess. He’s never been the most talented pitcher in the league, but they don’t come any smarter or tougher, and he’s demonstrated uncanny ability to find a way to win for a very long time.
 Year  Age   G    IP    W    L    H   HR   BB   SO  ERA
 1987   21    9   50    2    4   55    5   33   20 5.54
 1988   22   34  195    7   17  208   15   64   89 4.82
 1989   23   29  186   14    8  178   26   40   95 3.89
 1990   24   33  214   10   12  240   23   79  136 4.52
 1991   25   34  247   20   11  208   22   70  203 2.69
 1992   26   33  225   20    8  204    8   71  136 2.92
 1993   27   36  239   22    6  234   18   88  123 3.29
 1994   28   25  165   13    9  168    9   64  130 3.68
 1995   29   29  199   16    7  177    8   61  118 2.86
 1996   30   36  235   15   10  216   13   78  168 2.77
 1997   31   33  240   14    7  191   18   73  141 2.75
 1998   32   33  229   20    6  196   12   68  146 2.29
 1999   33   35  234   14   11  251   16   76  128 3.82
 2000   34   35  241   21    9  216   22   60  141 3.16
 2001   35   35  219   16    7  213   24   97  116 3.57
 2002   36   36  225   18   11  210   21   78  127 2.96
 2003   37   32  183    9   14  205   21   66   82 4.52
 2004   38   33  212   11   14  204   20   70  109 3.60
 2005   39   33  211   13   13  227   12   61  105 3.53
 2006   40   32  198   15    7  202   22   62  131 3.82
 Career     635 4149  290  191 4003  334 1359 2444 3.43
First Among First Basemen
Giambi has always seemed to me to be the Norm Cash of our era. The differences between their raw stats are more a function of conditions than skillsets. Both are rather pudgy lefty-batting first basemen with a lot of power, but not elite power; both have excellent strike zone judgment, which in combination with a good ability to hit for average make them consistently at or close to the league lead in on-base percentage. Giambi is a little bit better, but not a lot: Giambi’s career OPS+ is 150 through 6,900 plate appearances, with Cash at 139 in 7,900 plate appearances.
 Year  Age   AB    R    H   2B   3B   HR  RBI   BB   SO   BA  OBP  SLG   OPS
 1995   24  175   25   44    7    0    5   23   26   29 .250 .346 .381  .728
 1996   25  531   78  151   38    1   18   73   47   88 .285 .343 .462  .805
 1997   26  515   61  148   39    2   18   75   51   83 .287 .351 .476  .826
 1998   27  557   85  161   26    0   24  101   74   95 .289 .373 .468  .841
 1999   28  570  106  176   34    1   30  113   97   98 .308 .409 .529  .938
 2000   29  505  100  165   27    1   39  126  126   89 .327 .461 .617 1.078
 2001   30  520  109  178   47    2   38  120  129   83 .342 .473 .660 1.133
 2002   31  560  120  176   34    1   41  122  109  112 .314 .426 .598 1.024
 2003   32  535   97  134   25    0   41  107  129  140 .250 .396 .527  .923
 2004   33  264   33   55    9    0   12   40   47   62 .208 .328 .379  .707
 2005   34  417   74  113   14    0   32   87  108  109 .271 .421 .535  .956
 2006   35  446   92  113   25    0   37  113  110  106 .253 .401 .558  .959
Career     5595  979 1614  325    8  336 1101 1052 1094 .288 .401 .530  .931
We see here that the late-blooming character of everybody’s favorite Viagra-taker’s career was, to some degree, an illusion fostered by the dramatic change in conditions over the 1990s. But only to some degree; it was unusual just how Palmeiro, once he attained his power-production ability in his mid-to-late twenties, just kind of held it there forever. Whatever we wish to make of it, he was one of the most durable and consistent players of all time.
 Year  Age   AB    R    H   2B   3B   HR  RBI   BB   SO   BA  OBP  SLG   OPS
 1986   21   73    9   18    4    0    3   12    4    6 .247 .286 .425  .710
 1987   22  221   32   61   15    1   14   30   20   26 .276 .336 .543  .879
 1988   23  586   82  184   45    5   10   58   38   36 .314 .357 .461  .817
 1989   24  564   83  159   25    4   10   70   64   51 .282 .355 .396  .751
 1990   25  605   78  198   38    6   18   97   40   62 .327 .369 .499  .869
 1991   26  638  125  210   54    3   33   96   69   76 .329 .395 .579  .974
 1992   27  614   91  169   30    4   28   92   73   88 .275 .352 .474  .826
 1993   28  596  123  175   41    2   41  104   72   87 .293 .369 .573  .942
 1994   29  432   76  135   30    0   21   70   50   58 .312 .383 .527  .910
 1995   30  549   82  167   28    2   35   96   57   60 .304 .370 .557  .926
 1996   31  621  101  176   38    2   35  131   87   89 .283 .372 .521  .893
 1997   32  609   88  151   23    2   34  101   62  101 .248 .317 .462  .780
 1998   33  614   90  178   34    1   39  112   73   84 .289 .365 .539  .903
 1999   34  560   89  178   28    1   43  137   89   64 .317 .411 .600 1.011
 2000   35  560   94  158   27    3   35  111   95   71 .282 .386 .532  .918
 2001   36  600   98  164   33    0   47  123  101   90 .273 .378 .563  .941
 2002   37  546   99  149   34    0   43  105  104   94 .273 .389 .571  .961
 2003   38  561   92  146   21    2   38  112   84   77 .260 .357 .508  .865
 2004   39  550   68  142   29    0   23   88   86   61 .258 .358 .436  .795
 2005   40  369   47   98   13    0   18   60   43   43 .266 .342 .447  .789
Career    10468 1647 3016  590   39  569 1804 1310 1326 .288 .367 .515  .882
This dramatically illustrates the manner in which the general perception of McGriff’s power as “A-” was largely a function of his mistiming his peak to take place in the late ’80s/early ’90s. In his 30s, McGriff was indeed nothing more than a good player, but in his 20s, he was flat-out great. Here we see him surpassing the 500-homer mark with ease.
 Year  Age   AB    R    H   2B   3B   HR  RBI   BB   SO   BA  OBP  SLG   OPS
 1986   22    5    1    1    0    0    0    0    0    2 .200 .200 .200  .400
 1987   23  295   58   73   16    0   20   43   60  104 .247 .375 .505  .880
 1988   24  541  109  156   38    4   44   89   80  157 .289 .380 .616  .996
 1989   25  556  107  153   30    3   46  100  120  139 .275 .404 .588  .993
 1990   26  563   99  173   23    1   45   96   95  114 .307 .407 .591  .998
 1991   27  533   91  152   21    1   40  115  106  143 .285 .404 .552  .956
 1992   28  536   86  157   33    4   45  113   97  114 .293 .402 .620 1.022
 1993   29  556  110  161   30    2   41  100   75  109 .289 .373 .569  .942
 1994   30  420   75  131   24    1   31   87   46   71 .312 .380 .593  .973
 1995   31  524   78  144   25    1   24   86   60   92 .274 .349 .467  .816
 1996   32  612   75  177   35    1   25   99   63  108 .289 .355 .474  .829
 1997   33  559   71  151   24    1   20   90   63  104 .271 .344 .424  .768
 1998   34  559   67  155   31    0   17   75   73  110 .278 .361 .426  .786
 1999   35  524   69  159   28    1   29   96   79   99 .304 .395 .528  .923
 2000   36  561   76  152   17    0   24   98   84  111 .271 .366 .432  .798
 2001   37  513   67  157   25    2   31  102   66  106 .306 .385 .544  .929
 2002   38  523   67  143   27    2   30  103   63   99 .273 .352 .505  .856
 2003   39  297   32   74   14    0   13   40   31   66 .249 .320 .428  .748
 2004   40   72    7   13    3    0    2    7    9   19 .181 .272 .306  .577
Career     8750 1345 2483  443   24  527 1538 1268 1867 .284 .374 .521  .895
With a rather slow-to-develop career arc, Thome has been McGriff’s opposite: peaking in his thirties, and being dogged throughout his career with various aches and pains, while McGriff was extraordinarily durable.
Year   Age   AB    R    H   2B   3B   HR  RBI   BB   SO   BA  OBP  SLG   OPS
 1991   20   99    8   26    4    2    1   10    5   17 .262 .298 .386  .684
 1992   21  118    9   25    3    1    3   13   10   36 .211 .273 .321  .594
 1993   22  154   28   41   11    0    8   22   28   37 .265 .380 .488  .867
 1994   23  318   54   83   19    1   18   48   42   78 .262 .349 .499  .847
 1995   24  448   85  138   27    3   23   67   89  105 .308 .423 .535  .957
 1996   25  500  113  152   26    5   34  107  113  131 .305 .433 .585 1.018
 1997   26  492   96  138   24    0   36   94  110  136 .280 .412 .549  .961
 1998   27  436   82  125   32    2   27   78   82  131 .287 .400 .557  .957
 1999   28  490   93  133   25    2   30  100  117  159 .271 .412 .515  .927
 2000   29  553   98  146   31    1   34   98  108  159 .263 .384 .506  .890
 2001   30  526  101  153   26    1   49  124  111  185 .291 .414 .624 1.038
 2002   31  480  101  146   19    2   52  118  122  139 .304 .445 .677 1.122
 2003   32  578  111  154   30    3   47  131  111  182 .266 .385 .573  .957
 2004   33  508   97  139   28    1   42  105  104  144 .274 .397 .581  .978
 2005   34  193   26   40    7    0    7   30   45   59 .207 .357 .352  .709
 2006   35  490  108  141   26    0   42  109  107  147 .288 .415 .598 1.013
Career     6383 1208 1780  340   25  453 1254 1306 1843 .279 .401 .553  .954
The combination of the bizarre squatting crouch and the ferocity of swing that closely rivalled Sheffield’s—along with, of course, the rip-roaring results—made every Bagwell at-bat a great show. He was, moreover, a well-rounded player; a fine defensive first baseman, and despite average-at-best speed, an outstanding baserunner. An often overlooked fact is that Bagwell stole 202 bases at a 72% success rate.
There will, obviously, be a glut of first basemen from this era on Hall of Fame ballots a few years hence, and it’s going to be very interesting to see just how the voters sort it out.
 Year  Age   AB    R    H   2B   3B   HR  RBI   BB   SO   BA  OBP  SLG   OPS
 1991   23  560   86  169   28    4   19   89   76  123 .301 .385 .470  .855
 1992   24  592   95  166   37    6   23  104   85  102 .280 .370 .480  .851
 1993   25  534   75  170   38    4   22   87   61   75 .318 .388 .527  .915
 1994   26  396   96  143   30    2   35  107   60   60 .361 .445 .716 1.160
 1995   27  444   81  126   27    0   19   80   73   95 .284 .385 .474  .859
 1996   28  563  102  174   45    2   28  111  124  106 .309 .434 .546  .980
 1997   29  561  101  157   38    2   39  125  117  113 .280 .404 .563  .967
 1998   30  535  114  159   31    1   31  102  100   84 .297 .408 .532  .941
 1999   31  557  132  166   33    0   38  116  137  118 .298 .437 .562  .999
 2000   32  585  140  178   35    1   43  122   98  108 .304 .404 .586  .990
 2001   33  600  126  173   43    4   39  130  106  135 .288 .395 .568  .964
 2002   34  571   94  166   33    2   31   98  101  130 .291 .397 .518  .916
 2003   35  605  109  168   28    2   39  100   88  119 .278 .369 .524  .893
 2004   36  572  104  152   29    2   27   89   96  131 .266 .371 .465  .836
 2005   37  100   11   25    4    0    3   19   18   21 .250 .364 .380  .744
Career     7774 1467 2291  480   33  436 1480 1339 1519 .295 .398 .533  .931
The repeated breakdowns and the repeated comebacks are only one of the extraordinary aspects of the Big Hurt’s career. For instance, what’s up with the fact that he broke into the league, in his early 20s, drawing bases on balls with tremendous frequency, nearly Ted Williams-like, and then his walk rate has gradually but steadily declined ever since. Huh? That’s a pattern that replicates, oh, just about no one else in the history of baseball.
All in all, despite his Ernie Lombardi-like “speed,” Thomas has clearly been a ferocious offensive force. Still it must be remembered that he will almost certainly fall short of playing 1,000 games on defense, and all of these were strictly as a not-good first baseman; no player currently in the Hall of Fame presents anything close to that meager a defensive contribution.
So, like Bagwell (his age contemporary to the very day), it isn’t obvious exactly how he’ll be assessed by Hall of Fame voters, given the intense competition from other great sluggers of the era. It does now appear as though the Big Hurt will surpass 500 homers, a milestone Bagwell was unable to reach, but almost certainly that factor won’t always be the litmus test it has been.
Year   Age   AB    R    H   2B   3B   HR  RBI   BB   SO   BA  OBP  SLG   OPS
 1990   22  193   42   65   12    3    9   34   44   57 .338 .462 .571 1.032
 1991   23  565  113  184   34    2   41  119  140  118 .326 .459 .611 1.070
 1992   24  580  118  192   50    2   31  125  123   93 .331 .448 .584 1.032
 1993   25  548  105  173   37    0   45  127  110   56 .315 .430 .629 1.058
 1994   26  395   98  137   32    1   34   93  100   57 .347 .479 .695 1.174
 1995   27  489   94  148   25    0   36  102  125   69 .302 .444 .577 1.021
 1996   28  522  101  179   25    0   36  124  100   65 .342 .448 .598 1.046
 1997   29  525  101  179   33    0   32  115  100   64 .340 .446 .585 1.031
 1998   30  580  101  150   33    2   26  101  101   86 .259 .369 .459  .828
 1999   31  482   68  144   34    0   14   71   80   61 .298 .398 .453  .852
 2000   32  576  106  185   41    0   39  132  103   87 .322 .424 .596 1.021
 2001   33   68    8   15    3    0    4   10   10   12 .221 .321 .441  .762
 2002   34  523   77  132   29    1   28   92   88  115 .252 .360 .472  .832
 2003   35  546   87  146   35    0   42  105  100  115 .267 .381 .562  .943
 2004   36  240   53   65   16    0   18   49   64   57 .271 .424 .563  .987
 2005   37  105   19   23    3    0   12   26   16   31 .219 .322 .590  .913
 2006   38  466   77  126   11    0   39  114   81   81 .270 .378 .545  .923
Career     7402 1369 2242  454   11  486 1539 1486 1224 .303 .419 .564  .984
Next Time
The crème de la crème.
References & Resources
In order to modify the actual stats into a shape fitting this smoothed line:
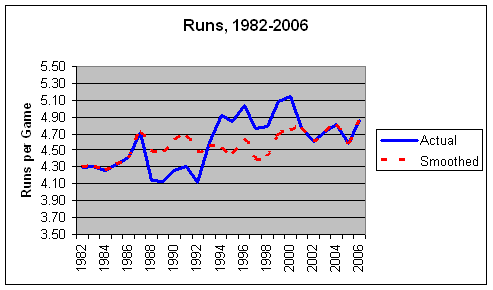
We used an approach similar to the approach we used in several past such exercises, beginning with the overall aggregate rate of the primary offensive events for the entire 1982-2006 period: runs, hits, doubles, triples, home runs, walks, and strikeouts. We then adjusted the rates for each season from 1988-1992 to bring the aggregate total for that period to equal that of 1982-2006, also for 1993, and also for 1994-2000. The specific multipliers employed are:
1988-92:
Runs: 1.087
Hits: 1.035
Doubles: 1.095
Triples: 1.012
Home Runs: 1.281
Walks: 1.011
Strikeouts: 1.056
1993:
Runs: 0.992
Hits: 0.992
Doubles: 1.023
Triples: 1.002
Home Runs: 1.097
Walks: 0.982
Strikeouts: 1.028
1994-2000:
Runs: 0.923
Hits: 0.971
Doubles: 0.943
Triples: 1.053
Home Runs: 0.906
Walks: 0.919
Strikeouts: 0.928
An impact of a change in the rate of hits is a change in at-bats, of course. I use a simple method to change at-bats: every batter’s at-bats are increased or decreased by his number of increased or decreased hits. Outs are constant, of course, and I assume as well a constant rate of double plays and baserunning outs—probably not exactly proper assumptions, but close enough for our purposes.