
Smoothing the ‘80s and ‘90s (Part 2)
Last time, we began the process of examining how the careers of prominent players would have looked quite different if 1988-92 hadn’t been so low-scoring, and 1994-2000 hadn’t been so high-scoring. This time we’ll take a look at many of the stars of the era—not quite the cream of the crop, but a layer or two just beneath it.
Bear in mind that the stat lines that appear in black font are actuals, and the lines that appear in blue are adjusted. For our methodology, see the References and Resources section below.
A Pair of Southpaws With Stuff
The young Langston could throw, as the old saying goes, a strawberry through a locomotive. But he was often at least as effective later in his career, when he lost a couple of inches off the fastball but sharpened up his control.
 Year  Age    G   IP    W    L    H   HR   BB   SO  ERA
 1984   23   35  225   17   10  188   16  118  204 3.40
 1985   24   24  127    7   14  122   22   91   72 5.47
 1986   25   37  239   12   14  234   30  123  245 4.85
 1987   26   35  272   19   13  242   30  114  262 3.84
 1988   27   35  261   15   11  230   41  111  248 3.53
 1989   28   34  250   16   14  205   20  113  248 2.89
 1990   29   33  223   10   17  223   17  105  206 4.65
 1991   30   34  246   19    8  197   38   97  193 3.17
 1992   31   32  229   13   14  213   18   75  184 3.87
 1993   32   35  256   16   11  218   24   83  202 3.29
 1994   33   18  119    7    8  117   17   50  101 4.34
 1995   34   31  200   15    7  206   19   59  132 4.30
 1996   35   18  123    6    5  113   16   41   77 4.47
 1997   36    9   48    2    4   59    7   27   28 5.43
 1998   37   22   81    4    6  104   10   38   52 5.44
 1999   38   25   62    1    2   67    8   27   40 4.87
He didn’t quite have Langston’s raw ability, but Finley was close, and he was a well-rounded pitcher who just seemed to go on and on.
 Year  Age    G   IP    W    L    H   HR   BB   SO  ERA
 1986   23   25   46    3    1   40    2   23   37 3.30
 1987   24   35   91    2    7  102    7   43   63 4.67
 1988   25   31  194    9   15  198   19   83  117 4.40
 1989   26   29  200   16    9  177   17   83  165 2.71
 1990   27   32  236   18    9  217   22   82  187 2.54
 1991   28   34  227   18    9  212   29  102  181 4.01
 1992   29   31  204    7   12  220   31   99  131 4.18
 1993   30   35  251   16   14  241   24   80  192 3.24
 1994   31   25  183   10   10  173   19   65  137 4.01
 1995   32   32  203   15   12  186   18   85  181 3.91
 1996   33   35  238   15   16  234   24   86  200 3.86
 1997   34   25  164   13    6  148   18   60  144 3.93
 1998   35   34  223   11    9  204   18  100  197 3.15
 1999   36   33  213   12   11  191   21   86  186 4.11
 2000   37   34  218   16   11  205   21   93  175 3.87
 2001   38   22  114    8    7  131   14   35   96 5.54
 2002   39   32  191   11   15  183   13   78  174 4.15
A Pair of Remarkable Righthanders
Both of these guys burst into prominence with amazingly great seasons: 19-3 and 20-3.
Never had an overpowering fastball, but excellent control and just such a heady pitcher and bulldog competitor. Great fun to watch.
 Year  Age    G   IP    W    L    H   HR   BB   SO   ERA
 1983   24    8    8    0    0    7    1    6    5  3.38
 1984   25   45  190   11    8  160    9   50  150  2.66
 1985   26   36  240   19    3  179    8   68  157  2.03
 1986   27   35  231   14   14  213   13   86  153  3.85
 1987   28   37  265   16   16  247   17   74  190  3.06
 1988   29   35  267   23    8  215   23   74  188  2.39
 1989   30   35  257   15   15  234   12   78  188  2.44
 1990   31    4   25    1    1   27    1    4   17  4.50
 1991   32   21  112    7    2  116    4   32   77  3.65
 1992   33   33  211   10   15  216   19   70  137  3.88
 1993   34   33  216   12   14  199   19   71  145  3.69
 1994   35   21  135    6    6  142   14   39   67  3.52
 1995   36   26  167   16    6  147   19   47  103  3.59
 1996   37   33  206   15    9  231   19   53  116  3.94
 1997   38   32  195   14    6  193   24   63   99  4.15
 1998   39   34  202   11   10  194   20   78  117  4.09
 1999   40   32  179   13   12  170   13   71   83  4.25
 2000   41   10   25    1    5   41    5   13   12 12.20
More sheer talent than Hershiser, but more fragile, and an overall similar career arc.
If you’ve never read it, I highly recommend Roger Angell’s A Pitcher’s Story. Cone is an unusually engaging sort, and the peerless Angell presents not simply a revealing profile of Cone, but also fascinating insights into the excruciating challenges with which every major league pitcher must grapple.
 Year  Age    G   IP    W    L    H   HR   BB   SO  ERA
 1986   23   11   23    0    0   29    2   13   21 5.56
 1987   24   21   99    5    6   87   11   44   68 3.71
 1988   25   35  231   20    3  184   13   81  225 2.34
 1989   26   34  220   14    8  189   26   75  201 3.72
 1990   27   31  212   14   10  183   27   66  246 3.41
 1991   28   34  233   14   14  211   17   74  255 3.48
 1992   29   35  250   17   10  208   19  112  276 2.97
 1993   30   34  254   11   14  203   22  112  196 3.42
 1994   31   23  172   16    5  126   14   50  123 2.73
 1995   32   30  229   18    8  189   22   81  177 3.31
 1996   33   11   72    7    2   49    3   31   66 2.67
 1997   34   29  195   12    6  150   15   79  206 2.62
 1998   35   31  208   20    7  181   18   54  194 3.30
 1999   36   31  193   12    9  159   19   83  164 3.19
 2000   37   30  155    4   14  186   23   75  111 6.41
 2001   38   25  136    9    7  148   17   57  115 4.31
 2002   39
 2003   40    5   18    1    3   20    4   13   13 6.50
Some Outstanding Third Basemen
His career was utterly inexplicable from about seven different angles, but one thing that is clear is that when HoJo was good, he was great. Those 49 homers in 1991? That would just be the all-time record for a third baseman, that’s all.

 Year  Age   AB    R    H   2B   3B   HR  RBI   BB   SO   BA  OBP  SLG   OPS
 1982   21  155   23   49    5    0    4   14   16   30 .316 .384 .426  .810
 1983   22   66   11   14    0    0    3    5    7   10 .212 .297 .348  .645
 1984   23  355   43   88   14    1   12   50   40   67 .248 .324 .394  .718
 1985   24  389   38   94   18    4   11   46   34   78 .242 .303 .393  .696
 1986   25  220   30   54   14    0   10   39   31   64 .245 .339 .445  .784
 1987   26  554   93  147   22    1   36   99   83  113 .265 .361 .504  .865
 1988   27  499   92  118   23    1   31   74   87  110 .237 .350 .471  .821
 1989   28  577  113  170   45    3   46  110   78  133 .294 .378 .623 1.001
 1990   29  595   97  149   41    3   29   98   70  106 .251 .329 .477  .806
 1991   30  569  117  151   37    4   49  127   79  127 .266 .355 .602  .957
 1992   31  353   52   81   21    0    9   47   56   83 .229 .334 .364  .698
 1993   32  235   32   56    8    2    8   26   42   44 .237 .353 .387  .740
 1994   33  226   28   47    9    2    9   37   36   68 .207 .315 .388  .703
 1995   34  168   24   32    4    1    6   20   31   43 .191 .318 .339  .656
Yes, Pendleton’s winning the MVP vote over Barry Bonds in ’91 was pretty wacky. But it is the case that in both that season and the next, Pendleton delivered major star performance. Those two years were way out of proportion to anything else he ever did, but weird as it was, it really happened.
 Year  Age   AB    R    H   2B   3B   HR  RBI   BB   SO   BA  OBP  SLG  OPS
 1984   23  262   37   85   16    3    1   33   16   32 .324 .357 .420 .777
 1985   24  559   56  134   16    3    5   69   37   75 .240 .287 .306 .593
 1986   25  578   56  138   26    5    1   59   34   59 .239 .281 .306 .587
 1987   26  583   82  167   29    4   12   96   70   74 .286 .363 .412 .775
 1988   27  395   48  103   22    2    8   58   21   54 .260 .298 .384 .682
 1989   28  619   90  168   31    5   17   80   44   86 .271 .320 .418 .738
 1990   29  451   50  107   22    2    8   63   30   61 .237 .285 .345 .630
 1991   30  593  102  194   37    8   28   93   43   74 .327 .373 .560 .932
 1992   31  647  107  206   43    1   27  114   37   71 .318 .356 .512 .868
 1993   32  632   80  171   34    1   19   83   35  100 .270 .309 .415 .724
 1994   33  307   23   76   17    3    6   28   11   53 .247 .273 .385 .658
 1995   34  509   65  145   30    1   13   72   35   78 .284 .330 .423 .753
 1996   35  564   47  131   25    1   10   69   38  103 .232 .280 .333 .613
 1997   36  112   10   27    8    0    1   16   11   13 .242 .310 .342 .652
 1998   37  235   16   59    9    0    3   27   14   45 .252 .293 .327 .620
An interestingly similar story to that of Pendleton: a longtime defensive star with a lackluster bat suddenly erupts as a power threat in his early 30s. But unlike Pendleton, Caminiti’s stats in his late-blossoming phase were amplified by the scoring environment. Seen in the perspective provided by this exercise, Caminiti’s career arc, while hardly typical, looks less odd than in real time.
 Year  Age   AB    R    H   2B   3B   HR  RBI   BB   SO   BA  OBP  SLG  OPS
 1987   24  203   10   50    7    1    3   23   12   44 .246 .288 .335 .623
 1988   25   84    5   16    2    0    1    8    5   19 .186 .232 .258 .491
 1989   26  590   77  154   34    3   13   78   52   98 .261 .321 .394 .715
 1990   27  546   57  136   22    2    5   55   49  102 .249 .310 .324 .634
 1991   28  579   71  150   33    3   17   87   47   90 .259 .314 .413 .727
 1992   29  511   74  154   34    2   17   67   44   72 .302 .358 .474 .831
 1993   30  542   74  141   32    0   14   74   48   91 .260 .320 .397 .718
 1994   31  403   58  112   26    2   16   69   40   66 .277 .342 .475 .817
 1995   32  521   68  154   31    0   24   87   63   87 .296 .372 .491 .864
 1996   33  541  101  173   35    2   36  120   72   92 .320 .399 .593 .992
 1997   34  482   85  137   26    0   24   83   74  110 .284 .379 .486 .864
 1998   35  449   80  111   27    0   26   76   65  100 .247 .342 .483 .826
 1999   36  271   42   76   10    1   12   52   42   54 .280 .377 .456 .833
 2000   37  206   39   61   12    0   14   42   39   34 .297 .408 .554 .962
 2001   38  356   36   81   17    1   15   41   43   85 .228 .311 .407 .718
He never developed the faintest notion of strike zone judgment, and his huge, looping, leg-kick-driven swing wasn’t without holes. But when the young Williams got ahold of one, it reliably went a very, very long way. His tie-breaking homer in the fourth game of the 1989 NLCS was one of the most thrilling events I’ve ever had the pleasure of witnessing live. As soon as Williams launched it, the reality of the Giants winning their first pennant in 27 years, their first pennant that I could understand as it happened, was gloriously apparent.
 Year  Age   AB    R    H   2B   3B   HR  RBI   BB   SO   BA  OBP  SLG   OPS
 1987   21  245   28   46    9    2    8   21   16   68 .188 .238 .339  .576
 1988   22  157   18   33    7    1   10   21    8   43 .211 .249 .461  .711
 1989   23  294   34   61   20    1   23   54   14   76 .208 .244 .517  .761
 1990   24  623   95  177   30    2   42  133   33  146 .284 .321 .542  .862
 1991   25  595   78  164   26    5   44  107   33  135 .275 .314 .556  .870
 1992   26  533   63  124   14    5   26   72   39  115 .233 .286 .423  .709
 1993   27  578  104  169   34    4   42  109   27   82 .292 .323 .581  .904
 1994   28  442   68  116   15    3   39   89   30   81 .262 .309 .575  .884
 1995   29  280   49   92   16    1   21   60   28   54 .329 .389 .617 1.006
 1996   30  400   64  118   15    1   20   78   36   84 .296 .354 .488  .842
 1997   31  591   79  152   30    3   29   97   31  100 .258 .295 .467  .761
 1998   32  506   66  132   25    1   18   66   40   95 .261 .314 .421  .735
 1999   33  621   90  184   35    2   32  131   38   86 .297 .337 .513  .850
 2000   34  368   40   99   17    2   11   43   18   47 .269 .304 .415  .719
 2001   35  408   58  112   30    0   16   65   22   70 .275 .312 .466  .777
 2002   36  215   29   56    7    2   12   40   21   41 .260 .326 .479  .805
 2003   37  134   17   33    9    0    4   16   16   26 .246 .327 .403  .730
Well, he wasn’t much of a third baseman at that. Actually, the story is that supposedly Edgar wasn’t really a lousy fielder so much as it was that he just kept getting hurt all the time while playing defense, and with a bat like that, it made sense for the Mariners to just say the heck with it, he’ll be a designated hitter.
The offensive value he delivered was tremendous. With any kind of a defensive contribution, as a lousy defensive third baseman or even as a lousy defensive first baseman, he’d have a Hall of Fame case. But as it is, I really don’t see it.
 Year  Age   AB    R    H   2B   3B   HR  RBI   BB   SO   BA  OBP  SLG   OPS
 1987   24   43    6   16    5    2    0    5    2    5 .372 .400 .581  .981
 1988   25   32    0    9    4    0    0    5    4    7 .281 .367 .423  .791
 1989   26  172   22   42    5    0    3   22   17   27 .246 .314 .322  .637
 1990   27  492   77  152   30    2   14   53   75   65 .309 .400 .463  .864
 1991   28  550  107  173   38    1   18   57   85   76 .314 .406 .486  .892
 1992   29  534  109  187   50    3   23   79   55   64 .351 .411 .586  .997
 1993   30  135   20   32    7    0    4   13   27   20 .236 .365 .386  .751
 1994   31  323   43   90   22    1   12   47   49   39 .279 .374 .462  .836
 1995   32  506  112  177   49    0   26  104  107   81 .349 .463 .602 1.065
 1996   33  494  112  158   49    2   24   95  113   78 .320 .447 .571 1.018
 1997   34  537   96  174   33    1   25  100  109   80 .324 .438 .531  .969
 1998   35  551   79  174   43    1   26   94   97   89 .315 .418 .541  .960
 1999   36  497   79  164   33    1   22   79   89   92 .330 .432 .532  .964
 2000   37  551   92  175   29    0   34  134   88   88 .317 .412 .553  .965
 2001   38  470   80  144   40    1   23  116   93   90 .306 .421 .543  .964
 2002   39  328   42   91   23    0   15   59   67   69 .277 .400 .485  .885
 2003   40  497   72  146   25    0   24   98   92   95 .294 .404 .489  .893
 2004   41  486   45  128   23    0   12   63   58  107 .263 .342 .385  .727
A Couple of Control Artist Lefties
Just your typical guy who struggles mightily until he’s in his mid-30s, and then has his peak from 35 to 40. Happens all the time, just like … um … you know, pitchers such as … um …
 Year  Age    G   IP    W    L    H   HR   BB   SO  ERA
 1986   23   16   87    7    4  107   10   42   45 5.05
 1987   24   35  201   12   15  210   28   97  147 5.10
 1988   25   34  202    9   15  220   26   56  128 3.68
 1989   26   15   76    4    9   87   13   33   46 5.13
 1990   27   33  102    2    6  119    8   39   61 4.92
 1991   28    8   31    0    5   39    6   16   21 6.06
 1992   29
 1993   30   25  152   12    9  159   14   38   95 3.62
 1994   31   23  149    5    7  157   25   37   89 4.91
 1995   32   27  116    8    6  114   16   28   60 4.84
 1996   33   34  161   13    3  172   21   42   73 3.69
 1997   34   30  189   17    5  182   19   40  105 3.58
 1998   35   34  234   15    9  227   21   39  147 3.28
 1999   36   32  228   14    8  228   21   44  127 3.59
 2000   37   26  154   13   10  168   20   49   91 5.10
 2001   38   33  210   20    6  182   22   40  110 3.18
 2002   39   34  231   13    8  198   28   50  147 3.32
 2003   40   33  215   21    7  199   19   66  129 3.27
 2004   41   34  202    7   13  217   44   63  125 5.21
 2005   42   32  200   13    7  225   23   52  102 4.28
 2006   43   33  211   11   14  228   33   51  108 4.30
… that’s it! Just like this one!
Do two guys consititute a “type”?
 Year  Age    G   IP    W    L    H   HR   BB   SO  ERA
 1987   24   18   29    4    3   37    0   12   32 3.99
 1988   25   41   64    3    5   67   15   31   59 4.88
 1989   26   54   86    7    4   68    6   28   82 2.54
 1990   27   43  189   11    6  171   18   45  121 3.32
 1991   28   40  198   15   10  195   31   50  112 3.93
 1992   29   41  120    7    9  143   20   36   65 5.70
 1993   30   32  187   11    9  181   29   41  143 4.31
 1994   31   16  111    5    7  110   12   22   66 3.68
 1995   32   29  203   16    8  188   21   49  123 3.01
 1996   33   34  224   11   14  240   29   47  121 4.77
 1997   34   32  218   16   10  232   22   41  145 3.91
 1998   35   30  214   18    4  189   26   27  151 3.24
 1999   36   34  232   17   10  239   29   57  157 4.47
 2000   37   35  230   20    8  258   21   28  154 3.81
 2001   38   16  101    5    7  120   12   21   59 4.47
 2002   39   31  206   19    7  210   21   45  137 3.75
 2003   40   31  213   15    7  242   24   20  101 4.14
 2004   41   31  196   12    8  203   23   20  101 3.73
 2005   42   30  184   15    7  220   21   21  107 4.45
 2006   43   13   75    3    5   97   11   12   38 4.42
The Thrill
We discussed here the manner in which Clark’s early career and late career didn’t really match up. But this exercise illuminates it vividly: here it’s plain to see just how brilliant he was as a young player, and just what a shadow of himself Clark was thereafter.
 Year  Age   AB    R    H   2B   3B   HR  RBI   BB   SO   BA  OBP  SLG   OPS
 1986   22  408   66  117   27    2   11   41   34   76 .287 .342 .444  .785
 1987   23  529   89  163   29    5   35   91   49   98 .308 .367 .580  .947
 1988   24  581  111  168   34    6   37  118  101  136 .289 .394 .560  .954
 1989   25  595  113  203   42    9   29  121   75  109 .341 .415 .590 1.005
 1990   26  606   99  183   27    5   24  103   63  102 .302 .368 .485  .852
 1991   27  571   91  176   35    7   37  126   52   96 .308 .366 .590  .955
 1992   28  518   75  159   44    1   20   79   74   87 .308 .394 .515  .908
 1993   29  490   81  138   28    2   15   72   62   70 .281 .362 .440  .802
 1994   30  385   67  124   23    2   12   74   65   55 .323 .421 .484  .905
 1995   31  450   78  133   25    3   15   85   63   46 .296 .381 .463  .844
 1996   32  432   64  120   24    1   12   66   59   62 .278 .365 .420  .784
 1997   33  389   52  124   27    1   11   47   45   58 .319 .390 .479  .869
 1998   34  549   90  164   39    1   21   94   66   90 .299 .374 .487  .861
 1999   35  249   37   74   14    0    9   27   35   39 .297 .383 .463  .846
 2000   36  423   72  132   28    2   19   65   63   64 .312 .402 .524  .926
A Couple of Consistent Winners
Absolute proof of the venerable wisdom that overpowering stuff isn’t a requirement to be a star pitcher. All that’s required is to throw strikes, hit spots, change speeds, keep the ball in the park, and control the running game … you know, a piece of cake.
 Year  Age    G   IP    W    L    H   HR   BB   SO  ERA
 1995   23   31  175   12    9  178   14   58  106 3.87
 1996   24   35  221   21    8  222   21   66  150 3.59
 1997   25   35  240   18    7  226    6   60  154 2.67
 1998   26   33  216   16   11  219   18   80  136 3.94
 1999   27   31  192   14   11  210   18   82  112 4.36
 2000   28   32  205   19    9  213   15   74  116 4.04
 2001   29   31  201   15   10  224   14   41  164 3.99
 2002   30   22  135   13    5  144    6   32   97 3.27
 2003   31   33  208   21    8  227   21   50  180 4.02
 2004   32   15   83    6    4   71    8   31   79 3.90
 2005   33   33  222   17    9  188   17   41  171 2.39
 2006   34   36  214   14   13  238   27   70  178 4.20
Hit spots? This guy hits microdots.
Never great, but so very good for so very long that a Hall of Fame case may be starting to form.
Year  Age    G   IP    W    L    H   HR   BB   SO  ERA
 1991   22   12   88    4    5   80    9   21   55 3.03
 1992   23   32  241   18    5  210   18   47  134 2.61
 1993   24   25  168   14    6  158   18   40  109 4.14
 1994   25   24  176   16    5  158   17   39   92 2.84
 1995   26   32  222   19    9  182   22   46  147 3.05
 1996   27   36  243   19   11  256   28   63  189 4.46
 1997   28   33  225   15    8  191   24   50  202 2.97
 1998   29   29  206   13   10  183   20   38  162 3.24
 1999   30   31  203   18    7  201   15   48  160 3.25
 2000   31   34  238   11   15  229   25   42  195 3.52
 2001   32   34  229   17   11  202   20   42  214 3.15
 2002   33   33  216   18   10  208   27   48  182 4.05
 2003   34   31  215   17    8  192   21   40  195 3.40
 2004   35   27  165   12    9  178   22   40  132 4.59
 2005   36   30  180   13    8  199   23   47  142 4.41
 2006   37   32  197   15    7  184   22   35  172 3.51
The Duo
(With apologies to the late great Sammy Cahn)
Lou and Trammell, Lou and Trammell
Go together like a hump and camel
This I tell you brother
You can’t have one without the other
Lou and Alan, Lou and Alan
They’re linked together just like miles and gallons
Ask the local gentry
And they will say it’s elementary
Try, try, try to separate them
It’s an illusion
Try, try, try, and you will only come
To this conclusion
Lou and Trammell, Lou and Trammell
Go together like a hump and camel
Dad was told by mother
You can’t have one without the other
The power the veteran Sweet Lou displayed was something pretty special. That is a 36-homer season you see there in 1989.
 Year  Age   AB   R    H    2B   3B   HR  RBI   BB   SO   BA  OBP  SLG  OPS
 1977   20   32    5    8    1    0    0    2    4    6 .250 .333 .281 .615
 1978   21  484   71  138   12    7    3   58   61   65 .285 .365 .357 .723
 1979   22  423   75  121   14    8    3   42   78   66 .286 .397 .378 .775
 1980   23  477   68  111   19    1    1   45   73   79 .233 .335 .283 .618
 1981   24  335   48   88   14    4    5   36   40   42 .263 .341 .373 .714
 1982   25  560   76  160   22    8   15   65   48   58 .286 .342 .434 .776
 1983   26  643   94  206   40    6   12   72   67   70 .320 .385 .457 .842
 1984   27  558   90  161   25    1   13   56   62   63 .289 .360 .407 .766
 1985   28  609  102  170   29    8   21   73   80   56 .279 .363 .456 .819
 1986   29  584   95  157   26    6   20   73   63   70 .269 .340 .437 .777
 1987   30  604  110  160   38    6   16   59   71  108 .265 .342 .427 .769
 1988   31  407   59  115   20    2   15   60   67   64 .282 .384 .454 .838
 1989   32  514   84  133   23    1   36   92   90   62 .258 .369 .516 .885
 1990   33  476   82  116   24    2   23   65   75   75 .244 .346 .448 .794
 1991   34  475  102  136   28    2   29   85   91   48 .286 .401 .540 .941
 1992   35  457   84  130   28    0   24   77   82   49 .285 .394 .507 .901
 1993   36  382   71  110   33    1   10   66   77   47 .288 .407 .457 .863
 1994   37  319   62   94   20    2   11   40   38   44 .295 .369 .472 .842
 1995   38  247   33   71   13    0   13   41   28   38 .287 .361 .495 .856
Trammell didn’t necessarily get hosed in the 1987 AL MVP voting; although he was clearly deserving, you could make a case for a few other guys as well. What is definite is that the guy who did win it didn’t deserve it. Win Shares has it as Trammell 35, Wade Boggs 32, Mark McGwire 30, Kirby Puckett 29, Paul Molitor 29, Don Mattingly 27, and George Bell (the MVP winner) 26.
 Year  Age   AB   R    H    2B   3B   HR  RBI   BB   SO   BA  OBP  SLG  OPS
 1977   19   43    6    8    0    0    0    0    4   12 .186 .255 .186 .441
 1978   20  448   49  120   14    6    2   34   45   56 .268 .335 .339 .674
 1979   21  460   68  127   11    4    6   50   43   55 .276 .338 .357 .694
 1980   22  560  107  168   21    5    9   65   69   63 .300 .377 .404 .780
 1981   23  392   52  101   15    3    2   31   49   31 .258 .340 .327 .667
 1982   24  489   66  126   34    3    9   57   52   47 .258 .329 .395 .724
 1983   25  505   83  161   31    2   14   66   57   64 .319 .388 .471 .859
 1984   26  555   85  174   34    5   14   69   60   63 .314 .380 .468 .849
 1985   27  605   79  156   21    7   13   57   50   71 .258 .315 .380 .695
 1986   28  574  107  159   33    7   21   75   59   57 .277 .344 .469 .813
 1987   29  597  109  205   34    3   28  105   60   47 .343 .403 .551 .954
 1988   30  471   79  150   26    1   19   75   47   49 .319 .380 .501 .881
 1989   31  453   59  113   22    3    6   47   45   48 .249 .318 .353 .671
 1990   32  565   77  176   41    1   18   97   69   58 .312 .386 .482 .868
 1991   33  378   62   96   22    0   12   60   37   41 .255 .322 .404 .725
 1992   34  103   12   29    8    1    1   12   15    4 .281 .374 .413 .787
 1993   35  400   71  131   26    3   13   59   37   39 .327 .385 .505 .890
 1994   36  290   35   76   16    1    7   26   15   32 .261 .297 .399 .696
 1995   37  221   26   58   11    0    2   21   25   18 .263 .338 .339 .677
 1996   38  192   15   44    2    0    1   15    9   25 .228 .263 .252 .515
A Hall of Fame Quintet
Yes, he wasn’t as great as his reputation would have it, and the rush to put him in Cooperstown on his first ballot was a bit much. But it is the case that this guy played damn great baseball.
 Year  Age   AB    R    H   2B   3B   HR  RBI   BB   SO   BA  OBP  SLG  OPS
 1984   24  557   63  165   12    5    0   31   16   69 .296 .316 .336 .652
 1985   25  691   80  199   29   13    4   74   41   87 .288 .328 .385 .713
 1986   26  680  119  223   37    6   31   96   34   99 .328 .360 .537 .897
 1987   27  624   96  207   32    5   28   99   32   91 .332 .364 .534 .898
 1988   28  665  118  242   46    5   31  132   23   88 .364 .386 .587 .973
 1989   29  643   82  223   49    4   12   92   41   62 .346 .386 .490 .876
 1990   30  557   89  170   44    3   15   87   58   77 .305 .370 .477 .847
 1991   31  618  100  202   32    6   19   97   31   82 .327 .359 .491 .850
 1992   32  646  113  217   42    4   24  120   44  102 .336 .379 .526 .905
 1993   33  620   88  182   40    3   24   88   46   96 .294 .343 .485 .828
 1994   34  435   73  135   30    3   18  103   26   44 .310 .349 .519 .868
 1995   35  533   77  164   37    0   21   91   51   83 .308 .369 .494 .863
Career     7269 1098 2329  429   57  227 1110  444  980 .320 .360 .489 .849
A terrific player, of course, but what pushed him into Hall of Fame territory was that second wind he got in 1987-89, and especially the ’89 MVP. This exercise illustrates just what a splendid performance that was.
 Year  Age   AB    R    H   2B   3B   HR  RBI   BB   SO   BA  OBP  SLG  OPS
 1974   18  344   48   86   14    5    3   26   12   46 .250 .275 .346 .621
 1975   19  558   67  149   28    2    8   52   33   69 .267 .308 .367 .675
 1976   20  638   59  161   19    3    2   54   38   69 .252 .294 .301 .595
 1977   21  605   66  174   34    4    4   49   41   80 .288 .333 .377 .710
 1978   22  502   66  147   23    9    9   71   24   43 .293 .325 .428 .753
 1979   23  577   72  154   26    5    8   51   35   52 .267 .309 .371 .680
 1980   24  611  121  179   49   10   23   87   26   67 .293 .322 .519 .841
 1981   25  377   50  103   15    5   10   49   22   37 .273 .313 .419 .732
 1982   26  635  129  210   46   12   29  114   54   63 .331 .383 .578 .961
 1983   27  578  102  178   42   10   17   80   72   58 .308 .385 .503 .888
 1984   28  624  105  186   27    7   16   80   67   67 .298 .366 .441 .807
 1985   29  466   76  129   26    3   15   68   49   56 .277 .346 .442 .788
 1986   30  522   82  163   31    7    9   46   62   73 .312 .385 .450 .835
 1987   31  635   99  198   25    9   21  103   76   94 .312 .385 .479 .864
 1988   32  628  100  197   42   11   17   99   64   67 .313 .377 .495 .871
 1989   33  621  110  202   42    9   27  112   64   75 .325 .388 .551 .939
 1990   34  592  107  150   19    5   22   84   79   94 .254 .341 .412 .754
 1991   35  508   72  136   22    4   13   84   55   83 .267 .338 .402 .740
 1992   36  562   77  152   44    3   10   84   54   86 .271 .334 .414 .748
 1993   37  453   61  116   26    3    9   51   43   96 .256 .321 .384 .705
Career    11036 1669 3170  598  126  271 1443  969 1374 .287 .345 .438 .783
One of the more odd career arcs, for sure. At the ages when most great players are presenting their peak peformances—24 through 29—Molitor was mostly struggling with injuries. Being deployed primarily as a designated hitter from age 34 obviously benefitted him, but even with that, Molitor’s career is striking in the degree to which his 30s greatly overshadow his 20s.
Molitor and Yount, Brewer organization products very nearly the same age, were both right-handed hitters with picture-smooth, perfectly-balanced swings that consistently produced line-drive power to all fields. Indeed the only right-hander I’ve seen who took the ball the other way as beautifully as either of them has been a guy we’ll examine next time: Mike Piazza.
 Year  Age   AB    R    H   2B   3B   HR  RBI   BB   SO   BA  OBP  SLG   OPS
 1978   21  521   73  142   26    4    6   45   19   54 .273 .298 .372  .671
 1979   22  584   88  188   27   16    9   62   48   48 .322 .373 .469  .843
 1980   23  450   81  137   29    2    9   37   48   48 .304 .371 .438  .809
 1981   24  251   45   67   11    0    2   19   25   29 .267 .333 .335  .668
 1982   25  666  136  201   26    8   19   71   69   93 .302 .367 .450  .818
 1983   26  608   95  164   28    6   15   47   59   74 .270 .334 .410  .744
 1984   27   46    3   10    1    0    0    6    2    8 .217 .250 .239  .489
 1985   28  576   93  171   28    3   10   48   54   80 .297 .357 .408  .765
 1986   29  437   62  123   24    6    9   55   40   81 .281 .342 .426  .767
 1987   30  465  114  164   41    5   16   75   69   67 .353 .436 .566 1.002
 1988   31  616  125  197   37    6   17   65   72   57 .319 .391 .481  .871
 1989   32  622   91  201   38    4   14   61   65   71 .323 .387 .466  .852
 1990   33  422   70  123   30    6   15   49   37   54 .292 .349 .500  .849
 1991   34  673  145  224   35   13   22   82   78   65 .332 .402 .521  .923
 1992   35  616   97  202   39    7   15   97   74   70 .328 .400 .490  .889
 1993   36  634  120  209   38    5   24  110   76   73 .330 .401 .520  .921
 1994   37  449   79  150   28    4   13   69   51   45 .335 .402 .501  .903
 1995   38  521   58  138   29    2   14   55   56   53 .265 .336 .407  .743
 1996   39  653   91  218   39    8    8  104   51   67 .334 .383 .457  .840
 1997   40  533   58  159   30    4    9   82   41   68 .299 .349 .422  .771
 1998   41  498   69  137   27    5    4   64   41   38 .275 .331 .373  .703
Career    10841 1794 3325  612  116  250 1303 1075 1242 .307 .369 .454  .823
Could he hit, or what?
The sportswriters always marveled at how much fun Puckett seemed to be having while he played, and with good reason. But Brett always seemed to be having a ball out there too, even when he was in full hell-for-leather mode. Of course, who among us wouldn’t, if we could perform like that?
 Year  Age   AB    R    H   2B   3B   HR  RBI   BB   SO   BA  OBP  SLG   OPS
 1973   20   40    2    5    2    0    0    0    0    5 .125 .125 .175  .300
 1974   21  457   49  129   21    5    2   47   21   38 .282 .314 .363  .677
 1975   22  634   84  195   35   13   11   89   46   49 .308 .354 .456  .810
 1976   23  645   94  215   34   14    7   67   49   36 .333 .380 .462  .842
 1977   24  564  105  176   32   13   22   88   55   24 .312 .373 .532  .905
 1978   25  510   79  150   45    8    9   62   39   35 .294 .344 .467  .811
 1979   26  645  119  212   42   20   23  107   51   36 .329 .378 .563  .941
 1980   27  449   87  175   33    9   24  118   58   22 .390 .460 .664 1.123
 1981   28  347   42  109   27    7    6   43   27   23 .314 .364 .484  .848
 1982   29  552  101  166   32    9   21   82   71   51 .301 .380 .505  .886
 1983   30  464   90  144   38    2   25   93   57   39 .310 .386 .563  .948
 1984   31  377   42  107   21    3   13   69   38   37 .284 .349 .459  .808
 1985   32  550  108  184   38    5   30  112  103   49 .335 .440 .585 1.025
 1986   33  441   70  128   28    4   16   73   80   45 .290 .399 .481  .880
 1987   34  427   71  124   18    2   22   78   72   47 .290 .393 .496  .889
 1988   35  595   98  186   46    3   31  112   83   54 .313 .397 .555  .952
 1989   36  462   73  134   28    3   15   87   60   50 .289 .371 .464  .835
 1990   37  550   89  185   49    7   18   95   57   67 .337 .399 .550  .948
 1991   38  510   84  134   44    2   13   66   59   79 .262 .338 .431  .770
 1992   39  598   60  175   38    5    9   66   35   73 .293 .332 .419  .751
 1993   40  559   68  148   32    3   21   74   38   69 .264 .312 .444  .755
Career    10376 1615 3181  684  137  338 1629 1098  927 .307 .373 .497  .869
This exercise nets The Express an extra 64 strikeouts. Like he needs ’em.
Ryan’s been overrated for so long and so much that he’s gotten pretty close to being underrated these days. What an utterly amazing pitcher he was, in so many ways.
 Year  Age    G   IP    W    L    H   HR   BB   SO   ERA
 1966   19    2    3    0    1    5    1    3    6 15.00
 1967   20
 1968   21   21  134    6    9   93   12   75  133  3.09
 1969   22   25   89    6    3   60    3   53   92  3.53
 1970   23   27  132    7   11   86   10   97  125  3.42
 1971   24   30  152   10   14  125    8  116  137  3.97
 1972   25   39  284   19   16  166   14  157  329  2.28
 1973   26   41  326   21   16  238   18  162  383  2.87
 1974   27   42  333   22   16  221   18  202  367  2.89
 1975   28   28  198   14   12  152   13  132  186  3.45
 1976   29   39  284   17   18  193   13  183  327  3.36
 1977   30   37  299   19   16  198   12  204  341  2.77
 1978   31   31  235   10   13  183   12  148  260  3.72
 1979   32   34  223   16   14  169   15  114  223  3.60
 1980   33   35  234   11   10  205   10   98  200  3.35
 1981   34   21  149   11    5   99    2   68  140  1.69
 1982   35   35  250   16   12  196   20  109  245  3.16
 1983   36   29  196   14    9  134    9  101  183  2.98
 1984   37   30  184   12   11  143   12   69  197  3.04
 1985   38   35  232   10   12  205   12   95  209  3.80
 1986   39   30  178   12    8  119   14   82  194  3.34
 1987   40   34  212    8   16  154   14   87  270  2.76
 1988   41   33  220   12   11  193   23   88  241  3.72
 1989   42   32  239   16   10  168   22   99  318  3.38
 1990   43   30  204   13    9  142   23   75  245  3.63
 1991   44   27  173   12    6  106   15   73  214  3.07
 1992   45   27  157    5    9  143   12   70  166  3.93
 1993   46   13   66    5    5   54    5   39   47  5.02
Career      807 5386  324  292 3948  342 2799 5778  3.23
Stunning Talent Out of Central L.A.
Rarely in history have two guys, the same age, come out of the same neighborhood, quite like these two. Wow.
He probably wasn’t the very fastest baseball player I ever saw—I think that would be Deion Sanders—but the young Eric Davis could flat-out fly. And the only other guy that slim I’ve ever seen generate that kind of power was George Foster at his peak. The problem, of course, was that from the get-go Davis was about as sturdy as a potato chip.
 Year  Age   AB    R    H   2B   3B   HR  RBI   BB   SO   BA  OBP  SLG  OPS
 1984   22  174   33   39   10    1   10   30   24   48 .224 .320 .466 .786
 1985   23  122   26   30    3    3    8   18    7   39 .246 .287 .516 .803
 1986   24  415   97  115   15    3   27   71   68  100 .277 .379 .523 .902
 1987   25  474  120  139   23    4   37  100   84  134 .293 .400 .593 .992
 1988   26  477   88  134   20    3   33  101   66  131 .280 .367 .544 .911
 1989   27  467   81  135   15    2   44  110   69  123 .288 .380 .610 .990
 1990   28  457   91  122   28    2   31   94   61  106 .267 .353 .540 .893
 1991   29  287   42   69   11    0   14   36   49   97 .241 .351 .427 .778
 1992   30  269   23   63    9    1    6   35   36   75 .235 .326 .346 .672
 1993   31  450   70  106   18    1   22   67   54  109 .236 .318 .427 .745
 1994   32  119   18   21    4    0    3   12   17   42 .179 .279 .279 .558
 1995   33
 1996   34  412   75  116   19    0   24   77   64  112 .281 .378 .498 .876
 1997   35  157   27   47   10    0    7   23   13   44 .298 .351 .503 .854
 1998   36  448   75  144   27    1   25   82   40  100 .321 .377 .557 .934
 1999   37  190   25   48    8    2    5   28   28   45 .251 .346 .390 .736
 2000   38  252   35   75   13    0    5   37   33   56 .297 .379 .414 .793
 2001   39  156   17   32    7    3    4   22   13   38 .205 .266 .365 .632
The young Strawberry had fine speed, but he wasn’t the most graceful of outfielders. And his enormous uppercutting swing was never going to produce much of a batting average. But his power was as prodigious as any ever exhibited.
We see here that the offensive dip of the late ’80s cost Strawberry a 50-homer season. He would have been just the sixth National Leaguer in history to reach that benchmark.
 Year  Age   AB    R    H   2B   3B   HR  RBI   BB   SO   BA  OBP  SLG   OPS
 1983   21  420   63  108   15    7   26   74   47  128 .257 .336 .512  .848
 1984   22  522   75  131   27    4   26   97   75  131 .251 .343 .467  .810
 1985   23  393   78  109   15    4   29   79   73   96 .277 .391 .557  .948
 1986   24  475   76  123   27    5   27   93   72  141 .259 .356 .507  .864
 1987   25  532  108  151   32    5   39  104   97  122 .284 .394 .583  .977
 1988   26  548  110  151   30    3   50  110   86  134 .276 .374 .614  .988
 1989   27  480   75  111   28    1   37   84   62  111 .231 .318 .527  .845
 1990   28  547  100  155   20    1   47  118   71  116 .284 .366 .583  .949
 1991   29  510   94  139   24    4   36  108   76  132 .272 .366 .546  .913
 1992   30  157   22   38    9    0    6   27   19   36 .244 .326 .421  .747
 1993   31  100   12   14    2    0    5   12   16   20 .139 .256 .324  .580
 1994   32   91   12   21    3    1    4   16   17   20 .234 .357 .407  .764
 1995   33   86   14   23    4    1    3   12    9   20 .270 .340 .433  .773
 1996   34  200   32   51   12    0   10   33   28   51 .257 .349 .467  .816
 1997   35   29    1    3    1    0    0    2    3    8 .101 .179 .133  .312
 1998   36  293   41   71   10    2   22   53   42   84 .242 .338 .515  .852
 1999   37   49    9   16    5    0    3    6   16   15 .320 .486 .585 1.071
A Couple More Great Cases of What Might Have Been
As we examined here, a normal, no-surprises career progression would have delivered Sierra someplace pretty close to Cooperstown. This exercise illustrates just what kind of a spectacular young talent he was.
 Year  Age   AB    R    H   2B   3B   HR  RBI   BB   SO   BA  OBP  SLG  OPS
 1986   20  382   50  101   13   10   16   55   22   65 .264 .304 .476 .781
 1987   21  643   97  169   35    4   30  109   39  114 .263 .305 .470 .775
 1988   22  621   84  162   35    2   29   99   44   96 .260 .310 .466 .775
 1989   23  641  110  201   38   14   37  129   43   87 .313 .357 .591 .948
 1990   24  614   76  176   41    2   20  104   50   91 .287 .340 .459 .799
 1991   25  668  120  210   48    5   32  126   57   96 .315 .368 .546 .914
 1992   26  607   90  173   37    7   22   95   45   72 .285 .335 .477 .812
 1993   27  629   76  146   24    5   24  100   51  100 .232 .289 .400 .690
 1994   28  423   66  111   20    1   21   85   21   59 .262 .297 .462 .759
 1995   29  475   67  122   30    0   17   79   42   71 .257 .318 .430 .748
 1996   30  514   56  124   25    2   11   66   55   77 .242 .315 .361 .676
 1997   31
 1998   32   74    6   16    4    1    4   10    3   10 .211 .240 .439 .679
 1999   33
 2000   34   60    5   14    0    0    1    6    4    8 .228 .273 .274 .547
 2001   35  344   55  100   22    1   23   67   19   52 .291 .328 .561 .889
 2002   36  419   47  113   23    0   13   60   31   66 .270 .320 .418 .738
 2003   37  307   33   83   17    1    9   43   27   47 .270 .329 .420 .750
 2004   38  307   40   75   12    1   17   65   25   55 .244 .301 .456 .757
 2005   39  170   14   39   12    0    4   29    9   41 .229 .268 .371 .639
 2006   40   28    3    5    1    0    0    4    4    7 .179 .281 .214 .496
The sixth American Leaguer to reach 50 dingers in a season would have been this particular fellow. There’s little discernible difference between his skill profile and Strawberry’s.
When he was active, and since, Canseco’s eccentric antics have tended to obscure our appreciation of his performance. He had plenty of weaknesses, for sure, but for a long time and through a number of weird developments, this guy delivered stupendous power.
 Year  Age   AB    R    H   2B   3B   HR  RBI   BB   SO   BA  OBP  SLG   OPS
 1985   20   96   16   29    3    0    5   13    4   31 .302 .330 .490  .820
 1986   21  600   85  144   29    1   33  117   65  175 .240 .314 .457  .771
 1987   22  630   81  162   35    3   31  113   50  157 .257 .312 .470  .782
 1988   23  617  131  194   37    0   54  135   79  135 .314 .392 .636 1.028
 1989   24  229   44   63   10    1   22   62   23   73 .276 .342 .612  .955
 1990   25  486   90  137   15    2   47  110   73  167 .281 .375 .614  .989
 1991   26  577  125  157   35    1   56  133   79  161 .273 .360 .630  .990
 1992   27  443   81  111   16    0   33   95   64  135 .250 .344 .513  .857
 1993   28  231   30   59   14    1   11   46   16   64 .254 .301 .467  .769
 1994   29  425   81  117   18    2   28   83   63  106 .276 .370 .526  .896
 1995   30  392   59  117   24    1   22   75   39   86 .299 .362 .531  .893
 1996   31  357   63  101   21    1   25   76   58   76 .283 .383 .560  .943
 1997   32  385   52   88   18    0   21   68   47  113 .229 .313 .438  .751
 1998   33  579   90  134   25    0   42   99   60  148 .231 .303 .490  .793
 1999   34  426   69  116   17    1   31   88   53  125 .273 .354 .535  .889
 2000   35  327   43   81   17    0   14   45   59   95 .247 .362 .424  .785
 2001   36  256   46   66    8    0   16   49   45   75 .258 .369 .477  .845
Did Somebody Say Stupendous Power?
I recall making a presentation at a local SABR meeting in the early ’90s, and the question was posed to me as to whether Roger Maris’s single-season home run record would ever be threatened. I remember answering without hesitation, yes, the record would go down within the decade, and Juan Gonzalez was probably going to be the guy who would do it. I remember a few folks looking at me as though I was nuts.
Events would prove me half-nuts. The record did go down within the decade, and although Gonzalez wasn’t the guy to do it, we see here that he had the ability to get close, for sure. He was injury-prone, and a one-dimensional player, but this guy could really hit.
 Year  Age   AB    R    H   2B   3B   HR  RBI   BB   SO   BA  OBP  SLG   OPS
 1989   19   60    7    9    3    0    1    8    6   18 .154 .232 .273  .504
 1990   20   91   12   27    8    1    5   13    2   19 .296 .311 .572  .883
 1991   21  550   85  149   37    1   35  111   42  125 .271 .323 .531  .854
 1992   22  589   84  157   26    2   55  119   35  151 .267 .309 .599  .907
 1993   23  535  104  165   34    1   50  117   36  102 .308 .352 .658 1.010
 1994   24  419   53  113   17    4   17   78   28   61 .269 .314 .453  .767
 1995   25  349   53  101   19    2   24   76   16   61 .289 .320 .566  .886
 1996   26  536   82  165   31    2   43  133   41   76 .308 .357 .612  .970
 1997   27  528   80  153   23    3   38  121   30   99 .290 .329 .561  .890
 1998   28  600  101  187   47    2   41  145   42  117 .312 .357 .601  .959
 1999   29  557  105  178   34    1   35  118   47   97 .319 .372 .574  .946
 2000   30  457   64  129   28    2   20   62   29   78 .282 .326 .484  .810
 2001   31  532   97  173   34    1   35  140   41   94 .325 .373 .590  .964
 2002   32  277   38   78   21    1    8   35   17   56 .282 .323 .451  .774
 2003   33  327   49   96   17    1   24   70   14   73 .294 .323 .572  .894
 2004   34  127   17   35    4    1    5   17    9   19 .276 .326 .441  .767
 2005   35    1    0    0    0    0    0    0    0    0 .000 .000 .000  .000
How About Really Stupendous Power?
Yes, that’s right, here we see the new National League single-season home run record being set by this very entertaining fellow. He would tie the Babe, and fall just barely shy of Maris.
Mitchell never had anything close to the self-discipline generally required of a professional athlete; “conditioning” was a concept he seemed not to have been remotely acquainted with. And as to personality, the term “free spirit” seems a wan understatement. But for a few years there, Mitchell was quite something to behold with a bat in his hands.
 Year  Age   AB    R    H   2B   3B   HR  RBI   BB   SO   BA  OBP  SLG   OPS
 1984   22   14    0    3    0    0    0    1    0    3 .214 .214 .214  .428
 1985   23
 1986   24  328   51   91   22    2   12   43   33   61 .277 .343 .466  .810
 1987   25  464   68  130   20    2   22   70   48   88 .280 .348 .474  .822
 1988   26  509   65  131   27    7   24   87   49   90 .258 .323 .483  .806
 1989   27  549  109  164   37    6   60  136   88  121 .298 .395 .717 1.113
 1990   28  529   98  157   26    2   45  101   59   92 .297 .367 .609  .976
 1991   29  374   57   98   14    1   35   75   43   60 .263 .339 .583  .923
 1992   30  364   52  107   26    0   12   73   35   49 .293 .356 .461  .817
 1993   31  322   56  109   21    3   21   63   25   49 .339 .385 .618 1.004
 1994   32  307   53   98   17    1   27   71   54   58 .319 .422 .647 1.069
 1995   33
 1996   34  204   25   63   14    0    7   36   34   28 .309 .408 .485  .893
 1997   35   59    6    9    1    0    4   10    8   10 .149 .254 .350  .604
 1998   36  126   13   28    7    1    2   19    8   24 .223 .271 .335  .606
Okay, How About Really Really Stupendous Power?
Mitchell would come oh-so-close in 1989, but in 1990, Maris’s record would go down with room to spare.
They weren’t at all similar in overall skill profile, but viewed from the perspective provided by this exercise, Fielder’s career and Maris’s demonstrate some interesting similarities. Both burst forth with the record-breaking home run season at age 26. Both never again come up with a season to match it, instead rather rapidly fading; dogged by chronic injuries, both are done before age 35.
 Year  Age   AB    R    H   2B   3B   HR  RBI   BB   SO   BA  OBP  SLG   OPS
 1985   21   74    6   23    4    0    4   16    6   16 .311 .363 .527  .890
 1986   22   83    7   13    2    0    4   13    6   27 .157 .213 .325  .539
 1987   23  175   30   47    7    1   14   32   20   48 .269 .344 .560  .904
 1988   24  175   26   41    7    1   12   25   14   56 .236 .293 .482  .775
 1989
 1990   26  579  113  165   27    1   65  144   91  192 .285 .382 .674 1.056
 1991   27  630  111  169   27    0   56  145   79  159 .268 .349 .580  .929
 1992   28  599   87  150   24    0   45  135   74  159 .251 .333 .515  .848
 1993   29  572   79  152   24    0   33  116   88  129 .265 .364 .479  .843
 1994   30  422   62  107   15    2   25   83   46  102 .253 .327 .479  .806
 1995   31  490   65  116   17    1   28   76   69  108 .237 .331 .448  .780
 1996   32  587   78  145   19    0   35  108   80  129 .247 .337 .459  .796
 1997   33  358   37   91   14    0   12   56   47   81 .255 .341 .393  .734
 1998   34  413   45   94   16    1   15   63   49  103 .228 .309 .384  .693
Next Time
We’ll look at an even better list of the period’s players than this. Will Fielder’s record stand up?
References & Resources
A Pitcher’s Story: Innings with David Cone, by Roger Angell (New York: Warner Books, 2001).
In order to modify the actual stats into a shape fitting this smoothed line:
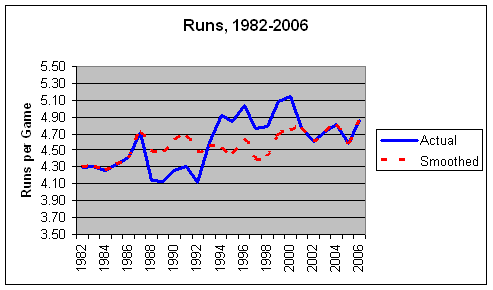
We used an approach similar to the approach we used in several past such exercises, beginning with the overall aggregate rate of the primary offensive events for the entire 1982-2006 period: runs, hits, doubles, triples, home runs, walks, and strikeouts. We then adjusted the rates for each season from 1988-1992 to bring the aggregate total for that period to equal that of 1982-2006, also for 1993, and also for 1994-2000. The specific multipliers employed are:
1988-92:
Runs: 1.087
Hits: 1.035
Doubles: 1.095
Triples: 1.012
Home Runs: 1.281
Walks: 1.011
Strikeouts: 1.056
1993:
Runs: 0.992
Hits: 0.992
Doubles: 1.023
Triples: 1.002
Home Runs: 1.097
Walks: 0.982
Strikeouts: 1.028
1994-2000:
Runs: 0.923
Hits: 0.971
Doubles: 0.943
Triples: 1.053
Home Runs: 0.906
Walks: 0.919
Strikeouts: 0.928
An impact of a change in the rate of hits is a change in at-bats, of course. I use a simple method to change at-bats: every batter’s at-bats are increased or decreased by his number of increased or decreased hits. Outs are constant, of course, and I assume as well a constant rate of double plays and baserunning outs—probably not exactly proper assumptions, but close enough for our purposes.