Staggered Rotations and Postseason Win Probabilities
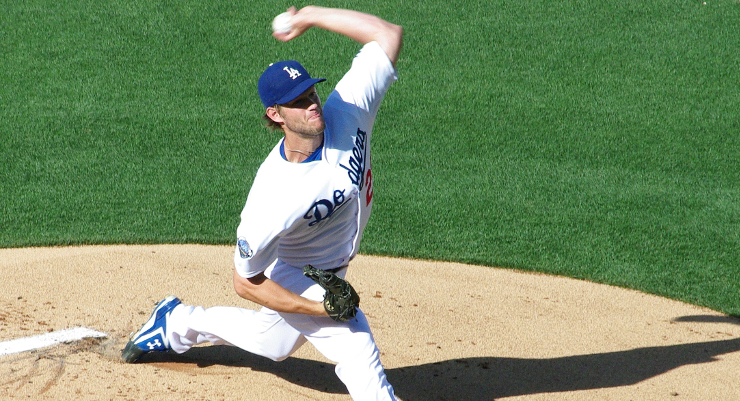
Teams could “punt” against Clayton Kershaw, but would it increase their odds enough? (via Ron Reiring)
It’s that time of year. The brackets for the Division Series are set, and all eyes are focused on October baseball. As the regular season wrapped up, teams that clinched early had the luxury of manipulating their starters’ last few games to set their playoff rotations as they pleased. This postseason, you will inevitably hear something like “The team that wins Game One goes on to win the series X percent of the time” over and over again. This is why, whenever possible, the team’s best starter usually starts Game One.
But what if a team staggered its rotation? If a team were willing, it could punt Game One against the other team’s ace and then have the upper hand for the rest of the series by putting its ace against the other team’s No. 2. By opening the series with the No. 4 starter, the team would all but concede Game One, but then would have the pitching advantage through Games Two, Three and Four! All else being equal, this could work and makes some logical sense. Who wouldn’t trade Game One for the following three?
In April of 2013, Dan Lependorf wrote a season preview piece here at The Hardball Times in which he crunched the numbers in the context of the regular season. Using the Pythagorean win formula and ERA+, he found that in a world where a team could perfectly align its rotation with such a stagger, an average team could snag a .503 winning percentage, adding about half a game every year. Just half a game under perfect conditions doesn’t seem like enough. Lependorf then dove into the actual data and found that, in practice, with the complications of real life, this would yield a negative two-percent swing in win probability.
So it doesn’t work. Should we give up hope? What about the postseason, when a playoff series has a few things going for it that could make this work?
Staggered rotations would work quite differently in the playoffs, and these differences potentially could rectify the issues with this strategy over a 162-game season. For one, we need not worry about off days or injuries in a playoff series. There are just two teams on the same schedule receiving the same off days. Except for cases in which a team decides to use a three-man rotation instead of the standard four-man setup, the match-ups usually align perfectly, with each starter facing his counterpart.
Another reason it could work in a playoff series is that playoff teams’ rotations look different from regular rotations. Playoff teams could have balanced rotations with above- average starters one through four. Others could have a top-heavy rotation with an MVP caliber ace, a solid two, and average to fringe three and four starters. In the context of the postseason, we can make different assumptions about what a team’s rotation looks like in terms of ERA- that will affect our estimated pythagorean win probabilities.
The final wrinkle that may or may not help this cause is the variable series length. We are not talking about how this works for a simple turn through the rotation. In a playoff series, a team may never get to that fifth game in a five-game series or the sixth and seventh games of a seven-game series.
Let us start crunching some numbers. The basis of our answer will rely on the ERA- of each team’s pitchers. ERA- is easily interpreted as the percent of league average, adjusted for park and league, with lower being better. For example, Clayton Kershaw has an otherworldly ERA- of just 50 this season. This means he was 50 percent better than league average (100-50=50 percent).
From ERA-, we can extrapolate run expectancy and win expectancy. This works out such that, if we have a league-average pitcher with ERA- of 100 facing Kershaw and his ERA- of 50, the Dodgers have a win expectancy of 78 percent. (Clayton Kershaw is really good.) For all these calculations, we will have to assume league-average offense. In this framework, we can look at how different rotation orders affect win expectancy in each game of a series.
Let us look at a couple of generic teams. Team A and Team B both have an ace with ERA- of 75, a number two with an ERA- of 85, and a three and four with ERA- values of 100 and 110. Unsurprisingly, the win expectancy for each game if the teams didn’t stagger their rotation is 50 percent. However, if one of these otherwise equal teams did stagger its rotation, we get something like this.
| Hypothetical Staggered Rotation Results |
|---|
| Game(s) | Team A | Team B | Team B Win % |
| Game 1/5 | 75 | 110 | 33.20% |
| Game 2/6 | 85 | 75 | 55.70% |
| Game 3/7 | 100 | 85 | 57.40% |
| Game 4 | 110 | 100 | 54.30% |
With these identical pitchers, the staggering team gains an average advantage of 0.1 percent over the course of the four games. This result is not very different from what Lependorf found over the course of one turn through a five-man rotation. As I mentioned before, because this is the playoffs, we can make different assumptions about teams’ rotations. After all, Kershaw’s ERA- of 50 blows away the ace in this example.
Suppose the small-market Athletics faced the free-spending Dodgers in the World Series. How would the Dodgers’ top-heavy rotation fare against the more balanced A’s rotation? Given each team’s top four starters through the first four games, the Dodgers would have an average win expectancy of 53.6 percent. The game-by-game breakdown looks like this:
| Dodgers vs. A’s, hypothetical traditional starting rotation |
|---|
| Game | Dodgers (ERA-) | Athletics (ERA-) | A’s Win % |
| Game 1 | Kershaw (50) | Samardzija (81) | 29.30% |
| Game 2 | Grienke (78) | Lester (86) | 45.50% |
| Game 3 | Ryu (96) | Gray (92) | 51.90% |
| Game 4 | Haren (115) | Kazmir (95) | 58.70% |
Could the A’s tilt things in their favor by punting Game One against Kershaw and taking the advantage the rest of the way? Even Jeff Samardzija, who owns an ERA- of 81, would only get the A’s a win 29.3 percent of the time against Kershaw. When Scott Kazmir, the A’s No. 4 starter, faces Kershaw, the A’s win 23.6 percent of the time, only a 5.7 percent swing. It seems like the A’s could get more out of their ace. Could this difference be made up with the advantage in Games Two, Three and Four?
| Dodgers vs. A’s, hypothetical staggered starting rotations |
|---|
| Game | Dodgers (ERA-) | Athletics (ERA-) | A’s Win % | Difference |
| Game 1 | Kershaw (50) | Kazmir (95) | 23.60% | -5.70% |
| Game 2 | Grienke(78) | Samardzija (81) | 48.30% | 2.70% |
| Game 3 | Ryu (96) | Lester (86) | 55.00% | 3.10% |
| Game 4 | Haren (115) | Gray (92) | 60.10% | 1.40% |
The A’s punt 5.7 percent of win probability in Game One but pick up 7.2 percent over the next three games, coming out to an average win probability-added boost of 0.3 percent per game. This is more than the theoretic model we previously looked at, but sadly, the A’s could not have picked up much by staggering their rotation.
Further, the chances of their getting to another game in which they have the advantage, Game Six or Game Seven, would have been cut dramatically. If the teams were split at two games apiece after Game Four, the series likely would be cut short before the staggering team got to realize the full benefits of the stagger the second time through the rotation.
Without looking further at how the “if necessary” games are affected, we can confirm that Lependorf’s conclusion applies to the postseason, as well. The reason for this is that there simply is not enough variation among starters. Having an extremely good pitcher like Kershaw gets us a little bit closer, but not nearly where we would need to be to see a significant effect.
If we study another two pairs of imaginary teams, this becomes clear. Imagine two teams with very little variation in the ability of their starters, their four playoff starters having ERA- marks of 95, 97.5 102.5, and 105. The staggering team has an average win probability of 50.003 percent, which is miniscule.
Now imagine a pair of teams with extreme variation in their starters. Their four playoff starters have ERA- scores of 40, 80, 120, and 160. In this case, the staggering team has an average win probability of 54.0 percent. Now we’re talking.
This benefit is due to the exponential nature of the Pythagorean win formula. If we used 2.0 as an exponent instead of 1.83, the advantage in the extreme scenario is up to 54.7 percent. To get any kind of significant advantage in a series from staggering starters, there would need to be a nearly impossible amount of variation between starters. Could it work in a theoretical vacuum? Maybe. Should anyone try it this year? No.
References & Resources
- Dan Lependorf, The Hardball Times, “On Rotation Order and Win Probabilities”
- All ERA- data from FanGraphs
- Team winning percentages were calculated using the Pythagorean win formula. For example, Team A’s winning percentage is calculated as:
Run Ratio = (Team A ERA-)/(Team B ERA-)
Team A Winning Percentage = (1/(1+(Run Ratio ^1.83)))
I was thinking about this exact thing just the other day. I also incorporated the offense’s wRC+, wRC+ splits vs. L/R, defense, baserunning, park factor, starters’ avg IP & bullpen ERA-. Then made an absorbing Markov chain to turn the game-by-game winning probabilities into a series-winning probability. Here’s some R code https://github.com/CodyStumpo/MLB-Playoff-Series
Why are you just adding win probabilities? What you should be doing is running a full analysis to see who wins the series. Taking these win probabilities and assuming the chances in games 5-7 are the same as 1-3, it looks like the A’s chances of winning go up 0.42% with a staggered rotation (from 38.06% to 38.48%). A simple spreadsheet is here.
Did you factor bullpen usage in? If you apply the starter’s ERA- to the whole game you would be overstating their effect.
This is trying to look at the effects of a staggered rotation. If you add an average bullpen into the mix, it won’t make much difference with a model.
If you add bullpens into the Dodger-A’s example, then yeah, that could make a difference, but then you should also add in the lineup differences as well as the bench differences, if you are going to go there.
Of course, the follow-up question is what is the winning percentage of post-season teams that don’t “punt” against, say, a Clayton Kershaw and instead touch him for 7 earned runs?
Very interesting analysis, nice job!
I’ve often wondered about this in the context of the regular season. Interesting to see that, much like fiddling with the lineup, fiddling with the rotation does not seem to matter much, ultimately, some small gains here and there, but nothing game changing, particularly in the context of a short series.
I would also concur that this strategem might not work in the context of a best of series, particularly in a 5 game series where each win or loss swings the probabilities of winning the series widely. I was thinking about a 5 game series recently, after the Giants won that 18 inning game, and came to the conclusion that every game is a must win for both teams. For if you lose the first game, the series is now a win 3 of 4 series, which is pretty tough to do against another winning team (though obviously doable, as history shows :^). But even if you win the first game, if you lose the second, you are back to even, so that is must win for them as well, to avoid that scenario. So you must play each game as if it were the Wild Card elimination game.
I’d think the way to do this would be use your 4th and 5th starters in game one, ideally a LHP and a RHP, and let them each go once through the lineup. They can go max-effort for 2-3 innings, and presumably the second one in either has a L/R split advantage, or you force the opposing manager to go through his pinch hitters and defensive replacements much earlier than he might have preferred.
The “all hands on deck” approach in game one against a stud ace would close the gap a bit.
Or, you know, you could just torch Kershaw for 7. 😉