The Compassionate Umpire
The strike zone, as defined by the rule book, is supposed to be a constant of nature, like the speed of light or the boiling temperature of water. Well you know what? Don’t you believe it! The strike zone, the size of it, is changing continuously, it gets bigger or smaller after nearly every pitch. Several questions come to mind: How? Why? Are you drunk?
Let’s not get into the last of those, but I can tell you why: because major league umpires are a compassionate bunch of guys. They can’t help pulling for the underdog. I’m convinced that they don’t do it in purpose, but they do it—they can’t escape their sympathetic nature. They seemingly cannot avoid giving the batter a little helping hand when he finds himself down in the count, 0-2. But our boys in blue are not biased against pitchers, oh no. They are more than willing to come to the aid of a pitcher who has just thrown three straight balls. Ever see a Little League game where an 8-year-old pitcher is having a hell of a time throwing a strike? Does the ump call like 20 balls in a row? Of course not, anything remotely close is going to be called a strike. Well, it’s the same in the big leagues, to a lesser degree, of course.
Measuring the strike zone
So, in order to see this vacillating, capricious, fickle strike zone, we need to have some way to measure its size. A long time ago, I did some strike zone analysis, but those were the heady days of the advent of Pitch f/x: There wasn’t very much data to analyze. I did the best I could, but now we can do a lot better. Here’s how I measure the size of the strike zone.*
*I realize that some (most?) of you couldn’t care less how I measure the strike zone. Feel free to skip down to the next section. I won’t take it personally. Well, maybe a little.
First, I divide the strike zone and the surrounding area into a matrix of bins, or buckets. A bin is nothing more than a little box that defines a pitch location. Then, using the PItch f/x data, I gather location information on a large number of called pitches, by which I mean either balls or called strikes. I put each called pitch in its box. Next I select all the called strikes and put them in their respective boxes. Finally, within each box, I divide the number of called strikes by the total number of called pitches, giving the fraction of called strikes, or the called strike percentage for each bin. Got all that? Doesn’t matter, here’s a picture:
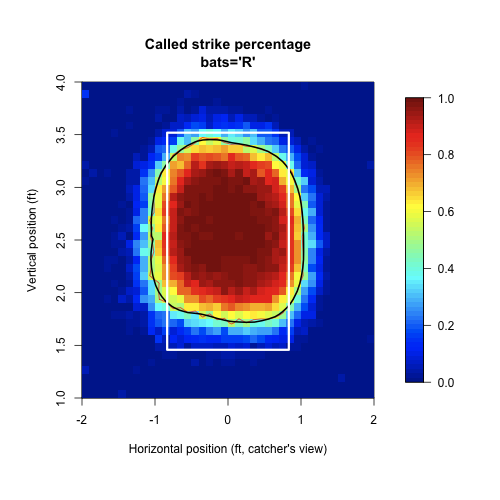
Here we see the area surrounding the strike zone, as seen from the catcher’s perspective. I used 200,000 pitches to right-handed* batters to make this plot. The color of each bin tells you the called strike percentage for that location—brown down the middle (strike percentage 100 percent) and deep blue well outside the zone (strike percentage near zero percent).
*There is a good reason why it’s important to work only with right-handed or left-handed batters, but not both together. But I will have to discuss it another time, since it has nothing to do with today’s topic.
It’s clear from the graph that pitches in certain areas within the rule book zone (shown by the white box), especially in the lower and upper portions of the zone, are being called balls, while pitches in other areas that are outside the rule book zone are being called mostly strikes. Everybody complains about the umps not calling the high strike, but they don’t call the low strike either.
I want to measure the size of the strike zone at it’s actually called, but first I have to define that. It’s obvious from the graph that there isn’t a sharp cut-off where pitches go from being strikes to being balls. There is a more of a gradual shift from strikes to balls. In some bins a pitch is equally likely to be called a ball or a strike, the 50 percent bins. If you identify the 50 percent bins and draw a line connecting them, you get the black contour line shown in the graph. That’s the true strike zone, as called by the umps. The size of the strike zone, then, is just the area inside the contour—in this case 3.09 square feet.
Effect of the ball-strike count
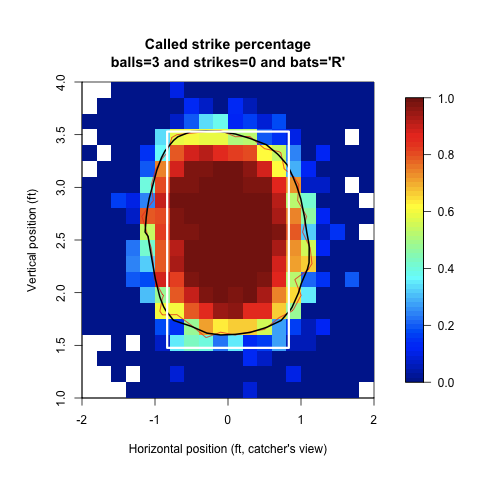
OK, now that I’ve got this new strike zone measuring toy, I thought I’d have a look at whether the size of the zone depends on the count. I think most of us have the intuition that on a 3-0 pitch, umpires will tend to call “anything close” a strike. Conversely, I have the notion (which turns out to be true) that when the hitter is in a deep hole, and 0-2 count, the umpires get picky on calling that third strike. Below you see the strike zone graphic separately for pitches thrown at 3-0 and 0-2, respectively.
 |
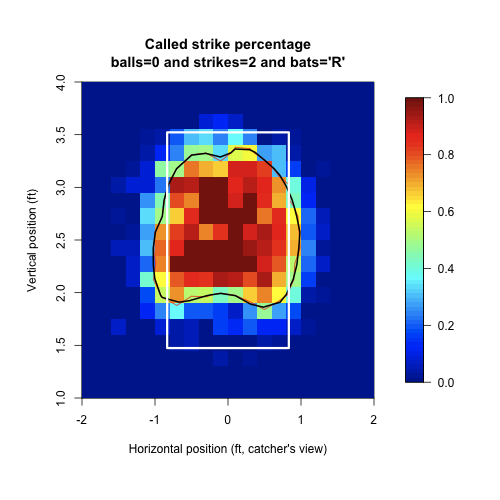 |
These graphs are not as pretty as the previous one because far fewer pitches go into them. I had to enlarge the bin size and there are more statistical fluctuations in each bin. Nevertheless, we can still see the large difference in the two strike zones. Here are the numbers:
Count    Strike zone size (sq. ft.)
-----------------------------------
All          3.09
3-0          3.52
0-2          2.42
Wow, the 3-0 zone is nearly 50 percent larger than the 0-2 zone. It’s even more striking if you overlay the two zones, like this:
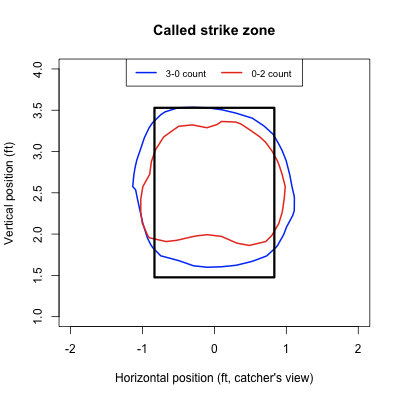
It’s as clear as day: These umpires are a bunch of softies. They see a pitcher struggling to put the ball over and they go all Gandhi on us, giving the pitcher an an extra chunk of strike zone to work with when the count reaches 3-0.
And when the batter becomes the underdog, when the count goes to 0-2? Why, the hearts of our merciful arbiters simply turn to mush: They can’t help pulling for the poor batter as he chokes up on the bat, hoping to make some kind of contact. Who knew the umps were such empathetic characters?
I have always assumed that the umps call a different strike zone based on count only on the extreme pitchers’ and hitters’ counts. Sure, we see a big difference between 3-0 and 0-2, but the strike zone is more or less constant for the other counts, yes? Well, no.
I’m going to show a plot of strike zone area vs. ball-strike count, but before I do that (no looking ahead!) I need to quantify how much each count favors the hitter or pitcher. Actually, it turns out that you can assign a run value to each count, so a 3-0 count is worth .22 runs to the batter, while an 0-2 count is worth about -.11 runs. I worked out these values in a THT article on pitch values. See that article for how these run values are determined, or have a look in the Resources section below if you want to see the actual values.
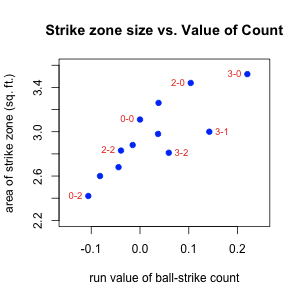
Knowing the value of each count is useful, because now I can plot the size of the strike zone vs. the run value. For low run values, where the hitter is at a disadvantage, we might expect the umps to shrink the strike zone. Conversely, at high run values, where the pitcher is struggling, we expect the strike zone to grow in size. Indeed, this is what we saw in the two extreme cases. The plot, which shows the size of the strike zone for all counts, is shown here on the right.
Each point represents a different ball-strike count (some of them are labeled). On the horizontal axis the run value of the count is shown, e.g. you can see that 0-2 is worth a little less than -0.1 runs, as I mentioned above. The vertical axis shows the area of the strike zone, using the 50 percent contour as describe above.

Interestingly, we see a very strong correlation between strike zone size and the run value of the count.* So, umps are (sub-consciously, to be sure) making small adjustments to the size of the strike zone depending on the count. And they are doing it in such a way as to help the underdog of the moment in the batter/pitcher matchup.
*You’ll notice that the 3-2 count and, to a lesser degree, the 3-1 count do not follow the overall trend so well. I don’t have a good reason for that, maybe the ump, after being generous with a called strike on 3-0, is less inclined to help out on 3-1? Possibly, but maybe it’s just statistical scatter in the strike zone measurement.
Final comment
Here’s a secret: All this is not exactly ground-breaking research—we already knew that the size of the strike zone varies with count. THT contributor Jon Hale, among others, has looked at variations in the strike zone due to ball-strike count.
But I’d like to give a special shout-out to Dave Allen, who writes for Baseball Analysts and FanGraphs. Dave has been doing all kinds of great work using the Pitch f/x data, including work on the strike zone*. I’ve also been very envious of his graphics for some time and I finally got around to learning how to produce these “heat maps” graphics, with help from a tutorial that Dave gave at the Pitch-FX Summit last year. So, thanks for that, Dave.
*If you read Dave’s article on the strike zone (and you definitely should), you’ll notice that his values for the area come out somewhat different than mine. We both find the same general trends, but Dave’s numbers come out a little smaller. I suspect we are defining our strike zone slightly differently.
References & Resources
Here is a table of the run values of ball-strike counts, taken directly from my previous article, “Searching for the game’s best pitch“.
+-------+-------------+
| Count | Run value   |
+-------+-------------+
| 0-0   |       0.000 |
| 1-0   |       0.038 |
| 2-0   |       0.104 |
| 3-0   |       0.220 |
| 0-1   |      -0.044 |
| 1-1   |      -0.015 |
| 2-1   |       0.037 |
| 3-1   |       0.142 |
| 0-2   |      -0.106 |
| 1-2   |      -0.082 |
| 2-2   |      -0.039 |
| 3-2   |       0.059 |
+-------+-------------+
Studes/
Very good observation. The 2-1 point is, as you suspect, the one directly to the left of the 3-1 point. I’m not sure how to interpret that, frankly. I might have thought just the opposite: that when a walk was imminent (3-ball count), the umps would expand the strike zone even more.
This is great stuff, and its implications go well beyond baseball. I’d love to see what someone doing research in neuropsychology and evolutionary psychology, perhaps working particularly on such things as perception, decision making, and altruism/morality, could do with the data you guys are gathering.
John, I’ll post here the comments that I emailed to you earlier.
In the comments to Dave Allen’s strike zone article at Baseball Analysts, MGL mentioned the following idea:
“Another explanation for the smaller strike zone as the number of strikes increases is this (other than the umpire making a conscious decision to change his zone with the count):
When a batter takes a pitch with more strikes, he tends to be fooled by the pitch, either because he was expecting something other than what he got, or because of the pitch itself (a very big breaking curve, for example). The umpire will tend to be fooled as well. And of course, if a batter takes a borderline pitch with, say, an 0-2 count, the umpire often thinks, ‘It must have been a ball for the batter to take that pitch with 2 strikes…’”
I think that MGL is onto something there. If you look at the deviations between the actual strike zone area and the strike zone area expected based on the run value of the count, most of the difference can be explained by the out-of-zone swing rate by the batter. I’m not sure if that makes sense, so I’ll try to say it another way: you can very accurately predict the area of the actual called strike zone based upon two variables: the run value of the ball-strike count, and the out-of-zone swing rate by batters at that count.
The one exception to this explanation is the 3-0 count, where it appears the umpires really do purposely give a bigger strike zone. Of course, the out-of-zone and in-zone swing rates are both extremely low at 3-0, 5% and 10% respectively, so I guess it’s not surprising that OOZ swing rates are irrelevant at that count.
—————
I thought MGL’s proposed explanation was plausible: that if the pitch was such that it fooled the batter, it’s more likely to also fool the umpire. The umpire also is influenced by the batter’s actions. If the batter thought it was a ball, the umpire thinks that maybe he should think it was a ball, too.
By the way, I’ve observed examples at the extreme that tend to confirm this second idea. Most of the “obvious” errors of called balls on pitches down the middle of the zone that are recorded by PITCHf/x come from two sources. One is what you might expect—the MLBAM stringer simply made the wrong notation and denoted as a ball in the software what the umpire actually called a strike. But the other was surprising to me. Umpires have a tendency to call balls on pitches down the middle when the batter starts to offer at the pitch but checks his swing.
The out-of-zone swing rate tells you the batter’s bias on what to do with those borderline (tough-to-call) pitches. If he tends to swing at a lot of them, that leaves less of such pitches for the umpire to call strikes or balls. He’s presumably swinging at the pitches within that population that are more likely to be called strikes, so the borderline pitches that are not swung at are likely to be balls. Low out-of-zone swing rate thus leads to the umpire calling more balls.
It’s a case of selection bias. The borderline pitches that an umpire gets to call are a not a random sample of pitches in that location—they are those that the batter has chosen not to swing at. In addition, it’s very plausible that even if the sample of called pitches was representative of the whole population thrown to that location, the umpire may be explicitly influenced to agree with the batter’s actions. Anecdotally, we hear that umpires are influenced in their calls by the catcher moving the glove, so it’s probably not that brave to think he might also be influenced by what the batter does.
Mike/
Thanks much for posting your comments here. I had hoped to expand the article a little, adding in your take, but ran out of time.
I think your idea is very plausible and should be verifiable with the pfx data. Another thing to add to the To-Do list! Thanks again.
Btw, I meant to say so in my earlier comment, but this is a great article, John. I always look forward very much to your research pieces.
Question: I’m sure someone’s covered this before and I missed it, but does the strike zone also vary by pitch type? If so, could the fact that breaking balls are more likely to be thrown in 0-2 counts and fastballs are more likely to be thrown in 3-0 counts be a factor in strike zone size?
Patrick, my thoughts exactly.
Isolating fastballs would remove the “fooled everyone” explanation. Even if the hitter was fooled that wouldn’t explain a smaller 0-2 zone from the umpire.
The rulebook strike zone varies with batter height. Does that actually have any effect on the strike zone the umpires call?
And does your data control for that at all?
John,
The strike zone seems kind of small, vertically. For example, at 0-2, it’s, what, 20 wide x 17.5 high? Even at 3-0, it’s what, 24 wide x 20 high?
I never thought of the strike zone as being rectangular where the long side is the horizontal.
“The strike zone, as defined by the rule book, is supposed to be a constant of nature, like the speed of light or the boiling temperature of water.”
But the boiling point of water isn’t constant. In fact, you missed a golden opportunity to draw a parallel between how the strike zone and the boiling point of water both change under pressure.
It has nothing to do with compassion, or being a hard___, like Neyer says.
It has everything to do with umpires being lazy, and anticipating what is going to happen.
If it’s 3-0, the ump expects the pitcher to groove one, and he expects the batter not to swing. He already has his finger on the strike button of his counter. If the pitch faintly resembles what he expected, he says strike.
If it’s 0-2, he expects a waste pitch, so he’s got his finger on the ball button. If it’s even remotely close, he expects a swing. If there’s no swing, he reasons, there’s a good chance it was not a strike. Ball 1.
Wouldn’t looking at this issue be a way of potentially speeding up the game? If the umpires are moving each count closer to even, it would result in extended at bats. Obviously calling a strike on 3-0 would lengthen the at bat but also give the pitcher more of a chance to get the batter out. Don’t know how much the cumulative effect of this is, but would guess that reversing this inconsistency would have a positive effect on shortening that game by some amount.
Right, you absolutely must control for or break this down by pitch type. A curve ball in the strike zone is much more likely to be called a ball than a fastball in the zone. In fact, in the old days, umpires would almost never (a little exaggeration here) call a curve ball for a strike. The reason being was that if it ended up in the zone when the catcher caught it, it was likely too high when it went past the batter, and if it was a strike when it went by the batter the catcher would catch it just off the ground. In either case, the umpire did not like to call it a strike. I say “in the old days” because since the strike zone was raised a little, umpires are more likely to call that “high” curve ball a strike.
I would love to see what umps are the most consistent in the 0-2 and 3-0 counts and what ones are the least consistent.
Lots of good comments.
Regarding pitch type: I realized that most 3-0 pitches will be fastballs and that a high proportion of 0-2 pitches will be breaking balls. I did have a quick look at pitch type and I did not find a big effect. I hope to have something on that in a future article.
On the vertical extent of the strike zone: I was lazy this time and took the average upper and lower limits of the zone, averaged over the hitters in the sample. That’s an approximation that can be avoided with a little effort (as I did in my previous strike zone work).
battlekow: excellent observation. The boiling point does indeed vary with pressure and you made a nice pun out of it. Nice! (wish I’d thought of it.)
BTW, I was only half-serious about the umps being compassionate. I don’t think they change the strike zone on purpose, at all. I think this is all going on in the subconscious.
Did anyone else catch the last research presentation at Dorkapalooza? Tobias Moskowitz presented similar research (as well as some in other sports like basketball and soccer) to demonstrate that the psychological principle of “omission bias” works on umpires, too. Basically, people tend to think that omission of an action implies less responsibility for outcome than comission of an act (e.g. “withholding the truth” is better than “telling a lie”). In the case of umpires, not calling a “close” ball in a 3-0 is seen as somehow contributing less to the outcome of the at bat than calling it correctly, thereby ending the at-bat. This effect is even more pronounced for stars and in late-game situations. He said he and L. Jon Wertheim are working on a book that contains this stuff…
Nice job building on other work, John. I love the run value graph, but I particularly love that you have learned heat maps!
When I look at the run value graph, it seems to me that whenever a count reaches three balls, the line moves to the right. IOW, the ump doesn’t really change his approach between two balls and three balls. Both 3-2 and 3-0 are virtually parallel from 2-2 and 2-0, respectively. Where is 2-1 on the graph?
Maybe you think they’re compassionate, but I think they just suck at their jobs.
One day there will be robots doing this work and the game will be better off.
And every time I see something like this, I continue to wonder why there is instant replay for boundary calls, yet no one seems to care that the strike zone, which could easily be arbitrated electronically in real time, is all kinds of f’ed. Far more outcomes are dependent upon arbitrary strike zone judgments than any boundary call, or safe/out call, for that matter.
Regarding baserunning plays, the dynamic is entirely different. Knowing some minor league umps in the area, I can tell you they rely on likely outcomes more than actual outcomes.
The “bang-bang” at first is simply determined by listening to the ball hit the glove while watching for the batter’s feet at the bag. Sound of “thump” in the glove before visual confirmation of foot on bag = out. And that’s actually very reliable. Other baserunning plays are quite different as a tag is necessary. They have to listen for a ball in glove sound while keeping an eye on the runner’s hands/feet, then quickly scan to the fielder’s glove position relative to the batter, i.e. looking for the tag, and then determine if the runner likely touched the bag prior to the tag; this based on the preceding view of the runner’s position before the ump took their eyes away for a second. Throw in varied positioning by the umps based on where the variables (ball, fielder, runner) are, and obviously there’s some guesswork at play.
The guy calling the strikes, I believe, is really the only one where there’s a great deal of room for judgement errors involving the subconcious or whatever. They only have to rely on the visual and see so many “samples” relative to the other umps/line judges that they have little excuse for being inconsistent.
One ump I know chalks up inconsistent umpiring, whether calling strikes or runners safe, to positioning. The best ones focus a great deal on establishing the best viewing angle and can keep focus throughout the game. Most umps can’t do this for 9+ innings or for several months on end. And even though only the best get picked for MLB work, the sweet spot for the career is relatively small. They first come up and are rookies and make rookie mistakes; they get a few years in, are established and get sloppy because their job is more or less secure. Only a couple years or so in the middle when they’re really serious about it. So I say grant no one tenure! Make ‘em sweat it out every year and the umps will focus more on sharpening their skills, perhaps.
MGL is dead-on. In the Moskowitz study, in counts where an at-bat ending decision is unavoidable (full count), the strike zone reverts to roughly the same dimensions as first pitch. Umpires aren’t averse to making a decision; they would just rather have one of the players determine the outcome of the at-bat whenever possible. The same effect is seen in basketball, where the number of “judgement” calls (traveling, carry, touch fouls) decline as the game nears its end, whereas “necessary” calls like out-of-bounds or shot-clock violation remain constant. Same in hockey with major penalties vs offsides, etc.
“Meaning, a bang-bang play at first goes to the team that is behind. More checked-swing strikes called against a team with a lead.”
No! Is is (apparently) not about conceding a decision to the person or team that is behind in the competition. It is about abdicating responsibility for an ultimate decision or at least the perception of such. A bang-bang play at first whether it is called safe or out, essentially ends the play, so there is no way to abdicate responsibility for the outcome. A checked swing decision by an umpires is the same as a called strike or ball, so presumably we WOULD see some bias in that as well, but not in favor of the team that is behind in the game.
I hope you’ll study the size of the zone by pitch type.
The most importantly factor, IMO, is the speed of the game and the situation. Early in the game, the umps want to move things along. Who knows how long they’ll be out there or how many innings it’ll go? So the zone is large in the early innings.
Later on, if the game has gone rapidly AND the score is close or even just a low scoring game, they’ll TRY to be accurate. Maybe they’ll even tighten up the zone a bit to give the customers more runs….force the pitcher to grove it in order to get a strike.
Another factor is weather. Whether it’s really hot and muggy, or bitingly cold and windy, they want a fast game; ergo large zone. Nice weather…they can tighten up the zone to produce more runs and a longer ball game.
But the key factor, I think, is the speed of the game. Umps don’t really want to be out there for a 4.5 hour marathon.
Umps MAY have a heart but primarily they’re just looking out for number one – at least at the major league level.
The umpire is rarely fooled by the pitch. He doesn’t have to make a decision to swing/not swing. He tracks the ball into the glove and makes a determination based on his tracking. Unfortunately it’s a case of human “error” (subliminal or intentional) that causes the umpire to be reluctant to bang out a 3rd strike call unless it’s a really good pitch. And, the same reasoning gives the pitcher the benefit of the doubt on 3-0.
John:
Great article. I think an alternative (or additional) explanation for the pattern is the simple probability of a strike being thrown. To some extent, umpires see — as we all do — what we expect to see. So I’d like to see the same chart, but with run value of each count replaced by freqency of pitch in the strike zone (using a constant strikezone definition). My guess is the relationship is just as strong. Then we have to try to figure out if the ump is being influenced by his expectation, or an unconscious desire to keep the PA going. Will be hard to separate the two….
The more I think about it the more this is disturbing me.
Does the same trend potentially hold true in a larger sense? Meaning, a bang-bang play at first goes to the team that is behind. More checked-swing strikes called against a team with a lead.
I believe this is unintentional/subconscious. Still doesn’t make it acceptable (once brought into the open).
Another possibility is that the MLB powers-that-be encourage bat-on-ball contact to determine the outcome of games… or that the umps don’t want to be final arbiters of most plate appearances.
The extension of at-bats in this manner may be interpreted as a desire not “swallow the whistle” like NBA refs do at the end of games.
It may not just have to do with unconscious empathy… it could be a very conscious decision.
Good point above by Joe Minnich. Basketball refs never want a call by them to decide the game—so instead they let non-calls decide the game. You see this all the time—they stop calling many fouls in the last five minutes.
Another basketball bias issue you see all the time is when one team gets significantly behind. They stop calling fouls on the losing team and call more on the winning team. This definitely keeps the game from getting boring.
There’s also home team bias, star player bias, etc. If there’s a rebound, woe to the benchwarmer guarding the starter. Benchwarmers are like cannon fodder. I’ve been to games with a friend who has season tickets and he will point to someone who just checked in and say, they’re going to call a foul on him, and a minute later they do.
I’m sure you could easily document a huge reluctance to call a foul that would make an important player foul out. That effect is probably most like the 3-0 and 0-2 situations in baseball.
Another basketball bias I hate is when a team has a reputation for a “physical” style of play, which just means they foul so frequently that if you called them all the game wouldn’t last a half. Ref’s tend to defer to the “style” of the team and let “physical” play go. So you get teams like Michigan State, whose coach brags that they practice in football pads, and yet nobody fouls out. They come out bruised and bloody, but that’s just their style of play.
That’s one reason I’m a baseball fan. Other than the strike zone, there’s much less judgment involved. I like basketball, but it’s too much about the refs.
The strike zone is a 3D volume, not a 2D area. Most (all?) of the discussion above seems to ignore this.
For example, a pitch can nick the outer or inner front corner of the zone while traveling at an angle away from the (pitcher-home) edges, and be caught by the catcher fairly far “beyond” the outer or inner edge (i.e. “way inside” or “way outside”). Besides being really difficult to judge accurately in 3D, I wonder how this fact pollutes the (apparently 2D) data set you are working from?
Considering the strike zone as a 3-D volume makes a very miniscule difference. For very few pitches does it make more than half an inch of difference. I doubt it would change any of the conclusions in John’s article.
Great article, and great comments too.
Something to consider: run value may not be the best indicator for how umps perceive the count. In a perfect world, they would understand run value. But the simple fact that we have to calculate run value means that it is not an obvious concept to many people. And even for those to whom the concept is clear, we still need to reference a table to know the exact run values of each count.
Basically what I am getting is that umps probably don’t know the run values. And if they don’t know the run values, then comparing zone size to run value will not give the clearest picture.
I don’t know what the alternative measure would be. Any thoughts?
Wow. Great work, the difference in the size of the strike zone between 3-0 and 0-2 really is amazing. However, I don’t know if this difference is due to the umpires being “compassionate” towards the pitchers and batters. I think it more reflects a situational bias. If the count is 3-0, the umpire is expecting the pitcher to throw something hittable and over the plate. So if the pitcher actually misses a little, the ump is still biased towards making the strike call. Likewise, if the count is 0-2 the ump is expecting something out of the zone to try to get the hitter to chase it, and if the pitch actually does grab a piece of the strike zone, the ump will still be more likely to call it a ball than if the same pitch was thrown on 3-0. I don’t think the umpire is compassionate towards any of the players, with the amount of crap they get from them during the games.