The Expanded Strike Zone: It’s Baaaack…
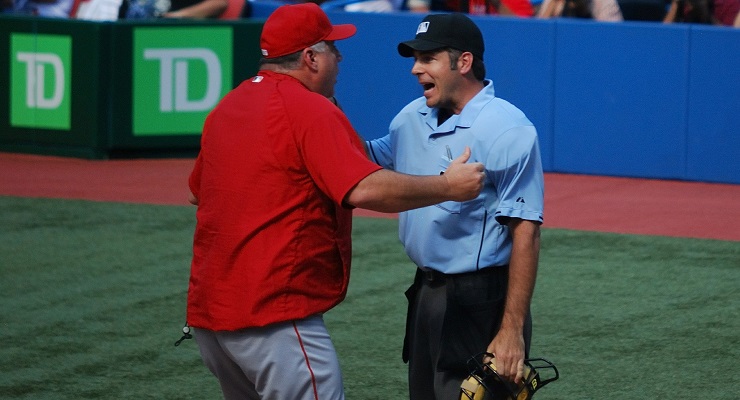
The expanded strike zone is making an unwelcome (to some) comeback. (via James G)
The changing of the guard at the MLB Office of the Commissioner prior to this season has prompted an openness to make adjustments to the game with an eye toward improving fan experience. Run scoring has been relatively depressed in recent seasons, with an expanding strike zone being one of the major culprits. There is an argument to be made that fans would prefer to see more runs scored, and so the league’s Competition Committee is monitoring the strike zone in 2015 for this reason.
When I checked in on the strike zone after just the first weeks of this season, its overall size was noticeably smaller than last year. In addition, while the bottom of the strike zone was as robust as it was during the initial weeks of the 2014 season, there was still room for it to grow to reach the level where it settled by the end the year.
Now two months into the season, the story has changed. The fact that the zone has been expanding downward since the start of spring training has been noted elsewhere, and these numbers paint the same picture.
Recent Strike Zone History
| Year | Strike Zone Size (sq. in) | Strike Zone Size Below 21″ (sq. in) | K% | R/G |
| 2009 | 435 | 0 | 18.0% | 4.61 |
| 2010 | 436 | 6 | 18.5% | 4.38 |
| 2011 | 448 | 11 | 18.6% | 4.28 |
| 2012 | 456 | 19 | 19.8% | 4.32 |
| 2013 | 459 | 30 | 19.9% | 4.17 |
| 2014 | 475 | 47 | 20.4% | 4.07 |
| 2015* | 478 | 51 | 20.1% | 4.19 |
The size and shape of the strike zone in 2015 has evolved to match very closely what was called in 2014. This would be expected, given that umpires are assessed on a nightly basis, their performance has been improving and becoming more consistent, and there was no indication from the league that umpires would be directed to call the zone any differently this season than last.
Perhaps the only surprising part about the first two months of the season has been that despite the strike zone filling out again, run scoring actually has increased. This is largely due to more hits being extra-base hits so far this season, with the league slashing .251/.315/.394 to date compared to last season’s final line of .251/.314/.386. It is also worth noting that at the end of May last season, teams had scored 4.17 runs per game, only to see offense deteriorate over the summer. So year-over-year scoring is, in fact, almost flat.
Here is a visualization of the strike zones to date in 2015, from the umpire’s perspective:
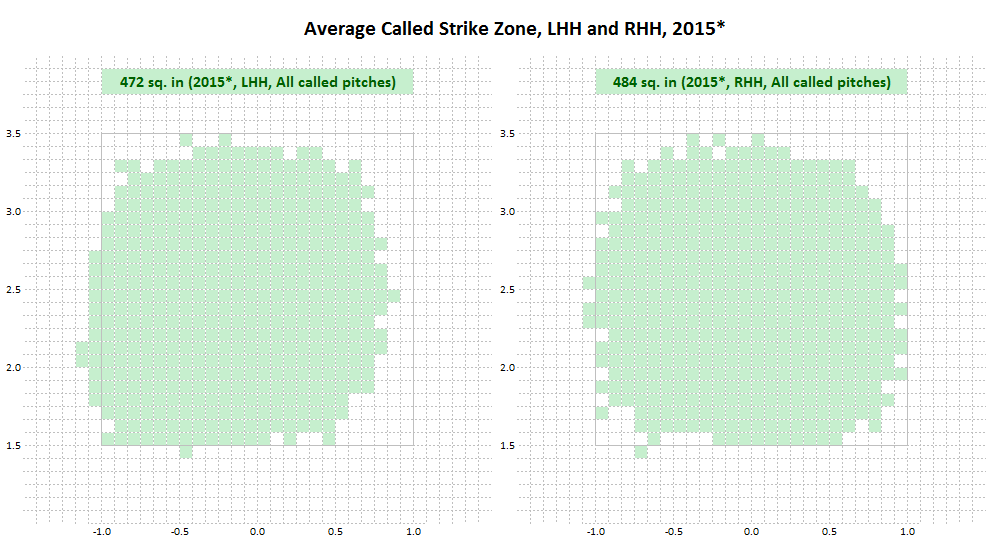
It’s been discussed at length that the strike zone for left-handed hitters is shifted toward the outside of the plate, while the strike zone for right-handed hitters is more or less symmetrical about the center of home plate. You also may have noticed in the strike zone plots that the overall size of the zone for right-handed hitters is larger than that of their left-handed hitting counterparts. This is an aspect I’d like to explore a little further.
To start, here is a recent history of the size of the strike zone by batter handedness:
Recent Strike Zone History, By Batter Handedness
| Year | Left-handed Hitters (sq. in) | Right-handed Hitters (sq. in) | Difference (sq. in) |
| 2009 | 432 | 438 | 6 |
| 2010 | 434 | 439 | 5 |
| 2011 | 446 | 451 | 5 |
| 2012 | 453 | 460 | 7 |
| 2013 | 457 | 462 | 5 |
| 2014 | 467 | 484 | 17 |
| 2015* | 472 | 484 | 12 |
While the zone for righties always has been slightly larger, since the start of last season that gap has noticeably widened. As a frame of reference, the diameter of a baseball is roughly 3.0 inches, which means its 2D area as it crosses the front plane of home plate is about 7.0 square inches. So the zone for right-handed hitters used to be larger by a little under the size of a baseball, but now the difference is more like two to two-and-a-half baseballs. The 2015 gap actually has closed a fair bit over the past 10 days, as it was looking more like the difference in the 2014 season until that point.
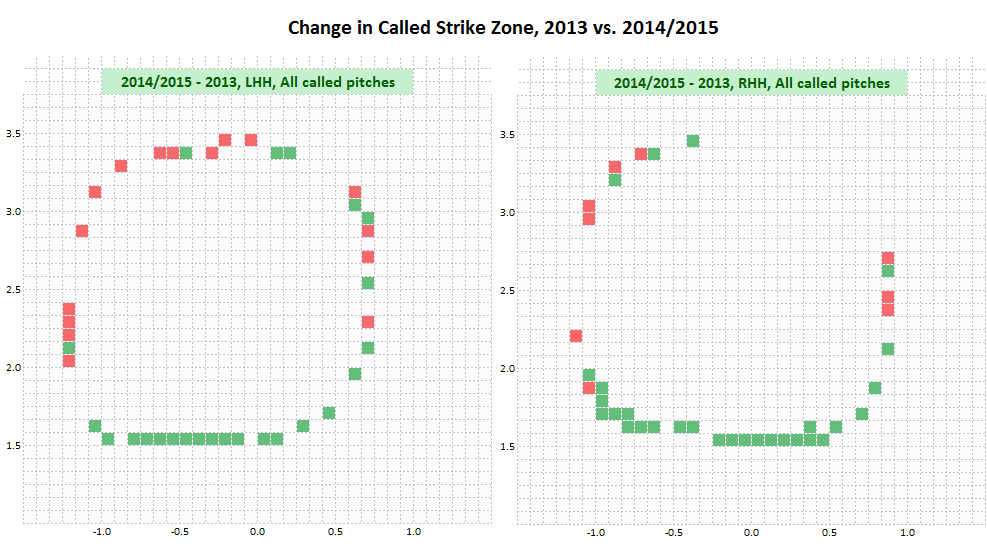
Here is a look at where the strike zone has changed between 2013 and 2014/2015 combined. Again this is from the umpire’s perspective. Green cells indicate areas that have become part of the strike zone, while red cells represent areas that have been dropped out of the strike zone.
While the above plots indicate very specific areas where changes in called pitches have led to cells crossing the threshold to be included in or excluded from the strike zone in the way I’ve defined it, a more complete pictures of recent developments can be gleaned from a heat map of changes across the entire plane at the front of home plate.
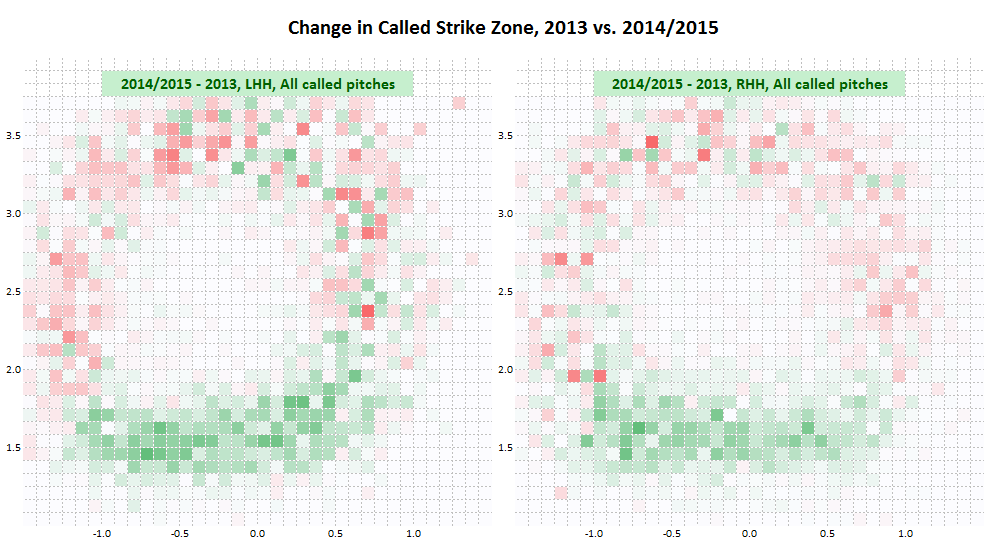
For all hitters, it is not surprising to see the majority of the growth at the expanding bottom of the strike zone. The wider gap in 2014 and 2015 between the right-handed hitter and left-handed hitter zones has come from two sources. First, pitches in the far bottom inside corner of the strike zone to right-handed hitters are now being called strikes more than pitches in the equivalent far bottom inside corner to left-handed hitters. Second, the reduction in the strikes in the high and outside regions of the strike zone has remained muted for right-handed hitters, while the trend is definitely stronger toward contraction of the zone in these same areas for left-handed hitters.
We can observe how walk and strikeout rates have trended over the last several years for right-handed hitters and left-handed hitters independently, as their respective strike zone sizes have changed differently.
Recent Statistics for (Right-handed Hitters – Left-handed Hitters)
| Year | Strike Zone Size (sq. in) | BB% | K% |
| 2009 | 6 | -1.8% | -0.4% |
| 2010 | 5 | -1.7% | -0.7% |
| 2011 | 5 | -1.0% | 0.0% |
| 2012 | 7 | -1.5% | -0.2% |
| 2013 | 5 | -1.2% | 0.1% |
| 2014 | 17 | -1.4% | 1.4% |
| 2015* | 12 | -1.2% | 1.3% |
The strikeout rate difference between right-handed hitters and left-handed hitters jumped significantly in the same year that the theretofore-consistent gap in the strike zone size suddenly increased. In fact, the league strikeout rate for left-handed hitters actually peaked in 2012 at 19.9 percent and has fallen every season since (19.8 percent in 2013, 19.6 percent in 2014, and 19.3 percent to date in 2015).
Left-handed hitters have outperformed their right-handed hitting counterparts in both OBP and OPS in each of the seasons in the table. By having the platoon advantage more often, being a step closer to first base by virtue of their starting point in the batter’s box, and now an even smaller relative strike zone with which to contend, left-handed hitters certainly have some built-in advantages.
If the strike zone really is to be reviewed, and umpires are instructed to call a different size and/or shape of the strike zone at some point in the coming seasons, and be assessed based on that, it would seem prudent to consider the difference in the zones for batters from each side. After a number of years in which both the difference in relative size of the strike zone and the strikeout rate itself for left-handed hitters and right-handed hitters were almost identical, the strike zone has morphed in a way where it is less equitable to right-handed hitters, and they are now striking out at a higher rate than left-handed batters.
References & Resources
- * 2015 data from games up to and including May 26.
- All statistics adapted from Baseball Heat Maps’ PITCHf/x database, Baseball-Reference, and FanGraphs.
What were the sample sizes used for RHB vs LHB?
The sample sizes were all called pitches. In general this is about 200,000 pitches for RHH and 165,000 pitches for LHH in each MLB season.
A fascinating subject to explore would be: at what point will MLB decide to judge balls and strikes by computer rather than by human judgement? And what will the effect on the game and its players?
One guess is that the younger players will start to get much more production. It’s not hard to believe that as rookies come into the league, both as batters and as pitchers, umpires might be less willing to give them the borderline call when working against a veteran. For instance, if someone with a good batting eye– Joey Votto, for one– comes up against a young fireballer…. what are the chances that the borderline pitch will get called a strike? Play that out over a season and a strike here and there for or against a hitter contributes a lot to his ratios (pitching or batting).
Again, a fascinating subject that calls for some expert analysis. In the meantime, when that comes true, run and buy all the 22yr old phenoms!
I’m glad somebody is monitoring this (Mr. Manfred, are you listening?). But you don’t address the pregnant question: why is this happening? I can’t imagine an explanation that does not involve the umpires’ perception directly. Isn’t this recent strike zone expansion roughly correlated to when MLB started tracking the umpires “performance?” Are they being judged/graded down somehow for NOT calling lower strikes? Does anyone know how to access the reports??
I have to wonder if the biological “dominant eye” has any affect on this. It would be interesting to know the various umps’ dominant eye, and then evaluate how they call pitches on the left side of the plate vs. the right side of the plate, regardless of the left- or right-handedness of a batter. It may be that they simply call the two sides of the plate differently because of their dominant eye rather than because they’re being influenced by the handedness of a batter.
Isn’t it about time to automate the calling of strikes so that all the home plate ump does is determine interference, whether the batter has swung, whether the catcher has interfered or tagged a runner and decisions of that kind?
I wonder if the average height of LHB vs. RHB has been checked. Total difference of are equates to <1" of height. Are LHB taller? Hence, larger strike zones?
To me the real question is: What are the exact tools/methods being used by MLB to evaluate umpire’s ball and strike calls?
The pitch tracking applets used by many TV broadcasters during baseball games seem to be relatively accurate, at least based on the camera viewing angle with regards to the plate. I have no idea if MLB is using similar applied technology or using some other method.
I doubt that anyone that has left a comment here has actually umpired a game. Especially not at the professional level. Calling balls and strikes is an art form. Contrary to what most think it isn’t black and white. Computer data and the “K” zone the media uses is not a fair assessment of what should be or not be a ball or a strike. You have to call the “glove”. Meaning how the catcher receives the pitch is a big part in deciding if it is a ball or a strike. If the catcher puts a target on the outside of the “zone” but the pitch comes in on the inside of the “zone” it is not usually going to be called a strike. The catcher had to reach for the ball. Perception is reality and if a catcher has to reach for the ball it most likely was a ball. Conversely this happens at the lower part of the “zone”. How the catcher receives the ball that is at the knees impacts umpires decision. If the catcher “stabs” at the ball and drags his glove down the pitch isn’t going to be called a strike. Conversely if the catcher “sticks” his mitt and receives it well the pitch will most likely be called a strike even though it might be just under the hollow of the knee.
I could go on and on about other factors that make umpiring an art form. Human error is a part of the game. What about the errors the players make? Or stupid base running mistakes? Outfielder takes a bad angle on a ball in the gap? That is human error and everyone accepts that as part of the game. The players dictate the outcome of the game not the umpires.
If you want games to last 4 hours and scores to be 10-8 all of the time then let the steroid era begin again, or go watch slow pitch softball at your local rec facility.
Matt, you assign inevitability to umpire biases that I don’t think is warranted. You say for examples, that umpires *have to* “call the glove.” Who is forcing them to do that? Umpire strike zones are highly malleable, as Jon has showed above, so why assume they cannot be improved?
I also reject the “human error” argument. An outfielder dropping a fly ball is an error committed by one of the *players*, NOT one of the people who is supposed to enforce the rules. People don’t pay to watch the umpires.
Agreed. You might as well say it’s part of the experience to see umpires pick fights with players and throw stars out of the game early.
Tennis has gone to a system that permits players to challenge line calls using (as I understand it) a system of cameras aimed at the lines. I think it’s been a great success; the players are happier and we don’t see the time-wasting histrionics that you saw in the past from guys like McEnroe and Connors. Perhaps some people enjoyed those, but I did not.
Have you ever tried looking for a handbag that looks professional yet elegant at the same time? Louis Vuitton’s newest bag is dedicated to active women looking for a real day-to-business bag.
It seems like we’re seeing alot more dropped third strikes this year too. Do you have any information if this is the case? I would imagine a bigger strike zone has a multiplying effect by causing hitters to chase more bad pitches.